 Duplex
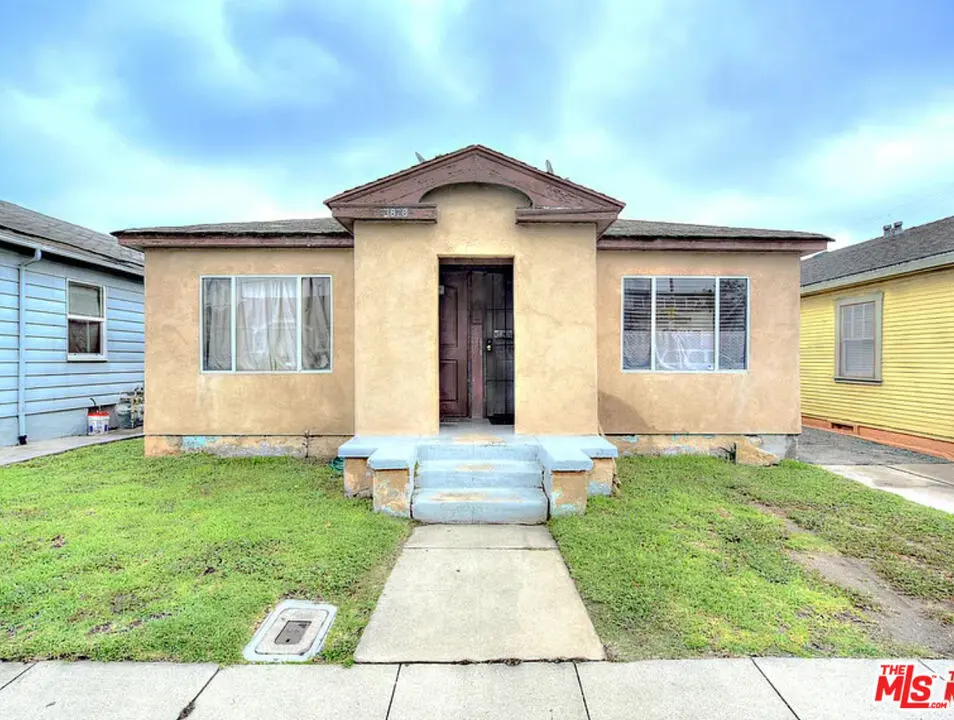
3828 Goldwyn Ter · Los Angeles, CA
Flood risk 1/10 · Minimal
- FEMA flood zone
- X (unshaded)
- Chance of flooding over 30 yrs
- 0.0%
- Est. flood insurance / yr
- $507 – $1,088
Fire risk 1/10 · Minimal
- Est. fire insurance / yr
- $659 – $1,223
Heat risk 6/10 · Moderate
- Hot days now (above 85°F)
- 7 days/yr
- Hot days in 30 yrs
- 21 days/yr
Wind risk 1/10 · Minimal
- Chance of severe wind over 30 yrs
- —
Air-quality risk 4/10 · Minor
- Unhealthy air days now
- 6 days/yr
- Unhealthy air days in 30 yrs
- 7 days/yr
Risk factors via First Street. Map © Google.
Why this score? — see what drove the D grade
The composite is a weighted blend of 9 inputs, each scored 0–100. Each bar is that input's sub-score; the figure is the points it added to the 100-point composite (weight × sub-score).
- ARV discount +15.0/15.0
- Cash flow +8.4/30.0
- Appreciation +6.2/10.0
- Schools +3.6/10.0
- Livability +3.4/5.0
- Condition / age +2.5/5.0
- DSCR +2.3/10.0
- Rent growth +2.1/5.0
- 1% rule +1.4/10.0
$858,995
🖨 Deal sheet (PDF) 📄 Offer letter ✓ Due diligence
Multi-family units
County records classify this as Multi-Family (2-4 Unit). Listing-text estimate: 2 units. confirmed
Listing remarks
Take advantage of an exceptional opportunity in one of Culver City's most desirable neighborhoods. Perfectly positioned just moments from the city's vibrant dining, shopping, and entertainment corridor, 3828/3830 Goldwyn Terrace offers unbeatable walkability, income potential, and long-term value. This charming duplex features two 1-bedroom, 1-bathroom units, each with its own character, comfort, and functionality. The property is in average, well-maintained condition, offering investors and owner-occupants a solid foundation with room to add value through future improvements. One unit will be delivered vacant at closing, making it an excellent opportunity for a buyer to live in one unit wh
Key facts
- Well-located duplex
- 3,350 sq ft lot
- Garage
Tags
Property features AI
Finance
- Other: Property listed As Is
- Financial info: Actual gross annual income: $14,400; Gross operating income: $13,200; Net operating income: $13,200; Total annual expenses: $1,200; Gross rent multiplier: 62; Vacancy rate: 50%; Unit 1 current rent: $1,300 (projected $2,400); Unit 2 projected rent: $2,400
- HOA & community: Total units in complex: 2
Exterior
- Parking: Detached garage
- Home design: One level; Residential income property (duplex)
- Exterior features: No other structures listed; Zoning: LAR3
Interior
- Kitchen: Garbage disposal
- Bedrooms: Unit 1: 1 bedroom; Unit 2: 1 bedroom
- Bathrooms: Unit 1: 1 bathroom; Unit 2: 1 bathroom
- Heating & cooling: Wall heat; No central cooling
- Interior features: Ceiling fan; Garbage disposal; Wall heating
Neighborhood map
What this means for you Summary
Snapshot
- This is a 2 × 1-bed/1.0-bath units multifamily listed at $859k.
Deal economics
- At list price, monthly cash flow is $-774 ($-9k/yr) — negative. Per door: $-387/mo.
- To cash-flow at today's rent, offer at most $722k (15.9% below list).
- To meet the 1% rule (rent ≥ 1% of price), the offer needs to be $546k (36.5% below list).
- Recommended offer: $546k (36.5% below list) — sets the bar for 1% rule.
- Cap rate 5.2% vs local median 2.1% in Los Angeles — top-decile yield for the area; either an underpriced asset or a hidden risk that comps aren't pricing in. Stress-test before assuming the spread holds.
Location & tenants
- Location reads 68/100 on livability (#273 in CA) — a middle-class / working-renter tenant base. Strengths: amenities A+, commute A+, employment B; Watch: health & safety C-, crime F, cost of living F.
- Los Angeles Unified (urban): math 29% / reading 54% proficiency, ranked #223 of 517 in CA (top 43%) — families likely to look elsewhere, expect single-tenant / working-renter base with shorter leases; 67% free/reduced lunch — lower-income household profile, screen leases tightly.
- Zoned schools: Palms Elementary (250 students, 75% FRL); Palms Middle (1,244 students, 66% FRL); Alexander Hamilton Senior High (math 31% / reading 65%, grade D, #380 of 1,170 statewide, top 33%, 2,259 students, 74% FRL) — zoned schools at 72% FRL track the district average.
- Market conditions: Rents soft (-1.6%/yr); 30 active listings in the ZIP; 40 comparable units currently listed for rent nearby; rentals at typical pace (median 17d on market — plan ~3-4 weeks tenant-placement turnaround); high-income renter base; 19,697 units permitted in Los Angeles County in 2024 (9,426 in 5+ unit buildings).
Forward outlook
- In year one you build about $26k of equity ($6k loan paydown + $20k appreciation (2.3% local appreciation)).
- Los Angeles County population projected at +9% by 2050 — modest demand growth; plan on rents tracking national, not racing it.
- By year 3, paydown + projected appreciation supports a ~$66k cash-out refi (75% LTV) — recoverable capital for the next deal without selling this one.
Negotiation context
- It's been on market 28 days — a 2% lower offer ($846k) is reasonable based on typical stale-listing flexibility.
- 4 sale attempts since 7y ago; this cycle's ask has dropped $191k (18%) from the opening price — seller is motivated, your offer sets the floor, not the list.
- Current owner paid $685k; 25% above their basis — modest negotiation headroom, anchor on the comps not their cost.
Risks & watch-outs
- Watch-outs: built in 1923 — expect roof / HVAC / electrical / plumbing capex.
- Climate carrying-cost: extreme-heat days projected 7→21/yr by 2055 (HVAC capex compounding) — expect insurance premiums to compound above CPI over the hold.
Questions for the listing agent
- What do current leases actually rent for vs. the listed asking? Can we see a recent rent roll and the last 12 months of T-12 income?
- Can we see the unit-by-unit rent roll, current vacancy, and any below-market leases? What's the average tenancy length?
- What capital expenditures (roof, boiler, parking lot, exteriors) have been made in the last 5 years, and what's planned in the next 2?
- Built in 1923 — when were the roof, HVAC, electrical panel, plumbing, and water heater last replaced?
- Is there a deadline driving the sale (1031 exchange, divorce, estate, relocation)? That informs how much negotiation room exists.
- Schools are D-rated, which usually means shorter tenancies and higher turnover. Who's the typical renter profile here, and what's been the actual vacancy rate?
- Crime grade is F in this area — have there been break-ins, vandalism, or insurance claims at this property in the last 3 years? What carrier currently insures it and at what premium?
- The area grade is low — what's the realistic commute time and amenity access for the typical tenant pool here? Any planned neighborhood developments (good or bad) we should know about?
- What's the average days-on-market for RENTAL listings here right now (not sales)? A rising rental-DOM trend means longer vacancies and softer asking-rent achievability than the comps imply.
- What's the recent tenant-quality profile in this submarket — average credit score on applications, eviction rate, late-payment / NSF rate, and stable-employment percentage? A property-management company in the area should have these aggregated.
- How much new apartment / multifamily construction is in the pipeline within 1–3 miles? Heavy new supply (>2% of stock underway) typically softens rents 12–24 months out; light construction supports rent growth.
Investment metrics
- 1% rule
- 0.64% ✗
- Cap rate
- 5.21%
- Cash-on-cash
- -3.86%
- DSCR
- 0.83
- GRM
- 13.1
CMA / ARV
- ARV (median comp)
- $1,294,875
- List price
- $858,995
- Delta
- -33.66%
- Verdict
- UNDERPRICED
- Comps
- 4 within 1.0 mi
Projected returns pro-forma
2.34% appreciation · 0.0% rent growth · sell at horizon
- IRR
- 0.6%
- Equity multiple
- 1.03×
- Total profit
- $8,289
- Equity at exit
- $354,908
- IRR
- 3.5%
- Equity multiple
- 1.49×
- Total profit
- $116,977
- Equity at exit
- $523,739
Cash invested: $240,519 (down + closing). Projections, not guarantees.
Landlord ↔ Tenant lean methodology
- Overall (CITY)
- 0 Strongly Tenant-Friendly
- State California
- 18 Strongly Tenant-Friendly · D+13
- County
- — inherits STATE
- City Los Angeles
- 0 Strongly Tenant-Friendly · D+22
ZIP-level market 90232
- Home prices YoY
- 0.5%
- Rents YoY
- -1.6%
- Active inventory
- 30
- Price-to-rent
- 26.2×
Monthly cashflow live
- Estimated rent
- $5,456 high interval (Pro) →
- Mortgage (P&I)
- −$4,505
- Tax from tax record
- −$222 /mo · $2,662/yr
- Insurance
- −$358
- HOA
- −$0
- Vacancy / Maint / Mgmt
- −$1,146
- Net cashflow
- $-774
Break-even live
Sensitivity live
| Price | -10% $-288 | -5% $-531 | +0% $-774 | +5% $-1,017 | +10% $-1,260 |
|---|---|---|---|---|---|
| Rent | -10% $-1,205 | -5% $-990 | +0% $-774 | +5% $-559 | +10% $-343 |
| Rate | -1.0pp $-342 | -0.5pp $-556 | base $-774 | +0.5pp $-997 | +1.0pp $-1,223 |
2-unit breakdown (identical units grouped — click to expand)
| Units | Beds | Baths | Est. rent |
|---|---|---|---|
| 2× units | 1 | 1 | $5,456 |
| #1 | 1 | 1 | $2,728 |
| #2 | 1 | 1 | $2,728 |
| Total (2 units) | $5,456 | ||
UW: 25.0% down · 7.5% · 30yr · 1.5% tax · 5.0% vac · 8.0% maint · 8.0% mgmt
Financing live
Cash to close
- Down payment
- $214,749
- Closing costs
- $25,770
- Reserves months
- —
- Total cash needed
- —
Loan-product check · same deal, 3 products live
Conventional
25% down · 7.5% · 30yr
- Down + closing
- —
- Monthly P&I
- —
- Monthly cashflow
- —
- DSCR
- —
- Eligible?
- —
Personal DTI + credit; lowest rate.
DSCR
20% down · 8.5% · 30yr
- Down + closing
- —
- Monthly P&I
- —
- Monthly cashflow
- —
- DSCR
- —
- Eligible?
- —
No personal income docs; deal must DSCR.
Hard money
10% down · 12.0% · 12mo
- Down + closing
- —
- Monthly P&I
- —
- Monthly cashflow
- —
- DSCR
- —
- Eligible?
- —
Short-term bridge; refi at stabilization.
Rent comps 40 comps
| Address | Beds | Baths | Sqft | Rent | $/sqft | DOM | Units | Dist |
|---|---|---|---|---|---|---|---|---|
| 3839 Motor Ave Apt 201 Culver City, CA | 2.0 | 2.0 | 900 | $3,195 | $3.55 | 45d | 1 | 0.05mi |
| 3839 Motor Ave Culver City, CA | 1.0–2.0 | 1.0–2.0 | 795 | $3,195 | $4.02 | 12d | 3 | 0.05mi |
| 3839 Motor Ave Apt 105 Culver City, CA | 2.0 | 2.0 | 840 | $3,100 | $3.69 | 45d | 1 | 0.05mi |
| 3848 Mentone Ave Culver City, CA | 2.0 | 2.0 | 975 | $3,100 | $3.18 | 26d | 1 | 0.08mi |
| 10375 Washington Blvd Culver City, CA | 2.0 | 1.0–2.0 | 890 | $6,088 | $6.84 | 1d | 14 | 0.08mi |
| 3852 Vinton Ave Culver City, CA | 2.0 | 2.0 | 888 | $2,825 | $3.18 | 24d | 1 | 0.09mi |
| 10401 Washington Blvd Culver City, CA | 1.0–2.0 | 1.0–2.0 | 2052 | $5,900 | $2.88 | 1d | 14 | 0.09mi |
| 3800 Mentone Ave Culver City, CA | 1.0 | 1.0 | 1870 | $3,495 | $1.87 | 3d | 15 | 0.10mi |
| 3771 Vinton Ave Unit 3 Los Angeles, CA | 1.0 | 1.0 | 750 | $2,090 | $2.79 | 15d | 1 | 0.11mi |
| 3766 Motor Ave Unit 507 Los Angeles, CA | 1.0 | 1.0 | 715 | $3,200 | $4.48 | 45d | 1 | 0.11mi |
| 3755 Vinton Ave Unit 6 Los Angeles, CA | 2.0 | 1.5 | 800 | $2,595 | $3.24 | 45d | 1 | 0.14mi |
| 3824 Keystone Ave Culver City, CA | 2.0 | 1.0 | 900 | $3,000 | $3.33 | 45d | 1 | 0.15mi |
| 3746 Vinton Ave Unit 08 Los Angeles, CA | 1.0 | 1.0 | 714 | $1,995 | $2.79 | 4d | 1 | 0.17mi |
| 3732 Mentone Ave Los Angeles, CA | 1.0 | 1.0 | 800 | $2,195 | $2.74 | 45d | 1 | 0.19mi |
| 3851 Keystone Ave Culver City, CA | 2.0 | 1.0 | 775 | $2,375 | $3.06 | 45d | 3 | 0.20mi |
| 3748 Keystone Ave Los Angeles, CA | 2.0 | 1.0–2.0 | 760 | $2,845 | $3.74 | 1d | 3 | 0.21mi |
| 3722 Mentone Ave Unit 8 Los Angeles, CA | 2.0 | 1.0 | 850 | $2,895 | $3.41 | 19d | 1 | 0.21mi |
| 10601 Washington Blvd Culver City, CA | 2.0 | 1.0–2.0 | 809 | $4,895 | $6.05 | 1d | 6 | 0.22mi |
| 3848 Overland Ave Culver City, CA | 2.0 | 2.0 | 795 | $2,453 | $3.09 | 5d | 2 | 0.22mi |
| 3767 Clarington Ave Los Angeles, CA | 1.0 | 1.0 | 782 | $2,975 | $3.80 | 1d | 9 | 0.24mi |
| 3729 Clarington Ave Apt 15 Los Angeles, CA | 3.0 | 2.0 | 1250 | $3,399 | $2.72 | 24d | 1 | 0.27mi |
| 10001 Venice Blvd Los Angeles, CA | 2.0 | 1.0–2.0 | 1009 | $4,599 | $4.56 | 1d | 6 | 0.28mi |
| 3669 Motor Ave Unit 19 Los Angeles, CA | 1.0 | 1.0 | 700 | $2,000 | $2.86 | 26d | 1 | 0.28mi |
| 3671 Vinton Ave Apt 4 Los Angeles, CA | 1.0 | 1.0 | 700 | $2,100 | $3.00 | 45d | 1 | 0.29mi |
| 3838 Dunn Dr Culver City, CA | 1.0 | 1.0 | 1994 | $3,188 | $1.60 | 1d | 16 | 0.29mi |
| 3672 Jasmine Ave Unit 303 Los Angeles, CA | 2.0 | 2.0 | 1100 | $4,895 | $4.45 | 24d | 1 | 0.30mi |
| 3672 Jasmine Ave Unit 303 Los Angeles, CA | 2.0 | 2.0 | 1100 | $4,895 | $4.45 | 45d | 1 | 0.30mi |
| 3657 Motor Ave Los Angeles, CA | 1.0–3.0 | 1.0–3.0 | 684 | $3,595 | $5.26 | 1d | 18 | 0.31mi |
| 9901 Washington Blvd Culver City, CA | 1.0–3.0 | 1.0–2.5 | 1176 | $4,889 | $4.16 | 0d | 14 | 0.31mi |
| 3667 Mentone Ave Unit 8 Los Angeles, CA | 3.0 | 3.0 | 1450 | $5,150 | $3.55 | 17d | 1 | 0.31mi |
| 9900 Venice Blvd Culver City, CA | 1.0 | 1.0 | 593 | $4,280 | $7.22 | 1d | 14 | 0.31mi |
| 3667 Mentone Ave Unit 4 Los Angeles, CA | 2.0 | 1.5 | 1450 | $3,950 | $2.72 | 4d | 1 | 0.31mi |
| 3667 Mentone Ave Unit 5 Los Angeles, CA | 1.0 | 1.0 | 700 | $3,495 | $4.99 | 17d | 1 | 0.31mi |
| 3667 Mentone Ave Unit 2 Los Angeles, CA | 1.0 | 1.0 | 700 | $3,295 | $4.71 | 4d | 1 | 0.31mi |
| 3670 Keystone Ave Unit 02 Los Angeles, CA | 2.0 | 1.5 | 750 | $2,300 | $3.07 | 17d | 1 | 0.32mi |
| 10022 Culver Blvd Unit A Culver City, CA | 1.0 | 1.0 | 700 | $3,495 | $4.99 | 14d | 1 | 0.32mi |
| 3648 Motor Ave Unit 102 Los Angeles, CA | 1.0 | 1.0 | 700 | $2,550 | $3.64 | 26d | 1 | 0.33mi |
| 3648 Motor Ave Unit 102 Los Angeles, CA | 1.0 | 1.0 | 700 | $2,495 | $3.56 | 9d | 1 | 0.33mi |
| 3775 Hughes Ave Los Angeles, CA | 1.0 | 1.0 | 750 | $1,900 | $2.53 | 45d | 1 | 0.33mi |
| 3688 Overland Ave Los Angeles, CA | 2.0 | 1.0–2.0 | 702 | $5,650 | $8.04 | 1d | 12 | 0.33mi |
Listing history 15 events
-
2026-06-04days on market $858,995 Active 28 DOM
-
2026-06-03days on market $858,995 Active 27 DOM
-
2026-06-02days on market $858,995 Active 26 DOM
-
2026-06-01days on market $858,995 Active 25 DOM
-
2026-05-31days on market $858,995 Active 24 DOM
-
2026-05-07$830,000 Active 1357-char remark
-
2025-11-20Active
-
2025-10-27soldstatus $685,000
-
2019-11-23historical
-
2019-11-22historical Expired
-
2019-07-11price
-
2019-03-08Active
-
2019-03-08$1,050,000 Active
-
1985-02-07soldstatus $100,000
-
1964-09-18soldstatus $30,200
ⓘ Source: listings_history table (triggers on properties + properties_extension) + one-shot
backfill from property_details.listing_events for pre-trigger history.
Tax reassessment forecast CA · Resets to sale price
- Current annual tax
- $2,662 · $222/mo
- Projected year-2 tax
- $6,528 · $544/mo
- Expected delta
- +$3,867/yr (+$322/mo · 145.3%)
ⓘ Screening estimate from a state-policy table — verify with the county assessor before closing.
Climate risk First Street
- Flood 1/10 Low FEMA zone X (unshaded) · 0% chance over 30 yrs
- Wildfire 1/10 Low
- Heat 6/10 Major 7 d/yr ≥85°F today · 21 d/yr by 30 yrs out
- Wind 1/10 Low
- Air quality 4/10 Moderate 6 unhealthy d/yr today · 7 by 30 yrs out
Nearby sold comps map
Loading sold comps map…
Walkable amenities ~0.75 mi
Loading nearby amenities…
Taxation est. · year 1
- Rental income
- $65,472
- − Mortgage interest
- −$48,117
- − Property taxes
- −$2,662
- − Insurance
- −$4,295
- − Repairs & maintenance
- −$5,238
- − Management
- −$5,238
- − Depreciation
- −$24,989
- Taxable loss
- −$25,066
- Est. tax savings @ 24.0%
- +$6,016
- After-tax cash flow
- $-3,274/yr
For passive investors: Depreciation is non-cash, so a rental often shows a tax loss while cash-flowing — sheltering income. Rental losses are passive: they offset passive income freely, and up to $25,000/yr can offset ordinary (W-2) income if you actively participate and your MAGI is under $100k (phasing out to $0 by $150k); unused losses carry forward. On sale, claimed depreciation is recaptured at up to 25%, and gains may owe capital-gains tax (a 1031 exchange can defer both). Figures are a year-1 estimate at your 24.0% rate — not tax advice; consult a CPA.
Schools (NCES district)
- District
- Los Angeles Unified
- NCES district ID
- 0622710
- Math proficiency
- 29% ▼ -4.00%
- Reading proficiency
- 54% ▲ 10.00%
- Median HH income
- $50,403
- Composite
- 35.67/100
- National rank
- #4875
- State rank
- #223 of 517 in CA
Livability — Los Angeles
- Score
- 68/100
- State rank
- #273
- US rank
- #9237
Category grades
Schools grade is shown separately in the Schools card above.
Census & demographics
- Census place
- Los Angeles, CA
- County
- Los Angeles County · 9,444,647 people
- City population
- 3,838,149
- Metro
- Los Angeles-Long Beach-Anaheim, CA
- Population (ZIP)
- 16,554
- Household income
- $122,396
- Rent vs Own
- Severe rent burden
- 1159.0
Population outlook (Los Angeles County) Hauer SSP2
- Today (2025)
- 10,940,515 people
- By 2030
- 11,256,481 · +2.9%
- By 2040
- 11,729,929 · +7.2%
- By 2050
- 11,948,407 · +9.2%
- By 2075
- 11,818,114 · +8.0%
- By 2100
- 10,842,928 · -0.9%
Race, ethnicity, and origin ACS 2023
- Neighborhood character
- Diverse neighborhood (Simpson 0.67)
- Race & ethnicity
- White 50% Asian 21% Hispanic / Latino 19% Two or more races 16% Black 4%
- Hispanic origin (detail)
- Mexican 12%
- Common ancestry
- Scotch-Irish 4% Romanian 4% Lithuanian 3%
- Foreign-born
- 22% · Canada, China, Philippines
- Languages at home
- 67% English-only · Spanish 16% Chinese 4% Other Indo-European 4%
Political lean MEDSL · Los Angeles
- 2024 margin
- Solid D (+32.9) · D 64.8% · R 31.9% · Other 3.3%
- 2008→2024 swing
- -7.4pp toward R · 2008: 40.4pp · 2024: 32.9pp
- All cycles
- 2024: D+32.9 2020: D+44.2 2016: D+48.0 2012: D+40.0 2008: D+40.4
Not yet ingested
- Civics
- —
Market trends
- HPI YoY
- ▲ 2.34%
- Current HPI
- 473.1563
- Rent YoY
- ▼ -1.65%
- Metro
- Los Angeles-Long Beach-Anaheim, CA
- State GDP YoY
- ▲ 3.21%
- F500 in state
- 116
Industry mix (Fortune 500 HQ in CA)
| Industry | F500 HQs | Revenue |
|---|---|---|
| Technology | 27 | $1,492B |
|
||
| Financial Services | 3 | $174B |
|
||
| Retail | 3 | $44B |
|
||
| Insurance | 3 | $26B |
|
||
| Media / Entertainment | 2 | $115B |
|
||
| Pharmaceuticals / Biotech | 2 | $62B |
|
||
Price history
+2168.2% since first listed12 events — show timeline
- 2026-06-04 Price Changed — TheMLS
- 2026-05-22 Price Changed — TheMLS
- 2026-05-07 Listed — TheMLS
- 2025-11-20 Listed — TheMLS
- 2025-10-27 Sold (Public Records) $685,000 Public Records
- 2019-11-23 Listing Removed — SDMLS
- 2019-11-22 Delisted — TheMLS
- 2019-07-11 Price Changed — TheMLS
- 2019-03-08 Listed $1,050,000 SDMLS
- 2019-03-08 Listed — TheMLS
- 1985-02-07 Sold (Public Records) $100,000 Public Records
- 1964-09-18 Sold (Public Records) $30,200 Public Records
Property tax history
+1.7%/yrLatest (2025): $2,662 · +1.4% YoY. Source: county tax records.
Cash-flow waterfall
monthlySold comps — $/sqft
last 12 mo · ≤1 miLoading sold comps…