 Triplex
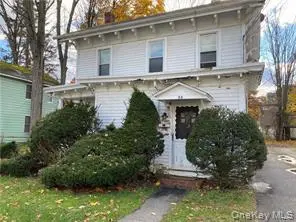
39 Canal St · Ellenville, NY
Flood risk 1/10 · Minimal
- FEMA flood zone
- X (unshaded)
- Chance of flooding over 30 yrs
- 0.0%
- Est. flood insurance / yr
- $473 – $860
Fire risk 3/10 · Minor
- Est. fire insurance / yr
- $691 – $1,283
Heat risk 4/10 · Minor
- Hot days now (above 96°F)
- 8 days/yr
- Hot days in 30 yrs
- 19 days/yr
Wind risk 3/10 · Minor
- Chance of severe wind over 30 yrs
- 8.0%
Air-quality risk 2/10 · Minimal
- Unhealthy air days now
- 1 days/yr
- Unhealthy air days in 30 yrs
- 1 days/yr
Risk factors via First Street. Map © Google.
Why this score? — see what drove the A- grade
The composite is a weighted blend of 9 inputs, each scored 0–100. Each bar is that input's sub-score; the figure is the points it added to the 100-point composite (weight × sub-score).
- Cash flow +30.0/30.0
- ARV discount +11.5/15.0
- 1% rule +10.0/10.0
- DSCR +10.0/10.0
- Appreciation +10.0/10.0
- Schools +3.3/10.0
- Livability +3.0/5.0
- Rent growth +2.5/5.0
- Condition / age +2.5/5.0
$319,000
🖨 Deal sheet 📄 Offer letter ✓ Due diligence
Multi-family units
County records classify this as Multi-Family (2-4 Unit). Listing-text estimate: 3 units. confirmed
Listing remarks MLS
Three unit building located in the Village of Ellenville. Easy walk to restaurants, shopping, theatre. Building is fully rented, tenants would like to remain. 48 hours' notice required for showings. Additional Information: HeatingFuel:Oil Above Ground,
Key facts
- 6,534 sq ft lot
- Built 1930
- Listed 31 days
Property features AI
Exterior
- Parking: Driveway
- Utilities: Public sewer; Electricity available
- Home design: Triplex
- Construction: Frame construction
- Exterior features: Frame construction; Not waterfront
Interior
- Heating & cooling: Electric heating; Oil heating; Other heating; No cooling
- Interior features: Other interior features
Neighborhood map
What this means for you Summary
Snapshot
- This is a 3 × 3-bed/1.0-bath units multifamily listed at $319k.
Deal economics
- At list price, monthly cash flow is $1k ($17k/yr) — positive. Per door: $468/mo.
- The deal already cash-flows at list — no discount required.
- Meets the 1% rule at list price ($5k rent vs $319k).
- Recommended offer: $309k (3.0% below list) — sets the bar for market timing.
Location & tenants
- Location reads 60/100 on livability (#961 in NY) — a middle-class / working-renter tenant base. Strengths: cost of living A, housing A-; Watch: crime C-, amenities F, commute F.
- Ellenville Central School District (town): math 32% / reading 46% proficiency, ranked #534 of 590 in NY (top 90%) — families likely to look elsewhere, expect single-tenant / working-renter base with shorter leases.
- Zoned schools: Ellenville Elementary School (math 17% / reading 42%, grade F, #1,729 of 2,108 statewide, top 84%, 674 students, 61% FRL); Ellenville Junior/Senior High School (math 82% / reading 82%, grade A, #452 of 1,100 statewide, top 44%, 731 students, 64% FRL).
- Zoned-school proficiency averages 56% at this address vs 39% district-wide (+17 pts) — the actual schools serving this property are materially stronger than the Ellenville Central School District average implies; a family-tenant draw the district grade alone would hide.
- Market conditions: 70 active listings in the ZIP; 1 comparable units currently listed for rent nearby; 464 units permitted in Ulster County in 2024 (170 in 5+ unit buildings).
Forward outlook
- In year one you build about $34k of equity ($2k loan paydown + $32k appreciation (10.0% local appreciation)).
- Ulster County population projected at -14% by 2050 — secular population decline; favor cash flow + early exit over multi-decade hold.
- At projected returns (10.0% appreciation + 3.0% rent growth), your $89k cash investment doubles in ~2 years — after that, you're playing with house money.
- By year 2, paydown + projected appreciation supports a ~$55k cash-out refi (75% LTV) — recoverable capital for the next deal without selling this one.
Negotiation context
- It's been on market 31 days — a 3% lower offer ($309k) is reasonable based on typical stale-listing flexibility.
- 6 sale attempts since 11y ago with the ask held roughly flat each time — persistent listings suggest the price (not the market) is what's stuck; bring a comps-based counter.
- Current owner paid $168k; list at $319k implies a 90% gain — meaningful room to come down on a strong offer.
Risks & watch-outs
- Watch-outs: built in 1930 — expect roof / HVAC / electrical / plumbing capex.
Questions for the listing agent
- It's been on market 31 days. Have you received any prior offers? Is the seller open to a 3% concession, seller financing, or rate buy-down credit?
- Can we see the unit-by-unit rent roll, current vacancy, and any below-market leases? What's the average tenancy length?
- What capital expenditures (roof, boiler, parking lot, exteriors) have been made in the last 5 years, and what's planned in the next 2?
- Built in 1930 — when were the roof, HVAC, electrical panel, plumbing, and water heater last replaced?
- Is there a deadline driving the sale (1031 exchange, divorce, estate, relocation)? That informs how much negotiation room exists.
- Schools are D-rated, which usually means shorter tenancies and higher turnover. Who's the typical renter profile here, and what's been the actual vacancy rate?
- What's the average days-on-market for RENTAL listings here right now (not sales)? A rising rental-DOM trend means longer vacancies and softer asking-rent achievability than the comps imply.
- What's the recent tenant-quality profile in this submarket — average credit score on applications, eviction rate, late-payment / NSF rate, and stable-employment percentage? A property-management company in the area should have these aggregated.
- How much new apartment / multifamily construction is in the pipeline within 1–3 miles? Heavy new supply (>2% of stock underway) typically softens rents 12–24 months out; light construction supports rent growth.
Investment metrics
- 1% rule
- 1.53% ✓
- Cap rate
- 11.58%
- Cash-on-cash
- 18.87%
- DSCR
- 1.84
- GRM
- 5.4
CMA / ARV
- ARV (on-the-fly)
- $350,336
- Comps found
- 6
Show comp detail 6 sales within ~0.75 mi
| Address | Dist | Beds/Ba | Sqft | Sold | Price | $/sf | Match |
|---|---|---|---|---|---|---|---|
| 5 Park St | 0.12mi | 4/2.0 | 2,140 (-2%) | 2mo | $275,000 | $129 | 86 |
| 6 Park St | 0.13mi | 4/2.0 | 2,208 (+2%) | 8mo | $355,000 | $161 | 81 |
| 27 Canal St | 0.12mi | 5/2.0 (+1) | 2,352 (+8%) | 7mo | $193,800 | $82 | 66 |
| 15 Essex St #2 | 0.31mi | 4/3.5 | 2,000 (-8%) | 13mo | $330,000 | $165 | 59 |
| 49 Warren St | 0.38mi | 5/3.0 (+1) | 2,000 (-8%) | 19mo | $402,000 | $201 | 48 |
| 129 Center St | 0.49mi | 4/2.0 | 1,934 (-11%) | 22mo | $210,000 | $109 | 36 |
Match score weights: distance 35% · size 25% · config 20% · recency 20%. Top-matched comps best support the ARV.
Projected returns pro-forma
10.0% appreciation · 3.0% rent growth · sell at horizon
- IRR
- 38.3%
- Equity multiple
- 3.95×
- Total profit
- $263,413
- Equity at exit
- $287,380
- IRR
- 33.0%
- Equity multiple
- 8.90×
- Total profit
- $705,820
- Equity at exit
- $619,747
Cash invested: $89,320 (down + closing). Projections, not guarantees.
Landlord ↔ Tenant lean methodology
- Overall (STATE)
- 15 Strongly Tenant-Friendly
- State New York
- 15 Strongly Tenant-Friendly · D+10
- County
- — inherits STATE
- City
- — inherits STATE
ZIP-level market 12428
- Home prices YoY
- 20.0%
- Active inventory
- 70
- Price-to-rent
- 16.3×
Monthly cashflow live
- Estimated rent
- $4,887 medium interval (Pro) →
- Mortgage (P&I)
- −$1,673
- Tax from tax record
- −$651 /mo · $7,806/yr
- Insurance
- −$133
- HOA
- −$0
- Vacancy / Maint / Mgmt
- −$1,026
- Net cashflow
- $1,404
Break-even live
3-unit breakdown (identical units grouped — click to expand)
| Units | Beds | Baths | Est. rent |
|---|---|---|---|
| 3× units | 3 | 1 | $4,887 |
| #1 | 3 | 1 | $1,629 |
| #2 | 3 | 1 | $1,629 |
| #3 | 3 | 1 | $1,629 |
| Total (3 units) | $4,887 | ||
UW: 25.0% down · 7.5% · 30yr · 1.5% tax · 5.0% vac · 8.0% maint · 8.0% mgmt
Financing live
Cash to close
- Down payment
- $79,750
- Closing costs
- $9,570
- Reserves months
- —
- Total cash needed
- —
Loan-product check · same deal, 3 products live
Conventional
25% down · 7.5% · 30yr
- Down + closing
- —
- Monthly P&I
- —
- Monthly cashflow
- —
- DSCR
- —
- Eligible?
- —
Personal DTI + credit; lowest rate.
DSCR
20% down · 8.5% · 30yr
- Down + closing
- —
- Monthly P&I
- —
- Monthly cashflow
- —
- DSCR
- —
- Eligible?
- —
No personal income docs; deal must DSCR.
Hard money
10% down · 12.0% · 12mo
- Down + closing
- —
- Monthly P&I
- —
- Monthly cashflow
- —
- DSCR
- —
- Eligible?
- —
Short-term bridge; refi at stabilization.
Rent comps 1 comps
| Address | Beds | Baths | Sqft | Rent | $/sqft | DOM | Units | Dist |
|---|---|---|---|---|---|---|---|---|
| 14 Warren St Ellenville, NY | 3.0 | 2.0 | 1500 | $2,000 | $1.33 | 43d | 1 | 0.17mi |
Listing history 32 events
-
2026-06-18days on market $319,000 Active 31 DOM
-
2026-06-17days on market $319,000 Active 30 DOM
-
2026-06-16days on market $319,000 Active 29 DOM
-
2026-06-15days on market $319,000 Active 28 DOM
-
2026-06-13days on market $319,000 Active 26 DOM
-
2026-06-12days on market $319,000 Active 25 DOM
-
2026-06-09days on market $319,000 Active 22 DOM
-
2026-06-08days on market $319,000 Active 21 DOM
-
2026-06-07days on market $319,000 Active 20 DOM
-
2026-06-07days on market $319,000 Active 19 DOM
-
2026-06-04days on market $319,000 Active 16 DOM
-
2026-06-02days on market $319,000 Active 15 DOM
-
2026-06-01days on market $319,000 Active 14 DOM
-
2026-05-31days on market $319,000 Active 13 DOM
-
2026-05-18$319,000 Active
-
2022-02-22soldstatus $167,500
-
2022-01-17soldstatus $169,000 Closed 252-char remark
Show marketing remark (252 chars)
Three unit building located in the Village of Ellenville. Easy walk to restaurants, shopping, theatre. Building is fully rented, tenants would like to remain. 48 hours' notice required for showings. Additional Information: HeatingFuel:Oil Above Ground,
-
2022-01-12status Pending 252-char remark
Show marketing remark (252 chars)
Three unit building located in the Village of Ellenville. Easy walk to restaurants, shopping, theatre. Building is fully rented, tenants would like to remain. 48 hours' notice required for showings. Additional Information: HeatingFuel:Oil Above Ground,
-
2022-01-11soldstatus $169,000 Sold 198-char remark
Show marketing remark (198 chars)
Three unit building located in the Village of Ellenville. Easy walk to restaurants, shopping, theatre. Building is fully rented, tenants would like to remain. 48 hours' notice required for showings.
-
2021-12-15historical Accepted (Show) 198-char remark
Show marketing remark (198 chars)
Three unit building located in the Village of Ellenville. Easy walk to restaurants, shopping, theatre. Building is fully rented, tenants would like to remain. 48 hours' notice required for showings.
-
2021-11-16$195,000 Active 198-char remark
Show marketing remark (252 chars)
Three unit building located in the Village of Ellenville. Easy walk to restaurants, shopping, theatre. Building is fully rented, tenants would like to remain. 48 hours' notice required for showings. Additional Information: HeatingFuel:Oil Above Ground,
-
2021-11-16$195,000 Active 252-char remark
Show marketing remark (252 chars)
Three unit building located in the Village of Ellenville. Easy walk to restaurants, shopping, theatre. Building is fully rented, tenants would like to remain. 48 hours' notice required for showings. Additional Information: HeatingFuel:Oil Above Ground,
-
2020-03-18soldstatus $80,000
-
2016-04-25historical
-
2016-03-29$119,000
-
2015-09-28$119,000
-
2015-09-28$119,000
-
2011-05-26soldstatus $98,000
-
2009-09-03soldstatus $95,000
-
2003-01-06soldstatus $83,000
-
2001-07-26soldstatus $41,000
-
2001-06-05soldstatus $41,000
ⓘ Source: listings_history table (triggers on properties + properties_extension) + one-shot
backfill from property_details.listing_events for pre-trigger history.
Tax reassessment forecast NY · Partial reset (capped growth)
- Current annual tax
- $7,806 · $651/mo
- Projected year-2 tax
- $7,806 · $651/mo
- Expected delta
- $0/yr ($0/mo · 0.0%)
ⓘ Screening estimate from a state-policy table — verify with the county assessor before closing.
Climate risk First Street
- Flood 1/10 Low FEMA zone X (unshaded) · 0% chance over 30 yrs
- Wildfire 3/10 Moderate
- Heat 4/10 Moderate 8 d/yr ≥96°F today · 19 d/yr by 30 yrs out
- Wind 3/10 Moderate 8% chance of damaging wind over 30 yrs
- Air quality 2/10 Low 1 unhealthy d/yr today · 1 by 30 yrs out
Nearby sold comps map
Loading sold comps map…
Walkable amenities ~0.75 mi
Loading nearby amenities…
Taxation est. · year 1
- Rental income
- $58,644
- − Mortgage interest
- −$17,869
- − Property taxes
- −$7,806
- − Insurance
- −$1,595
- − Repairs & maintenance
- −$4,692
- − Management
- −$4,692
- − Depreciation
- −$9,280
- Taxable income
- $12,711
- Est. tax owed @ 24.0%
- −$3,051
- After-tax cash flow
- $13,802/yr
For passive investors: Depreciation is non-cash, so a rental often shows a tax loss while cash-flowing — sheltering income. Rental losses are passive: they offset passive income freely, and up to $25,000/yr can offset ordinary (W-2) income if you actively participate and your MAGI is under $100k (phasing out to $0 by $150k); unused losses carry forward. On sale, claimed depreciation is recaptured at up to 25%, and gains may owe capital-gains tax (a 1031 exchange can defer both). Figures are a year-1 estimate at your 24.0% rate — not tax advice; consult a CPA.
Schools (NCES district)
- District
- Ellenville Central School District
- NCES district ID
- 3610500
- Math proficiency
- 32% ▼ -6.00%
- Reading proficiency
- 46% ▲ 10.00%
- Median HH income
- $45,937
- Composite
- 33.22/100
- National rank
- #5525
- State rank
- #534 of 590 in NY
Livability — Ellenville
- Score
- 60/100
- State rank
- #961
- US rank
- #18871
Category grades
Schools grade is shown separately in the Schools card above.
Census & demographics
- Census place
- Ellenville, NY
- Population (ZIP)
- 6,972
Population outlook (Ulster County) Hauer SSP2
- Today (2025)
- 175,887 people
- By 2030
- 171,876 · -2.3%
- By 2040
- 161,771 · -8.0%
- By 2050
- 151,470 · -13.9%
- By 2075
- 133,023 · -24.4%
- By 2100
- 113,504 · -35.5%
Race, ethnicity, and origin ACS 2023
- Neighborhood character
- Majority White (63%)
- Race & ethnicity
- White 63% Hispanic / Latino 28% Two or more races 9% Black 4%
- Hispanic origin (detail)
- Mexican 1% Puerto Rican 17% Dominican 4%
- Common ancestry
- Romanian 5% Italian 3% Lithuanian 3%
- Foreign-born
- 9% · Canada, Jamaica, Dominican Republic
- Languages at home
- 75% English-only · Spanish 20% Russian/Polish/Slavic 4% Other Indo-European 1%
Political lean MEDSL · Ulster
- 2024 margin
- D (+18.7) · D 59.3% · R 40.7%
- 2008→2024 swing
- -4.9pp toward R · 2008: 23.6pp · 2024: 18.7pp
- All cycles
- 2024: D+18.7 2020: D+20.9 2016: D+9.1 2012: D+21.9 2008: D+23.6
Not yet ingested
- Civics
- —
Market trends
- HPI YoY
- ▲ 62.17%
- Current HPI
- 372.5352
- Rent YoY
- —
- Metro
- —
- State GDP YoY
- ▲ 2.60%
- F500 in state
- 92
Industry mix (Fortune 500 HQ in NY)
| Industry | F500 HQs | Revenue |
|---|---|---|
| Financial Services | 10 | $950B |
|
||
| Consumer Goods | 9 | $162B |
|
||
| Insurance | 4 | $225B |
|
||
| Telecommunications | 2 | $144B |
|
||
| Pharmaceuticals | 2 | $112B |
|
||
| Media / Entertainment | 2 | $69B |
|
||
Price history
+678.0% since first listed18 events — show timeline
- 2026-05-18 Listed $319,000 OneKey® MLS as Distributed by MLS Grid
- 2022-02-22 Sold (Public Records) $167,500 Public Records
- 2022-01-17 Sold (MLS) $169,000 OneKey® MLS as Distributed by MLS Grid
- 2022-01-12 Pending — OneKey® MLS as Distributed by MLS Grid
- 2022-01-11 Sold (MLS) $169,000 HVCRMLS
- 2021-12-15 Contingent — HVCRMLS
- 2021-11-16 Listed $195,000 OneKey® MLS as Distributed by MLS Grid
- 2021-11-16 Listed $195,000 HVCRMLS
- 2020-03-18 Sold (Public Records) $80,000 Public Records
- 2016-04-25 Listing Removed — OneKey® MLS as Distributed by MLS Grid
- 2016-03-29 Listed $119,000 HVCRMLS
- 2015-09-28 Listed $119,000 OneKey® MLS as Distributed by MLS Grid
- 2015-09-28 Listed $119,000 HVCRMLS
- 2011-05-26 Sold (Public Records) $98,000 Public Records
- 2009-09-03 Sold (Public Records) $95,000 Public Records
- 2003-01-06 Sold (Public Records) $83,000 Public Records
- 2001-07-26 Sold (Public Records) $41,000 Public Records
- 2001-06-05 Sold (Public Records) $41,000 Public Records
Property tax history
+3.3%/yrLatest (2025): $7,806 · +51.9% YoY. Source: county tax records.
Cash-flow waterfall
monthlySold comps — $/sqft
last 12 mo · ≤1 miLoading sold comps…