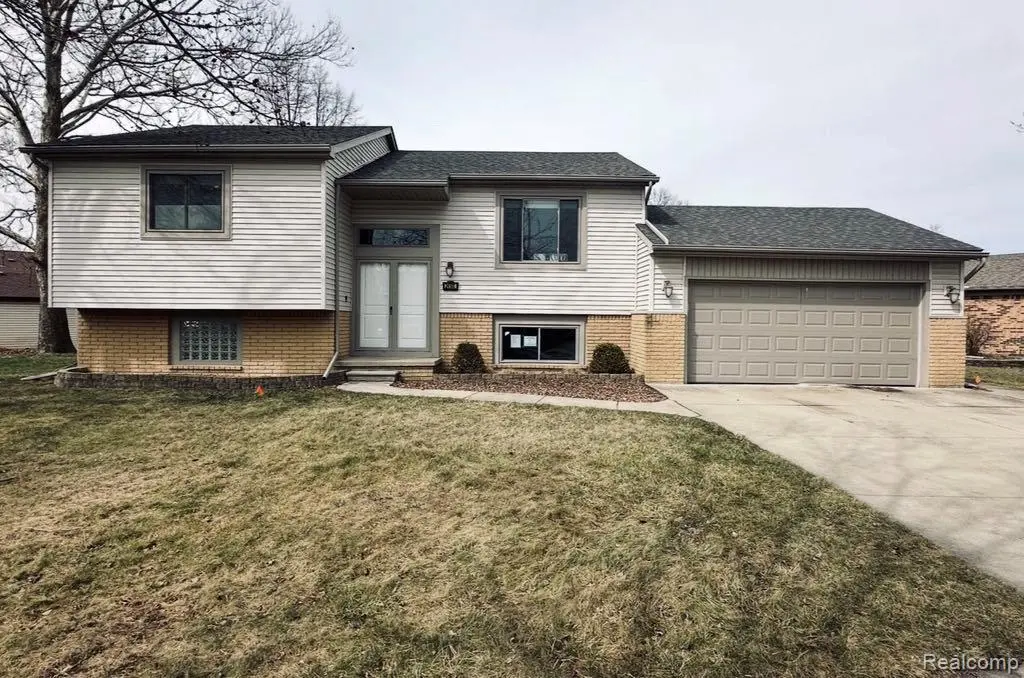
24500 Cornell Ave · Woodhaven, MI
Flood risk 1/10 · Minimal
- FEMA flood zone
- X (shaded)
- Chance of flooding over 30 yrs
- 0.0%
- Est. flood insurance / yr
- $507 – $1,088
Fire risk 1/10 · Minimal
- Est. fire insurance / yr
- $784 – $1,456
Heat risk 3/10 · Minor
- Hot days now (above 98°F)
- 7 days/yr
- Hot days in 30 yrs
- 15 days/yr
Wind risk 2/10 · Minimal
- Chance of severe wind over 30 yrs
- —
Air-quality risk 3/10 · Minor
- Unhealthy air days now
- 2 days/yr
- Unhealthy air days in 30 yrs
- 5 days/yr
Risk factors via First Street. Map © Google.
Why this score? — see what drove the D+ grade
The composite is a weighted blend of 9 inputs, each scored 0–100. Each bar is that input's sub-score; the figure is the points it added to the 100-point composite (weight × sub-score).
- ARV discount +15.0/15.0
- Cash flow +14.0/30.0
- DSCR +4.2/10.0
- Livability +4.2/5.0
- 1% rule +3.6/10.0
- Schools +3.6/10.0
- Rent growth +2.5/5.0
- Condition / age +2.5/5.0
- Appreciation +0.0/10.0
$265,000
🖨 Deal sheet 📄 Offer letter ✓ Due diligence
Listing remarks MLS
THIS IS A HUD HOME. BEING SOLD AS IS. THIS IS AN EXCLUSIVE LISTING. OWNER OCCUPANT BIDS ONLY FOR THE FIRST 15 DAYS ON MARKET. SOLID BI-LEVEL HOME WITH UPDATES THROUGHOUT. READY TO MOVE IN. HARDWOOD FLOORS THROUGHOUT. UPDATED BATHS WITH CERAMIC TILE. UPDATED KITCHEN. ATTACHED 2 CAR GARAGE. HUGE BACKYARD DECK. WOODHAVEN SCHOOL SYSTEM. BUYER TO ORDER FINAL WATER READING PRIOR TO CLOSING. BUYER TO ORDER FINAL WATER READING PRIOR TO CLOSING.
Key facts
- 0.23 acre lot
- 2 garage spots
- Built 1978
Neighborhood map
What this means for you Summary
Snapshot
- This is a 4-bed/2.0-bath single-family listed at $265k.
Deal economics
- At list price, monthly cash flow is $34 ($412/yr) — positive.
- The deal already cash-flows at list — no discount required.
- To meet the 1% rule (rent ≥ 1% of price), the offer needs to be $227k (14.4% below list).
- Recommended offer: $227k (14.4% below list) — sets the bar for 1% rule.
- Cap rate 6.4% vs local median 3.7% in Woodhaven — top-decile yield for the area; either an underpriced asset or a hidden risk that comps aren't pricing in. Stress-test before assuming the spread holds.
Location & tenants
- Location reads 83/100 on livability (#49 in MI, #1,017 nationally) — a professional / high-income tenant draw. Strengths: cost of living A+, housing A+, health & safety A+; Watch: commute F.
- Woodhaven-Brownstown School District (suburban): math 32% / reading 49% proficiency, ranked #189 of 540 in MI (top 35%) — families likely to look elsewhere, expect single-tenant / working-renter base with shorter leases.
- Market conditions: 171 active listings in the ZIP; 2 comparable units currently listed for rent nearby; solid renter incomes; 2,639 units permitted in Wayne County in 2024 (1,216 in 5+ unit buildings).
- This rent runs 33% of the median local income ($84k/yr) — at the standard rent-burdened threshold; future hikes will face affordability resistance.
Forward outlook
- Local home prices are declining (-3.0%/yr); year-one equity from $2k of loan paydown is wiped out by about $8k of value loss. Plan a longer hold.
- Wayne County population projected at -17% by 2050 — secular population decline; favor cash flow + early exit over multi-decade hold.
Negotiation context
- It's been on market 40 days — a 3% lower offer ($257k) is reasonable based on typical stale-listing flexibility.
- 15 sale attempts since 28y ago; this cycle's ask has dropped $29k (10%) from the opening price — seller is motivated, your offer sets the floor, not the list.
Questions for the listing agent
- It's been on market 40 days. Have you received any prior offers? Is the seller open to a 14% concession, seller financing, or rate buy-down credit?
- Built in 1978 — when were the roof, HVAC, electrical panel, plumbing, and water heater last replaced?
- Is there a deadline driving the sale (1031 exchange, divorce, estate, relocation)? That informs how much negotiation room exists.
- The area grade is low — what's the realistic commute time and amenity access for the typical tenant pool here? Any planned neighborhood developments (good or bad) we should know about?
- What's the average days-on-market for RENTAL listings here right now (not sales)? A rising rental-DOM trend means longer vacancies and softer asking-rent achievability than the comps imply.
- What's the recent tenant-quality profile in this submarket — average credit score on applications, eviction rate, late-payment / NSF rate, and stable-employment percentage? A property-management company in the area should have these aggregated.
- How much new for-sale + rental construction is in the pipeline within 1–3 miles? Heavy new supply typically softens prices + rents 12–24 months out; constrained supply supports both.
Investment metrics
- 1% rule
- 0.86% ✗
- Cap rate
- 6.45%
- Cash-on-cash
- 0.55%
- DSCR
- 1.02
- GRM
- 9.7
CMA / ARV
- ARV (median comp)
- $430,553
- List price
- $265,000
- Delta
- -38.45%
- Verdict
- UNDERPRICED
- Comps
- 20 within 1.0 mi
Show comp detail 12 sales within ~0.75 mi
| Address | Dist | Beds/Ba | Sqft | Sold | Price | $/sf | Match |
|---|---|---|---|---|---|---|---|
| 24407 Westpointe St | 0.07mi | 3/1.5 (-1) | 2,155 (+7%) | 1mo | $297,119 | $138 | 77 |
| 24272 Charles Dr | 0.26mi | 3/2.0 (-1) | 1,909 (-5%) | 5mo | $340,000 | $178 | 71 |
| 24231 Wilson Dr | 0.23mi | 4/2.5 | 1,908 (-5%) | 12mo | $397,000 | $208 | 69 |
| 23601 Oakleigh Ave | 0.66mi | 3/2.5 (-1) | 2,028 (+1%) | 1mo | $408,000 | $201 | 60 |
| 24550 Colonial Dr | 0.51mi | 4/2.5 | 2,141 (+6%) | 7mo | $289,900 | $135 | 57 |
| 22534 Provincial St | 0.61mi | 3/2.5 (-1) | 2,125 (+6%) | 2mo | $285,000 | $134 | 54 |
| 24864 Christina Dr | 0.74mi | 4/2.5 | 1,996 (-1%) | 11mo | $390,000 | $195 | 53 |
| 24688 Emily Dr | 0.39mi | 3/3.5 (-1) | 1,848 (-8%) | 5mo | $350,000 | $189 | 53 |
| 24401 Christian Dr | 0.15mi | 3/3.5 (-1) | 1,726 (-14%) | 7mo | $331,000 | $192 | 52 |
| 24840 Cabot Dr | 0.60mi | 4/1.5 | 2,234 (+11%) | 4mo | $290,000 | $130 | 48 |
| 24435 Heritage Dr | 0.75mi | 3/2.5 (-1) | 2,296 (+14%) | 0mo | $280,000 | $122 | 34 |
| 24465 Manchester Dr | 0.70mi | 4/2.0 | 2,304 (+15%) | 12mo | $77,700 | $34 | 32 |
Match score weights: distance 35% · size 25% · config 20% · recency 20%. Top-matched comps best support the ARV.
Projected returns pro-forma
-3.0% appreciation · 3.0% rent growth · sell at horizon
- IRR
- -15.4%
- Equity multiple
- 0.45×
- Total profit
- $-40,767
- Equity at exit
- $39,512
- IRR
- -6.9%
- Equity multiple
- 0.56×
- Total profit
- $-32,730
- Equity at exit
- $22,912
Cash invested: $74,200 (down + closing). Projections, not guarantees.
Landlord ↔ Tenant lean methodology
- Overall (STATE)
- 62 Landlord-Friendly
- State Michigan
- 62 Landlord-Friendly · EVEN
- County
- — inherits STATE
- City
- — inherits STATE
ZIP-level market 48183
- Active inventory
- 171
- Price-to-rent
- 9.7×
Monthly cashflow live
- Estimated rent
- $2,269 medium interval (Pro) →
- Mortgage (P&I)
- −$1,390
- Tax from tax record
- −$258 /mo · $3,095/yr
- Insurance
- −$110
- HOA
- −$0
- Vacancy / Maint / Mgmt
- −$476
- Net cashflow
- $34
Break-even live
UW: 25.0% down · 7.5% · 30yr · 1.5% tax · 5.0% vac · 8.0% maint · 8.0% mgmt
Financing live
Cash to close
- Down payment
- $66,250
- Closing costs
- $7,950
- Reserves months
- —
- Total cash needed
- —
Loan-product check · same deal, 3 products live
Conventional
25% down · 7.5% · 30yr
- Down + closing
- —
- Monthly P&I
- —
- Monthly cashflow
- —
- DSCR
- —
- Eligible?
- —
Personal DTI + credit; lowest rate.
DSCR
20% down · 8.5% · 30yr
- Down + closing
- —
- Monthly P&I
- —
- Monthly cashflow
- —
- DSCR
- —
- Eligible?
- —
No personal income docs; deal must DSCR.
Hard money
10% down · 12.0% · 12mo
- Down + closing
- —
- Monthly P&I
- —
- Monthly cashflow
- —
- DSCR
- —
- Eligible?
- —
Short-term bridge; refi at stabilization.
Rent comps 2 comps
| Address | Beds | Baths | Sqft | Rent | $/sqft | DOM | Units | Dist |
|---|---|---|---|---|---|---|---|---|
| 23501 Van Horn Rd Woodhaven, MI | 4.0 | 2.0 | 1568 | $1,599 | $1.02 | 1d | 1 | 0.40mi |
| 23840 Brentwood Dr Trenton, MI | 4.0 | 3.5 | 2706 | $3,450 | $1.27 | 43d | 1 | 0.43mi |
Listing history 38 events
-
2026-05-04status Pending 440-char remark
Show marketing remark (440 chars)
THIS IS A HUD HOME. BEING SOLD AS IS. THIS IS AN EXCLUSIVE LISTING. OWNER OCCUPANT BIDS ONLY FOR THE FIRST 15 DAYS ON MARKET. SOLID BI-LEVEL HOME WITH UPDATES THROUGHOUT. READY TO MOVE IN. HARDWOOD FLOORS THROUGHOUT. UPDATED BATHS WITH CERAMIC TILE. UPDATED KITCHEN. ATTACHED 2 CAR GARAGE. HUGE BACKYARD DECK. WOODHAVEN SCHOOL SYSTEM. BUYER TO ORDER FINAL WATER READING PRIOR TO CLOSING. BUYER TO ORDER FINAL WATER READING PRIOR TO CLOSING.
-
2026-04-30price $265,000 440-char remark
Show marketing remark (440 chars)
THIS IS A HUD HOME. BEING SOLD AS IS. THIS IS AN EXCLUSIVE LISTING. OWNER OCCUPANT BIDS ONLY FOR THE FIRST 15 DAYS ON MARKET. SOLID BI-LEVEL HOME WITH UPDATES THROUGHOUT. READY TO MOVE IN. HARDWOOD FLOORS THROUGHOUT. UPDATED BATHS WITH CERAMIC TILE. UPDATED KITCHEN. ATTACHED 2 CAR GARAGE. HUGE BACKYARD DECK. WOODHAVEN SCHOOL SYSTEM. BUYER TO ORDER FINAL WATER READING PRIOR TO CLOSING. BUYER TO ORDER FINAL WATER READING PRIOR TO CLOSING.
-
2026-03-25$294,000 Active 440-char remark
Show marketing remark (440 chars)
THIS IS A HUD HOME. BEING SOLD AS IS. THIS IS AN EXCLUSIVE LISTING. OWNER OCCUPANT BIDS ONLY FOR THE FIRST 15 DAYS ON MARKET. SOLID BI-LEVEL HOME WITH UPDATES THROUGHOUT. READY TO MOVE IN. HARDWOOD FLOORS THROUGHOUT. UPDATED BATHS WITH CERAMIC TILE. UPDATED KITCHEN. ATTACHED 2 CAR GARAGE. HUGE BACKYARD DECK. WOODHAVEN SCHOOL SYSTEM. BUYER TO ORDER FINAL WATER READING PRIOR TO CLOSING. BUYER TO ORDER FINAL WATER READING PRIOR TO CLOSING.
-
2022-11-10soldstatus $270,000
-
2022-11-04soldstatus $270,000 Sold
-
2022-11-04soldstatus $270,000 Closed
-
2022-09-26status Pending
-
2022-09-26status Pending
-
2022-08-25$294,900 Active
-
2022-08-25$294,900 Active
-
2014-01-08soldstatus $72,000
-
2014-01-08soldstatus $72,000
-
2013-11-11$79,900
-
2013-11-11$79,900
-
2004-05-14soldstatus $165,000
-
2004-03-09soldstatus $165,000
-
2004-03-09soldstatus $165,000
-
2004-02-07historical
-
2003-11-20$167,900
-
2003-11-20$167,900
-
2001-11-27soldstatus $156,500
-
2001-03-28soldstatus $156,500
-
2001-03-26soldstatus $156,500
-
2001-03-26soldstatus $156,500
-
2001-03-23historical
-
2001-03-23historical
-
2000-12-20$158,610
-
2000-12-20$158,610
-
2000-12-20$158,610
-
2000-09-23$164,900
-
2000-09-23$164,900
-
1998-10-05soldstatus $139,900
-
1998-10-05soldstatus $139,900
-
1998-05-12$136,900
-
1998-05-12$136,900
ⓘ Source: listings_history table (triggers on properties + properties_extension) + one-shot
backfill from property_details.listing_events for pre-trigger history.
Tax reassessment forecast MI · Partial reset (capped growth)
- Current annual tax
- $3,095 · $258/mo
- Projected year-2 tax
- $3,588 · $299/mo
- Expected delta
- +$493/yr (+$41/mo · 15.9%)
ⓘ Screening estimate from a state-policy table — verify with the county assessor before closing.
Climate risk First Street
- Flood 1/10 Low FEMA zone X (shaded) · 0% chance over 30 yrs
- Wildfire 1/10 Low
- Heat 3/10 Moderate 7 d/yr ≥98°F today · 15 d/yr by 30 yrs out
- Wind 2/10 Low
- Air quality 3/10 Moderate 2 unhealthy d/yr today · 5 by 30 yrs out
Nearby sold comps map
Loading sold comps map…
Walkable amenities ~0.75 mi
Loading nearby amenities…
Taxation est. · year 1
- Rental income
- $27,225
- − Mortgage interest
- −$14,844
- − Property taxes
- −$3,095
- − Insurance
- −$1,325
- − Repairs & maintenance
- −$2,178
- − Management
- −$2,178
- − Depreciation
- −$7,709
- Taxable loss
- −$4,104
- Est. tax savings @ 24.0%
- +$985
- After-tax cash flow
- $1,397/yr
For passive investors: Depreciation is non-cash, so a rental often shows a tax loss while cash-flowing — sheltering income. Rental losses are passive: they offset passive income freely, and up to $25,000/yr can offset ordinary (W-2) income if you actively participate and your MAGI is under $100k (phasing out to $0 by $150k); unused losses carry forward. On sale, claimed depreciation is recaptured at up to 25%, and gains may owe capital-gains tax (a 1031 exchange can defer both). Figures are a year-1 estimate at your 24.0% rate — not tax advice; consult a CPA.
Schools (NCES district)
- District
- Woodhaven-Brownstown School District
- NCES district ID
- 2636485
- Math proficiency
- 32% ▼ -11.00%
- Reading proficiency
- 49% ▼ -7.00%
- Median HH income
- $58,200
- Composite
- 35.63/100
- National rank
- #4885
- State rank
- #189 of 540 in MI
Livability — Woodhaven
- Score
- 83/100
- State rank
- #49
- US rank
- #1017
Category grades
Schools grade is shown separately in the Schools card above.
Census & demographics
- County
- Wayne County · 1,562,939 people
- City population
- 41,765
- Metro
- Detroit-Warren-Dearborn, MI
- Population (ZIP)
- 41,765
- Household income
- $83,508
- Rent vs Own
- Severe rent burden
- 836.0
Population outlook (Wayne County) Hauer SSP2
- Today (2025)
- 1,675,273 people
- By 2030
- 1,620,300 · -3.3%
- By 2040
- 1,502,341 · -10.3%
- By 2050
- 1,384,039 · -17.4%
- By 2075
- 1,124,592 · -32.9%
- By 2100
- 881,193 · -47.4%
Race, ethnicity, and origin ACS 2023
- Neighborhood character
- Predominantly White (82%)
- Race & ethnicity
- White 82% Hispanic / Latino 6% Black 5% Two or more races 5% Asian 2%
- Hispanic origin (detail)
- Mexican 4%
- Common ancestry
- Romanian 15% Lithuanian 4% Slovak 2%
- Foreign-born
- 4% · Canada
- Languages at home
- 94% English-only · Other Indo-European 3% Spanish 2%
Political lean MEDSL · Wayne
- 2024 margin
- Strong D (+29.0) · D 62.7% · R 33.7% · Other 3.6%
- 2008→2024 swing
- -20.5pp toward R · 2008: 49.5pp · 2024: 29.0pp
- All cycles
- 2024: D+29.0 2020: D+38.1 2016: D+37.3 2012: D+46.9 2008: D+49.5
Not yet ingested
- Civics
- —
Market trends
- HPI YoY
- ▼ -222.34%
- Current HPI
- 216.3623
- Rent YoY
- —
- Metro
- Detroit-Warren-Dearborn, MI
- State GDP YoY
- ▲ 1.37%
- F500 in state
- 28
Industry mix (Fortune 500 HQ in MI)
| Industry | F500 HQs | Revenue |
|---|---|---|
| Automotive Parts | 3 | $48B |
|
||
| Automotive | 2 | $372B |
|
||
| Chemicals | 1 | $45B |
|
||
| Automotive Retail | 1 | $29B |
|
||
| Healthcare / Medical Devices | 1 | $23B |
|
||
| Automotive Technology | 1 | $20B |
|
||
Price history
+93.6% since first listed38 events — show timeline
- 2026-05-04 Pending — MiRealSource-MiMLS
- 2026-05-04 Pending — REALCOMP
- 2026-04-30 Price Changed $265,000 MiRealSource-MiMLS
- 2026-04-30 Price Changed $265,000 REALCOMP
- 2026-03-25 Listed $294,000 REALCOMP
- 2026-03-25 Listed $294,000 MiRealSource-MiMLS
- 2022-11-10 Sold (Public Records) $270,000 Public Records
- 2022-11-04 Sold (MLS) $270,000 MiRealSource-MiMLS
- 2022-11-04 Sold (MLS) $270,000 REALCOMP
- 2022-09-26 Pending — MiRealSource-MiMLS
- 2022-09-26 Pending — REALCOMP
- 2022-08-25 Listed $294,900 MiRealSource-MiMLS
- 2022-08-25 Listed $294,900 REALCOMP
- 2014-01-08 Sold (MLS) $72,000 MiRealSource-MiMLS
- 2014-01-08 Sold (MLS) $72,000 REALCOMP
- 2013-11-11 Listed $79,900 MiRealSource-MiMLS
- 2013-11-11 Listed $79,900 REALCOMP
- 2004-05-14 Sold (Public Records) $165,000 Public Records
- 2004-03-09 Sold (MLS) $165,000 REALCOMP
- 2004-03-09 Sold (MLS) $165,000 MiRealSource-MiMLS
- 2004-02-07 Listing Removed — MiRealSource-MiMLS
- 2003-11-20 Listed $167,900 REALCOMP
- 2003-11-20 Listed $167,900 MiRealSource-MiMLS
- 2001-11-27 Sold (Public Records) $156,500 Public Records
- 2001-03-28 Sold (MLS) $156,500 REALCOMP
- 2001-03-26 Sold (MLS) $156,500 MiRealSource-MiMLS
- 2001-03-26 Sold (MLS) $156,500 REALCOMP
- 2001-03-23 Listing Removed — REALCOMP
- 2001-03-23 Listing Removed — MiRealSource-MiMLS
- 2000-12-20 Listed $158,610 MiRealSource-MiMLS
- 2000-12-20 Listed $158,610 REALCOMP
- 2000-12-20 Listed $158,610 REALCOMP
- 2000-09-23 Listed $164,900 REALCOMP
- 2000-09-23 Listed $164,900 MiRealSource-MiMLS
- 1998-10-05 Sold (MLS) $139,900 MiRealSource-MiMLS
- 1998-10-05 Sold (MLS) $139,900 REALCOMP
- 1998-05-12 Listed $136,900 MiRealSource-MiMLS
- 1998-05-12 Listed $136,900 REALCOMP
Property tax history
+1.0%/yrLatest (2025): $3,095 · -48.5% YoY. Source: county tax records.
Cash-flow waterfall
monthlySold comps — $/sqft
last 12 mo · ≤1 miLoading sold comps…