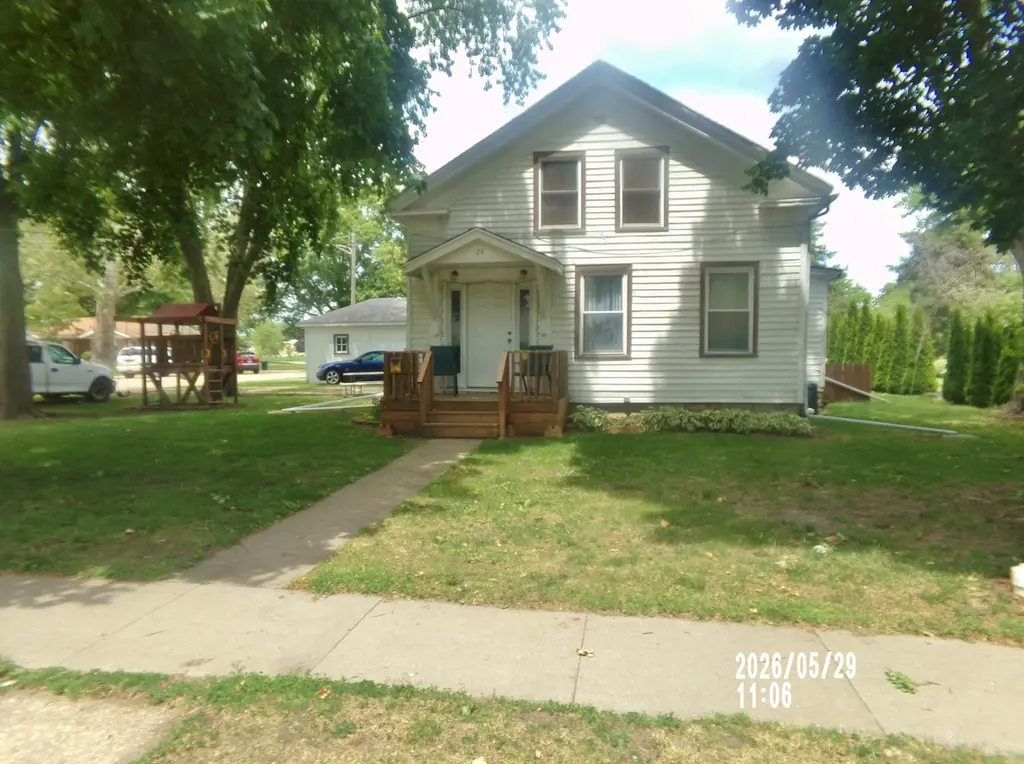
24 W Division St · Amboy, IL
Flood risk 6/10 · Moderate
- FEMA flood zone
- X (unshaded)
- Chance of flooding over 30 yrs
- 0.72%
- Est. flood insurance / yr
- $473 – $860
Fire risk 1/10 · Minimal
- Est. fire insurance / yr
- $804 – $1,492
Heat risk 2/10 · Minimal
- Hot days now (above 102°F)
- 7 days/yr
- Hot days in 30 yrs
- 16 days/yr
Wind risk 2/10 · Minimal
- Chance of severe wind over 30 yrs
- 1.0%
Air-quality risk 2/10 · Minimal
- Unhealthy air days now
- 1 days/yr
- Unhealthy air days in 30 yrs
- 2 days/yr
Risk factors via First Street. Map © Google.
Why this score? — see what drove the B grade
The composite is a weighted blend of 9 inputs, each scored 0–100. Each bar is that input's sub-score; the figure is the points it added to the 100-point composite (weight × sub-score).
- Cash flow +30.0/30.0
- ARV discount +15.0/15.0
- DSCR +10.0/10.0
- 1% rule +9.3/10.0
- Livability +3.6/5.0
- Rent growth +2.5/5.0
- Condition / age +2.5/5.0
- Schools +2.1/10.0
- Appreciation +0.0/10.0
$77,000
🖨 Deal sheet 📄 Offer letter ✓ Due diligence
Listing remarks
Welcome home to this beautifully maintained property that offers the perfect blend of comfort and Spacious living. , Conveniently located near schools, shopping and dining. The large fenced backyard is ideal for relaxing or entertaining. 6-year-old central Air, Patio enclosed screened porch, 1st floor laundry, large detached 2 car garage, call for an appointment.
Key facts
- 1st floor laundry
- Fenced backyard
- Central air
Tags
Property features AI
Finance
- Other: Possession at closing; Earnest money is held
- HOA & community: No master association fee required
Exterior
- Parking: Detached owned garage; Two garage spaces; Six total parking spaces
- Utilities: Public water; Public sewer
- Home design: Detached single-family home; 1.5-story design; Fee simple ownership; Property over 100 years old; Built before 1978
- Construction: Other construction materials
- Exterior features: Lot dimensions approximately 81 x 115; Lot under 0.25 acre; Street lights in neighborhood
Interior
- Kitchen: Kitchen on main level (14 x 14)
- Bedrooms: Three bedrooms (master bedroom on second level; two additional bedrooms on second level — 11 x 10 and 14 x 10)
- Bathrooms: One full bathroom
- Heating & cooling: Natural gas forced-air heating; Central air conditioning
- Interior features: Six total rooms; Full unfinished basement
- Laundry & utility: Laundry area in kitchen with electric dryer hookup
Neighborhood map
What this means for you Summary
Snapshot
- This is a 3-bed/1.5-bath single-family listed at $77k.
Deal economics
- At list price, monthly cash flow is $306 ($4k/yr) — positive.
- The deal already cash-flows at list — no discount required.
- Meets the 1% rule at list price ($1k rent vs $77k).
Location & tenants
- Location reads 71/100 on livability (#347 in IL) — a middle-class / working-renter tenant base. Strengths: crime A+, cost of living A+, housing A+; Watch: health & safety C-, schools F, amenities F.
- Amboy CUSD 272 (rural): math 22% / reading 26% proficiency, ranked #354 of 620 in IL (top 57%) — low school quality limits family demand, transient renter base, plan for 1-2y turnover.
- Market conditions: 13 active listings in the ZIP; 43 units permitted in Lee County in 2024 (0 in 5+ unit buildings).
Forward outlook
- Local home prices are declining (-3.0%/yr); year-one equity from $532 of loan paydown is wiped out by about $2k of value loss. Plan a longer hold.
- Lee County population projected at -23% by 2050 — secular population decline; favor cash flow + early exit over multi-decade hold.
- At projected returns (-3.0% appreciation + 3.0% rent growth), your $22k cash investment doubles in ~8 years — after that, you're playing with house money.
Negotiation context
- Only 1 days on market — expect competitive offers; lowballing is unlikely to land.
- 2 sale attempts since 7y ago with the ask held roughly flat each time — persistent listings suggest the price (not the market) is what's stuck; bring a comps-based counter.
Risks & watch-outs
- Watch-outs: built in 1886 — expect roof / HVAC / electrical / plumbing capex.
- Climate carrying-cost: major flood risk — expect insurance premiums to compound above CPI over the hold.
Questions for the listing agent
- Built in 1886 — when were the roof, HVAC, electrical panel, plumbing, and water heater last replaced?
- Is there a deadline driving the sale (1031 exchange, divorce, estate, relocation)? That informs how much negotiation room exists.
- Schools are F-rated, which usually means shorter tenancies and higher turnover. Who's the typical renter profile here, and what's been the actual vacancy rate?
- What's the average days-on-market for RENTAL listings here right now (not sales)? A rising rental-DOM trend means longer vacancies and softer asking-rent achievability than the comps imply.
- What's the recent tenant-quality profile in this submarket — average credit score on applications, eviction rate, late-payment / NSF rate, and stable-employment percentage? A property-management company in the area should have these aggregated.
- How much new for-sale + rental construction is in the pipeline within 1–3 miles? Heavy new supply typically softens prices + rents 12–24 months out; constrained supply supports both.
Investment metrics
- 1% rule
- 1.43% ✓
- Cap rate
- 11.06%
- Cash-on-cash
- 17.02%
- DSCR
- 1.76
- GRM
- 5.8
CMA / ARV
- ARV (on-the-fly)
- $93,555
- Comps found
- 9
Show comp detail 9 sales within ~0.75 mi
| Address | Dist | Beds/Ba | Sqft | Sold | Price | $/sf | Match |
|---|---|---|---|---|---|---|---|
| 219 W Provost St | 0.25mi | 3/1.0 | 1,144 (-1%) | 5mo | $140,000 | $122 | 81 |
| 302 W Division St | 0.31mi | 2/1.0 (-1) | 1,176 (+2%) | 1mo | $94,900 | $81 | 75 |
| 123 W Main St | 0.28mi | 3/2.0 | 1,148 (-1%) | 21mo | $158,000 | $138 | 66 |
| 314 W Division St | 0.33mi | 2/1.0 (-1) | 1,104 (-4%) | 7mo | $18,500 | $17 | 64 |
| 15 W Main St | 0.21mi | 2/1.5 (-1) | 1,304 (+13%) | 17mo | $92,000 | $71 | 50 |
| 330 S Washington Ave | 0.38mi | 2/1.0 (-1) | 1,223 (+6%) | 20mo | $51,000 | $42 | 49 |
| 390 N East Ave N | 0.46mi | 2/1.0 (-1) | 1,261 (+9%) | 10mo | $22,500 | $18 | 48 |
| 515 E Main St | 0.52mi | 2/1.0 (-1) | 1,061 (-8%) | 11mo | $134,000 | $126 | 46 |
| 302 N East Ave | 0.37mi | 2/1.0 (-1) | 1,040 (-10%) | 22mo | $125,000 | $120 | 41 |
Match score weights: distance 35% · size 25% · config 20% · recency 20%. Top-matched comps best support the ARV.
Projected returns pro-forma
-3.0% appreciation · 3.0% rent growth · sell at horizon
- IRR
- 8.3%
- Equity multiple
- 1.33×
- Total profit
- $7,037
- Equity at exit
- $11,481
- IRR
- 17.6%
- Equity multiple
- 2.45×
- Total profit
- $31,355
- Equity at exit
- $6,658
Cash invested: $21,560 (down + closing). Projections, not guarantees.
Landlord ↔ Tenant lean methodology
- Overall (STATE)
- 43 Moderately Tenant-Leaning
- State Illinois
- 43 Moderately Tenant-Leaning · D+7
- County
- — inherits STATE
- City
- — inherits STATE
ZIP-level market 61310
- Home prices YoY
- -32.8%
- Active inventory
- 13
- Price-to-rent
- 5.8×
Monthly cashflow live
- Estimated rent
- $1,100 medium interval (Pro) →
- Mortgage (P&I)
- −$404
- Tax from tax record
- −$127 /mo · $1,526/yr
- Insurance
- −$32
- HOA
- −$0
- Vacancy / Maint / Mgmt
- −$231
- Net cashflow
- $306
Break-even live
UW: 25.0% down · 7.5% · 30yr · 1.5% tax · 5.0% vac · 8.0% maint · 8.0% mgmt
Financing live
Cash to close
- Down payment
- $19,250
- Closing costs
- $2,310
- Reserves months
- —
- Total cash needed
- —
Loan-product check · same deal, 3 products live
Conventional
25% down · 7.5% · 30yr
- Down + closing
- —
- Monthly P&I
- —
- Monthly cashflow
- —
- DSCR
- —
- Eligible?
- —
Personal DTI + credit; lowest rate.
DSCR
20% down · 8.5% · 30yr
- Down + closing
- —
- Monthly P&I
- —
- Monthly cashflow
- —
- DSCR
- —
- Eligible?
- —
No personal income docs; deal must DSCR.
Hard money
10% down · 12.0% · 12mo
- Down + closing
- —
- Monthly P&I
- —
- Monthly cashflow
- —
- DSCR
- —
- Eligible?
- —
Short-term bridge; refi at stabilization.
Listing history 7 events
-
2026-05-31status $77,000 Pending 1 DOM
-
2026-05-29$77,000 Active
-
2019-12-31historical
-
2019-10-31price
-
2019-10-09price
-
2019-09-26price
-
2019-09-14New
ⓘ Source: listings_history table (triggers on properties + properties_extension) + one-shot
backfill from property_details.listing_events for pre-trigger history.
Tax reassessment forecast IL · Partial reset (capped growth)
- Current annual tax
- $1,526 · $127/mo
- Projected year-2 tax
- $1,637 · $136/mo
- Expected delta
- +$111/yr (+$9/mo · 7.3%)
ⓘ Screening estimate from a state-policy table — verify with the county assessor before closing.
Climate risk First Street
- Flood 6/10 Major FEMA zone X (unshaded) · 72% chance over 30 yrs
- Wildfire 1/10 Low
- Heat 2/10 Low 7 d/yr ≥102°F today · 16 d/yr by 30 yrs out
- Wind 2/10 Low 100% chance of damaging wind over 30 yrs
- Air quality 2/10 Low 1 unhealthy d/yr today · 2 by 30 yrs out
Nearby sold comps map
Loading sold comps map…
Walkable amenities ~0.75 mi
Loading nearby amenities…
Taxation est. · year 1
- Rental income
- $13,198
- − Mortgage interest
- −$4,313
- − Property taxes
- −$1,526
- − Insurance
- −$385
- − Repairs & maintenance
- −$1,056
- − Management
- −$1,056
- − Depreciation
- −$2,240
- Taxable income
- $2,622
- Est. tax owed @ 24.0%
- −$629
- After-tax cash flow
- $3,041/yr
For passive investors: Depreciation is non-cash, so a rental often shows a tax loss while cash-flowing — sheltering income. Rental losses are passive: they offset passive income freely, and up to $25,000/yr can offset ordinary (W-2) income if you actively participate and your MAGI is under $100k (phasing out to $0 by $150k); unused losses carry forward. On sale, claimed depreciation is recaptured at up to 25%, and gains may owe capital-gains tax (a 1031 exchange can defer both). Figures are a year-1 estimate at your 24.0% rate — not tax advice; consult a CPA.
Schools (NCES district)
- District
- Amboy CUSD 272
- NCES district ID
- 1703690
- Math proficiency
- 22% ▲ 3.00%
- Reading proficiency
- 26% ▼ -7.00%
- Median HH income
- $47,769
- Composite
- 21.01/100
- National rank
- #8454
- State rank
- #354 of 620 in IL
Livability — Amboy
- Score
- 71/100
- State rank
- #347
- US rank
- #7034
Category grades
Schools grade is shown separately in the Schools card above.
Census & demographics
- Census place
- Amboy, IL
- Population (ZIP)
- 3,532
Population outlook (Lee County) Hauer SSP2
- Today (2025)
- 31,636 people
- By 2030
- 30,091 · -4.9%
- By 2040
- 27,007 · -14.6%
- By 2050
- 24,264 · -23.3%
- By 2075
- 19,373 · -38.8%
- By 2100
- 14,639 · -53.7%
Race, ethnicity, and origin ACS 2023
- Neighborhood character
- Predominantly White (95%)
- Race & ethnicity
- White 95% Two or more races 3% Hispanic / Latino 2%
- Common ancestry
- Iranian 7% Romanian 3% Slovak 2%
- Foreign-born
- 1%
- Languages at home
- 98% English-only · Spanish 1%
Political lean MEDSL · Lee
- 2024 margin
- Strong R (+22.2) · D 37.9% · R 60.2% · Other 1.9%
- 2008→2024 swing
- -19.2pp toward R · 2008: -3.0pp · 2024: -22.2pp
- All cycles
- 2024: R+22.2 2020: R+19.6 2016: R+20.4 2012: R+7.3 2008: R+3.0
Not yet ingested
- Civics
- —
Market trends
- HPI YoY
- ▼ -66.91%
- Current HPI
- 137.3206
- Rent YoY
- —
- Metro
- —
- State GDP YoY
- ▲ 1.59%
- F500 in state
- 60
Industry mix (Fortune 500 HQ in IL)
| Industry | F500 HQs | Revenue |
|---|---|---|
| Insurance | 4 | $201B |
|
||
| Consumer Goods | 4 | $87B |
|
||
| Industrial Machinery | 3 | $64B |
|
||
| Healthcare | 2 | $55B |
|
||
| Retail / Pharmacy | 1 | $148B |
|
||
| Agriculture / Food | 1 | $86B |
|
||
Price history
6 events — show timeline
- 2026-05-29 Listed $77,000 MRED as Distributed by MLS Grid
- 2019-12-31 Listing Removed — MRED as Distributed by MLS Grid
- 2019-10-31 Price Changed — MRED as Distributed by MLS Grid
- 2019-10-09 Price Changed — MRED as Distributed by MLS Grid
- 2019-09-26 Price Changed — MRED as Distributed by MLS Grid
- 2019-09-14 Listed — MRED as Distributed by MLS Grid
Property tax history
+3.6%/yrLatest (2024): $1,526 · +15.1% YoY. Source: county tax records.
Cash-flow waterfall
monthlySold comps — $/sqft
last 12 mo · ≤1 miLoading sold comps…