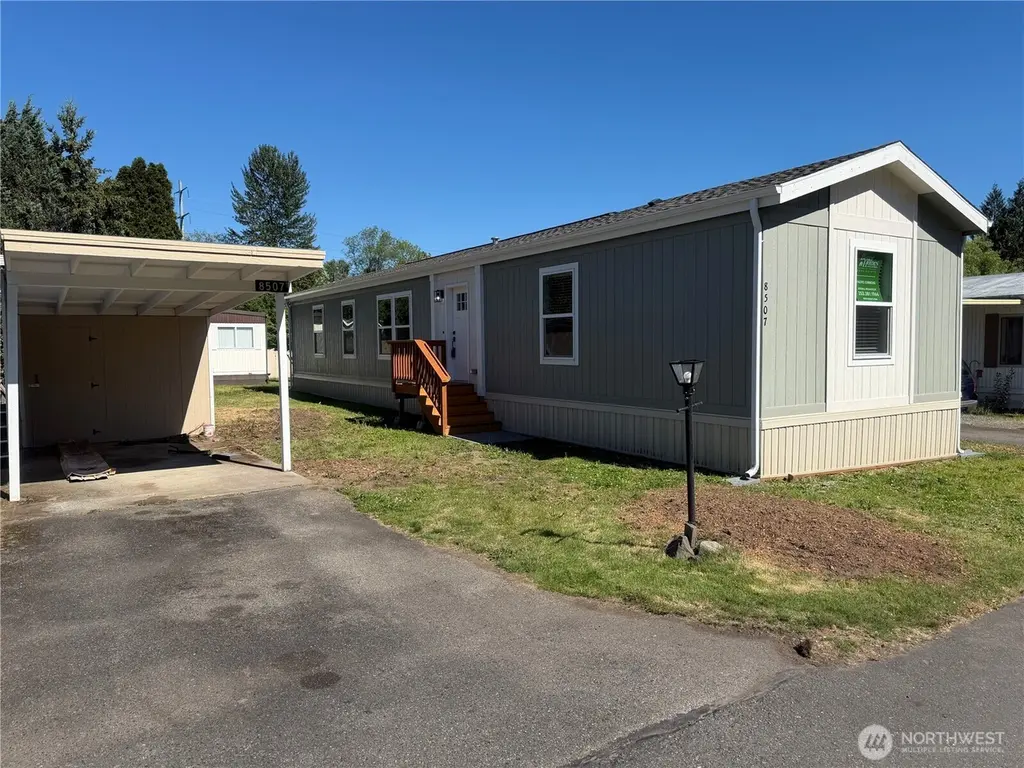
8507 143rd Avenue Ct E #30 · Alderton, WA
Flood risk 6/10 · Moderate
- FEMA flood zone
- X (unshaded)
- Chance of flooding over 30 yrs
- 0.75%
- Est. flood insurance / yr
- $507 – $1,088
Fire risk 3/10 · Minor
- Est. fire insurance / yr
- $604 – $1,122
Heat risk 3/10 · Minor
- Hot days now (above 88°F)
- 7 days/yr
- Hot days in 30 yrs
- 16 days/yr
Wind risk 1/10 · Minimal
- Chance of severe wind over 30 yrs
- —
Air-quality risk 7/10 · Major
- Unhealthy air days now
- 9 days/yr
- Unhealthy air days in 30 yrs
- 11 days/yr
Risk factors via First Street. Map © Google.
Why this score? — see what drove the B grade
The composite is a weighted blend of 9 inputs, each scored 0–100. Each bar is that input's sub-score; the figure is the points it added to the 100-point composite (weight × sub-score).
- Cash flow +30.0/30.0
- 1% rule +10.0/10.0
- DSCR +10.0/10.0
- ARV discount +7.5/15.0
- Schools +6.2/10.0
- Condition / age +4.0/5.0
- Rent growth +3.6/5.0
- Livability +3.4/5.0
- Appreciation +0.0/10.0
$139,900
🖨 Deal sheet 📄 Offer letter ✓ Due diligence
Listing remarks
Move into this quiet quaint community where pride of ownership shows. The community is an 80/20 community meaning 80% of the residents are 55+ and 20% can be under 55. This BRAND NEW home features 3 bedrooms, 2 baths, kitchen with eating area, pantry and island, living room with lots of light, primary bedroom with its own bath, walk in closet and walk in shower. Private yard with a carport too. Landscaping coming soon. Great location close to all amenities and freeways. Price includes seller paid sales tax, three months free rent and a one year warranty in addition to the manufacturer's warranties! Welcome home!
Key facts
- Great location
- Carport
- Private yard
Tags
Property features AI
Finance
- Other: High-speed internet available in park
- Financial info: Accepts Cash and Conventional financing
- HOA & community: Located in Lone Cedar park; Park approved for sale; Approximately 50 homes in the park; Senior community; Land lease: $1,150
Exterior
- Parking: Carport
- Utilities: Electric energy source; Electric water heater; Public water (metered by park); Septic sewer; PSE power; Xfinity cable; Xfinity internet
- Home design: Manufactured single-wide home; Manufactured after 06/15/1976; One level; Manufactured house (Clayton model 55TMP16663AH24); Very good condition; Mobile home remains in place
- Construction: Wood construction
- Exterior features: Wood exterior products; Composition (asphalt) roof; Tie-down foundation; Dead-end street; Paved access; Has view
Interior
- Kitchen: Dishwasher; Refrigerator; Stove/Range
- Bedrooms: 3 bedrooms
- Flooring: Vinyl flooring
- Bathrooms: 1 full bath; 1 three-quarter bath; 1 bathtub; 2 showers
- Heating & cooling: Forced air heating; No central cooling
- Interior features: Water heater; Entry; Dining room; Living room; Kitchen with eating space; Utility room; Walk-in closet; Drapes; Awnings; Patio/porch/deck; Landscaped
- Laundry & utility: Utility room (laundry/utility space)
Neighborhood map
What this means for you Summary
Snapshot
- This is a 3-bed/2.0-bath manufactured listed at $140k. Condition is rated good.
Deal economics
- At list price, monthly cash flow is $911 ($11k/yr) — positive.
- The deal already cash-flows at list — no discount required.
- Meets the 1% rule at list price ($2k rent vs $140k).
- Cap rate 14.1% vs local median 2.5% in Alderton — top-decile yield for the area; either an underpriced asset or a hidden risk that comps aren't pricing in. Stress-test before assuming the spread holds.
Location & tenants
- Location reads 68/100 on livability (#269 in WA) — a middle-class / working-renter tenant base. Strengths: crime A+, employment A+, housing A+; Watch: schools F, amenities F, commute F.
- Sumner School District (suburban): math 64% / reading 73% proficiency, ranked #18 of 291 in WA (top 6%) — acceptable for families but not a draw, mixed tenant base, ~2y average lease.
- Market conditions: Rents rising fast (+4.5%/yr); 167 active listings in the ZIP; 4 comparable units currently listed for rent nearby; rentals leasing fast (median 2d on market — plan ~1-2 weeks tenant-placement turnaround); solid renter incomes; 3,209 units permitted in Pierce County in 2024 (1,269 in 5+ unit buildings).
Forward outlook
- Local home prices are declining (-3.0%/yr); year-one equity from $967 of loan paydown is wiped out by about $4k of value loss. Plan a longer hold.
- Pierce County population projected at +26% by 2050 — long-run rental-demand tailwind backs the buy-and-hold thesis.
- At projected returns (-3.0% appreciation + 4.5% rent growth), your $39k cash investment doubles in ~5 years — after that, you're playing with house money.
Negotiation context
- Only 6 days on market — expect competitive offers; lowballing is unlikely to land.
Risks & watch-outs
- Climate carrying-cost: major flood risk — expect insurance premiums to compound above CPI over the hold.
Questions for the listing agent
- Is there a deadline driving the sale (1031 exchange, divorce, estate, relocation)? That informs how much negotiation room exists.
- Schools are F-rated, which usually means shorter tenancies and higher turnover. Who's the typical renter profile here, and what's been the actual vacancy rate?
- What's the average days-on-market for RENTAL listings here right now (not sales)? A rising rental-DOM trend means longer vacancies and softer asking-rent achievability than the comps imply.
- What's the recent tenant-quality profile in this submarket — average credit score on applications, eviction rate, late-payment / NSF rate, and stable-employment percentage? A property-management company in the area should have these aggregated.
- How much new for-sale + rental construction is in the pipeline within 1–3 miles? Heavy new supply typically softens prices + rents 12–24 months out; constrained supply supports both.
Investment metrics
- 1% rule
- 1.70% ✓
- Cap rate
- 14.11%
- Cash-on-cash
- 27.90%
- DSCR
- 2.24
- GRM
- 4.9
CMA / ARV
- ARV (on-the-fly)
- $71,400
- Comps found
- 4
Show comp detail 4 sales within ~0.75 mi
| Address | Dist | Beds/Ba | Sqft | Sold | Price | $/sf | Match |
|---|---|---|---|---|---|---|---|
| 8410 143rd Avenue Ct E | 0.05mi | 2/1.0 (-1) | 924 (-9%) | 1mo | $65,000 | $70 | 72 |
| 8510 143rd Avenue Ct E #23 | 0.04mi | 3/1.0 | 924 (-9%) | 8mo | $23,000 | $25 | 71 |
| 8404 144th Ave E #36 | 0.07mi | 3/2.0 | 924 (-9%) | 22mo | $45,000 | $49 | 63 |
| 8602 143rd Avenue Ct E #11 | 0.02mi | 2/2.0 (-1) | 880 (-14%) | 12mo | $150,000 | $170 | 61 |
Match score weights: distance 35% · size 25% · config 20% · recency 20%. Top-matched comps best support the ARV.
Projected returns pro-forma
-3.0% appreciation · 4.46% rent growth · sell at horizon
- IRR
- 23.7%
- Equity multiple
- 1.99×
- Total profit
- $38,916
- Equity at exit
- $20,860
- IRR
- 32.5%
- Equity multiple
- 4.16×
- Total profit
- $123,702
- Equity at exit
- $12,096
Cash invested: $39,172 (down + closing). Projections, not guarantees.
Landlord ↔ Tenant lean methodology
- Overall (STATE)
- 28 Tenant-Leaning
- State Washington
- 28 Tenant-Leaning · D+8
- County
- — inherits STATE
- City
- — inherits STATE
ZIP-level market 98372
- Rents YoY
- 4.5%
- Active inventory
- 167
- Price-to-rent
- 4.9×
Monthly cashflow live
- Estimated rent
- $2,377 medium interval (Pro) →
- Mortgage (P&I)
- −$734
- Tax est. 1.5%
- −$175 /mo · $2,098/yr
- Insurance
- −$58
- HOA
- −$0
- Vacancy / Maint / Mgmt
- −$499
- Net cashflow
- $911
Break-even live
UW: 25.0% down · 7.5% · 30yr · 1.5% tax · 5.0% vac · 8.0% maint · 8.0% mgmt
Financing live
Cash to close
- Down payment
- $34,975
- Closing costs
- $4,197
- Reserves months
- —
- Total cash needed
- —
Loan-product check · same deal, 3 products live
Conventional
25% down · 7.5% · 30yr
- Down + closing
- —
- Monthly P&I
- —
- Monthly cashflow
- —
- DSCR
- —
- Eligible?
- —
Personal DTI + credit; lowest rate.
DSCR
20% down · 8.5% · 30yr
- Down + closing
- —
- Monthly P&I
- —
- Monthly cashflow
- —
- DSCR
- —
- Eligible?
- —
No personal income docs; deal must DSCR.
Hard money
10% down · 12.0% · 12mo
- Down + closing
- —
- Monthly P&I
- —
- Monthly cashflow
- —
- DSCR
- —
- Eligible?
- —
Short-term bridge; refi at stabilization.
Rent comps 4 comps
| Address | Beds | Baths | Sqft | Rent | $/sqft | DOM | Units | Dist |
|---|---|---|---|---|---|---|---|---|
| 7413 142nd Ave E Sumner, WA | 1.0–2.0 | 1.0 | 798 | $1,999 | $2.50 | 1d | 6 | 0.75mi |
| 3002 E Pioneer Puyallup, WA | 2.0–3.0 | 1.5–2.0 | 981 | $2,945 | $3.00 | 1d | 32 | 0.92mi |
| 7105 142nd Ave E Unit A Sumner, WA | 2.0 | 1.0 | 1150 | $1,925 | $1.67 | 24d | 1 | 0.95mi |
| 3107 E Main Ave Puyallup, WA | 1.0–3.0 | 1.0–2.0 | 963 | $2,622 | $2.72 | 1d | 30 | 1.32mi |
Listing history 6 events
-
2026-06-18days on market $139,900 Active 6 DOM
-
2026-06-17days on market $139,900 Active 5 DOM
-
2026-06-16days on market $139,900 Active 4 DOM
-
2026-06-15days on market $139,900 Active 3 DOM
-
2026-06-13remarks 619-char remark
-
2026-06-13$139,900 Active 1 DOM
ⓘ Source: listings_history table (triggers on properties + properties_extension) + one-shot
backfill from property_details.listing_events for pre-trigger history.
Climate risk First Street
- Flood 6/10 Major FEMA zone X (unshaded) · 75% chance over 30 yrs
- Wildfire 3/10 Moderate
- Heat 3/10 Moderate 7 d/yr ≥88°F today · 16 d/yr by 30 yrs out
- Wind 1/10 Low
- Air quality 7/10 Severe 9 unhealthy d/yr today · 11 by 30 yrs out
Nearby sold comps map
Loading sold comps map…
Walkable amenities ~0.75 mi
Loading nearby amenities…
Taxation est. · year 1
- Rental income
- $28,521
- − Mortgage interest
- −$7,837
- − Property taxes
- −$2,098
- − Insurance
- −$700
- − Repairs & maintenance
- −$2,282
- − Management
- −$2,282
- − Depreciation
- −$4,070
- Taxable income
- $9,253
- Est. tax owed @ 24.0%
- −$2,221
- After-tax cash flow
- $8,709/yr
For passive investors: Depreciation is non-cash, so a rental often shows a tax loss while cash-flowing — sheltering income. Rental losses are passive: they offset passive income freely, and up to $25,000/yr can offset ordinary (W-2) income if you actively participate and your MAGI is under $100k (phasing out to $0 by $150k); unused losses carry forward. On sale, claimed depreciation is recaptured at up to 25%, and gains may owe capital-gains tax (a 1031 exchange can defer both). Figures are a year-1 estimate at your 24.0% rate — not tax advice; consult a CPA.
Condition & rehab AI · 12 photos
This move-in-ready mobile home features a modern kitchen, good condition throughout, and is located in a quiet community with amenities close by.
Value-add opportunities
- Both Landscaping — Landscaping will enhance curb appeal and increase both resale and rental value
- Both Painting — Painting interior and exterior walls will freshen up the home and increase its value
- Rental Appliance Maintenance — Regular maintenance of appliances will ensure they continue to function properly and attract renters
Renovation cost estimate screening
Value-add ROI direction
- Both Landscaping — Landscaping will enhance curb appeal and increase both resale and rental value ↑
- Both Painting — Painting interior and exterior walls will freshen up the home and increase its value ↑
- Rental Appliance Maintenance — Regular maintenance of appliances will ensure they continue to function properly and attract renters ↑
ⓘ Cost ranges are severity-bucket heuristics (US national rule-of-thumb). Get contractor quotes + a written scope before underwriting a rehab budget.
Schools (NCES district)
- District
- Sumner School District
- NCES district ID
- 5308610
- Math proficiency
- 64% ▲ 1.00%
- Reading proficiency
- 73% ▬ 0.00%
- Median HH income
- $76,138
- Composite
- 61.86/100
- National rank
- #1497
- State rank
- #18 of 291 in WA
Livability — Alderton
- Score
- 68/100
- State rank
- #269
- US rank
- #9357
Category grades
Schools grade is shown separately in the Schools card above.
Census & demographics
- Census place
- Alderton, WA
- County
- Pierce County · 788,257 people
- Metro
- Seattle-Tacoma-Bellevue, WA
- Population (ZIP)
- 26,012
- Household income
- $98,152
- Rent vs Own
- Severe rent burden
- 871.0
Population outlook (Pierce County) Hauer SSP2
- Today (2025)
- 956,648 people
- By 2030
- 1,010,862 · +5.7%
- By 2040
- 1,113,170 · +16.4%
- By 2050
- 1,206,524 · +26.1%
- By 2075
- 1,436,425 · +50.2%
- By 2100
- 1,563,654 · +63.5%
Race, ethnicity, and origin ACS 2023
- Neighborhood character
- Predominantly White (73%)
- Race & ethnicity
- White 73% Two or more races 10% Hispanic / Latino 8% Asian 6% Black 3% Pacific Islander 1%
- Hispanic origin (detail)
- Mexican 5% Puerto Rican 1%
- Common ancestry
- Lithuanian 4% Romanian 4% Subsaharan African 3%
- Foreign-born
- 13% · Canada, South Korea, China
- Languages at home
- 81% English-only · Russian/Polish/Slavic 5% Spanish 4% Other Asian/Pacific 3%
Political lean MEDSL · Pierce
- 2024 margin
- D (+10.8) · D 53.9% · R 43.1% · Other 3.0%
- 2008→2024 swing
- -1.4pp toward R · 2008: 12.2pp · 2024: 10.8pp
- All cycles
- 2024: D+10.8 2020: D+11.2 2016: D+7.5 2012: D+11.0 2008: D+12.2
Not yet ingested
- Civics
- —
Market trends
- HPI YoY
- ▼ -283.81%
- Current HPI
- 309.7871
- Rent YoY
- ▲ 4.46%
- Metro
- Seattle-Tacoma-Bellevue, WA
- State GDP YoY
- ▲ 4.65%
- F500 in state
- 22
Industry mix (Fortune 500 HQ in WA)
| Industry | F500 HQs | Revenue |
|---|---|---|
| Retail | 2 | $269B |
|
||
| Technology / Retail | 1 | $638B |
|
||
| Technology | 1 | $245B |
|
||
| Telecommunications | 1 | $38B |
|
||
| Food / Beverage | 1 | $36B |
|
||
| Automotive / Trucks | 1 | $34B |
|
||
Price history
1 event — show timeline
- 2026-06-12 Listed $139,900 NWMLS as Distributed by MLS Grid
Cash-flow waterfall
monthlySold comps — $/sqft
last 12 mo · ≤1 miLoading sold comps…