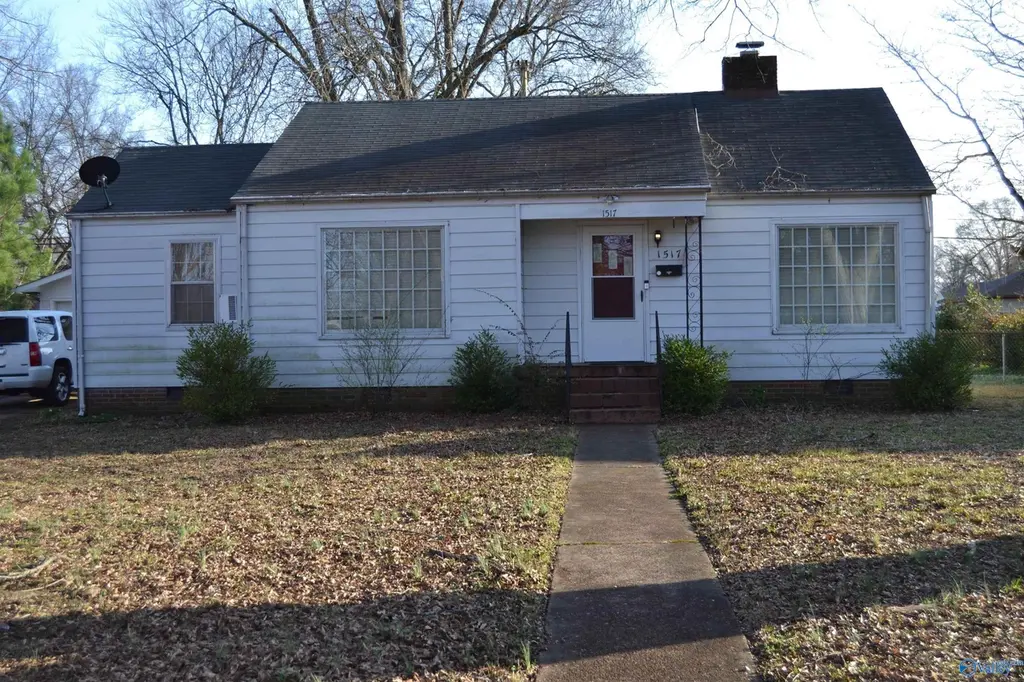
1517 Chestnut St SE · Decatur, AL
Flood risk 4/10 · Minor
- FEMA flood zone
- X (unshaded)
- Chance of flooding over 30 yrs
- 0.2%
- Est. flood insurance / yr
- $507 – $1,088
Fire risk 1/10 · Minimal
- Est. fire insurance / yr
- $916 – $1,700
Heat risk 6/10 · Moderate
- Hot days now (above 106°F)
- 7 days/yr
- Hot days in 30 yrs
- 19 days/yr
Wind risk 4/10 · Minor
- Chance of severe wind over 30 yrs
- 19.0%
Air-quality risk 2/10 · Minimal
- Unhealthy air days now
- 1 days/yr
- Unhealthy air days in 30 yrs
- 1 days/yr
Risk factors via First Street. Map © Google.
Why this score? — see what drove the D grade
The composite is a weighted blend of 9 inputs, each scored 0–100. Each bar is that input's sub-score; the figure is the points it added to the 100-point composite (weight × sub-score).
- Cash flow +14.9/30.0
- ARV discount +7.6/15.0
- DSCR +4.6/10.0
- Rent growth +3.7/5.0
- Livability +3.6/5.0
- 1% rule +3.1/10.0
- Schools +2.6/10.0
- Condition / age +2.5/5.0
- Appreciation +0.0/10.0
$136,900
🖨 Deal sheet (PDF) 📄 Offer letter ✓ Due diligence
Listing remarks MLS
ADORABLE Craftsman/Bungalow with space where it counts! this 2BR/1BA offers a large living room with fireplace and bookshelves each side. Updated bathroom tile surround, and a functional kitchen complete with range and dishwasher. Out back you'll find generous yard plus a detached 2 car garage/workshop-ideal for storage, projects, or extra parking. Whether your a first time buyer, downsizing, or looking for a solid investment this one checks the boxes. Great layout. Great yard. Great potential.
Key facts
- Functional kitchen
- Bookshelves
- Large living room
Tags
Neighborhood map
What this means for you Summary
Snapshot
- This is a 2-bed/1.0-bath single-family listed at $137k.
Deal economics
- At list price, monthly cash flow is $40 ($486/yr) — positive.
- The deal already cash-flows at list — no discount required.
- To meet the 1% rule (rent ≥ 1% of price), the offer needs to be $110k (19.3% below list).
- Recommended offer: $110k (19.3% below list) — sets the bar for 1% rule.
- Cap rate 6.6% vs local median 4.0% in Decatur — top-decile yield for the area; either an underpriced asset or a hidden risk that comps aren't pricing in. Stress-test before assuming the spread holds.
Location & tenants
- Location reads 72/100 on livability (#28 in AL) — a middle-class / working-renter tenant base. Strengths: cost of living A+, housing A+, health & safety A+; Watch: employment D+, crime F, amenities F.
- Decatur City (urban): math 22% / reading 40% proficiency, ranked #66 of 129 in AL (top 51%) — families likely to look elsewhere, expect single-tenant / working-renter base with shorter leases.
- Zoned schools: Oak Park Elementary School (math 8% / reading 32%, grade F, #457 of 627 statewide, top 74%, 503 students, 84% FRL); Decatur Middle School (math 17% / reading 36%, grade F, #150 of 257 statewide, top 60%, 815 students, 77% FRL); Decatur High School (math 27% / reading 27%, grade F, #90 of 305 statewide, top 35%, 1,040 students, 67% FRL) — zoned schools average 76% FRL vs 57% district-wide (19 pts higher); higher-poverty schools than district average — tighter screening recommended.
- Market conditions: Rents rising fast (+4.7%/yr); 225 active listings in the ZIP; 21 comparable units currently listed for rent nearby; rentals lingering (median 46d on market — plan ~5-8 weeks vacancy on turnover, expect pricing pressure); 67% of comp listings sitting > 30 days — soft ceiling on asking rent; 231 units permitted in Morgan County in 2024 (0 in 5+ unit buildings).
Forward outlook
- Local home prices are declining (-3.0%/yr); year-one equity from $946 of loan paydown is wiped out by about $4k of value loss. Plan a longer hold.
- Morgan County population projected at -11% by 2050 — secular population decline; favor cash flow + early exit over multi-decade hold.
Negotiation context
- It's been on market 119 days — a 9% lower offer ($125k) is reasonable based on typical stale-listing flexibility.
Risks & watch-outs
- Watch-outs: built in 1950 — expect roof / HVAC / electrical / plumbing capex.
- Climate carrying-cost: extreme-heat days projected 7→19/yr by 2055 (HVAC capex compounding) — expect insurance premiums to compound above CPI over the hold.
Questions for the listing agent
- It's been on market 119 days. Have you received any prior offers? Is the seller open to a 19% concession, seller financing, or rate buy-down credit?
- Built in 1950 — when were the roof, HVAC, electrical panel, plumbing, and water heater last replaced?
- Why hasn't it sold? Are there any deal-killer items the seller is aware of (foundation, flood, title, zoning, code violations)?
- Is there a deadline driving the sale (1031 exchange, divorce, estate, relocation)? That informs how much negotiation room exists.
- Crime grade is F in this area — have there been break-ins, vandalism, or insurance claims at this property in the last 3 years? What carrier currently insures it and at what premium?
- The area grade is low — what's the realistic commute time and amenity access for the typical tenant pool here? Any planned neighborhood developments (good or bad) we should know about?
- What's the average days-on-market for RENTAL listings here right now (not sales)? A rising rental-DOM trend means longer vacancies and softer asking-rent achievability than the comps imply.
- What's the recent tenant-quality profile in this submarket — average credit score on applications, eviction rate, late-payment / NSF rate, and stable-employment percentage? A property-management company in the area should have these aggregated.
- How much new for-sale + rental construction is in the pipeline within 1–3 miles? Heavy new supply typically softens prices + rents 12–24 months out; constrained supply supports both.
Investment metrics
- 1% rule
- 0.81% ✗
- Cap rate
- 6.65%
- Cash-on-cash
- 1.27%
- DSCR
- 1.06
- GRM
- 10.3
CMA / ARV
- ARV (median comp)
- $137,070
- List price
- $136,900
- Delta
- -0.12%
- Verdict
- FAIR
- Comps
- 20 within 1.0 mi
Show comp detail 12 sales within ~0.75 mi
| Address | Dist | Beds/Ba | Sqft | Sold | Price | $/sf | Match |
|---|---|---|---|---|---|---|---|
| 1605 SE 7th St | 0.30mi | 2/1.0 | 1,113 (+3%) | 5mo | $130,000 | $117 | 77 |
| 1504 Wadsworth St SE | 0.25mi | 3/1.0 (+1) | 1,014 (-6%) | 2mo | $137,500 | $136 | 71 |
| 1804 Enolam Blvd SE | 0.38mi | 3/1.0 (+1) | 1,032 (-4%) | 2mo | $164,900 | $160 | 68 |
| 1209 11th Ave SE | 0.58mi | 3/1.0 (+1) | 1,068 (-1%) | 1mo | $118,500 | $111 | 66 |
| 1628 8th St SE | 0.41mi | 2/1.0 | 1,012 (-6%) | 8mo | $155,000 | $153 | 64 |
| 1024 9th Ave SE | 0.54mi | 2/1.0 | 1,008 (-7%) | 7mo | $164,000 | $163 | 58 |
| 1120 7th Ave SE | 0.71mi | 3/1.0 (+1) | 1,040 (-4%) | 0mo | $120,000 | $115 | 55 |
| 911 9th Ave SE | 0.51mi | 2/1.0 | 964 (-11%) | 7mo | $115,000 | $119 | 52 |
| 1216 Seton Ave | 0.70mi | 3/1.5 (+1) | 1,110 (+3%) | 8mo | $157,000 | $141 | 49 |
| 1002 7th Ave SE | 0.63mi | 3/2.0 (+1) | 1,172 (+8%) | 2mo | $153,000 | $131 | 46 |
| 909 9th St SE | 0.70mi | 2/1.0 | 1,230 (+14%) | 2mo | $182,000 | $148 | 43 |
| 102 Elm Ct NE | 0.62mi | 3/1.0 (+1) | 1,216 (+13%) | 8mo | $102,000 | $84 | 38 |
Match score weights: distance 35% · size 25% · config 20% · recency 20%. Top-matched comps best support the ARV.
Projected returns pro-forma
-3.0% appreciation · 4.67% rent growth · sell at horizon
- IRR
- -12.7%
- Equity multiple
- 0.54×
- Total profit
- $-17,773
- Equity at exit
- $20,412
- IRR
- -1.6%
- Equity multiple
- 0.89×
- Total profit
- $-4,367
- Equity at exit
- $11,837
Cash invested: $38,332 (down + closing). Projections, not guarantees.
Landlord ↔ Tenant lean methodology
- Overall (STATE)
- 90 Strongly Landlord-Friendly
- State Alabama
- 90 Strongly Landlord-Friendly · R+15
- County
- — inherits STATE
- City
- — inherits STATE
ZIP-level market 35601
- Home prices YoY
- -26.5%
- Rents YoY
- 4.7%
- Active inventory
- 225
- Price-to-rent
- 10.3×
Monthly cashflow live
- Estimated rent
- $1,104 high interval (Pro) →
- Mortgage (P&I)
- −$718
- Tax from tax record
- −$57 /mo · $682/yr
- Insurance
- −$57
- HOA
- −$0
- Vacancy / Maint / Mgmt
- −$232
- Net cashflow
- $40
Break-even live
Sensitivity live
| Price | -10% $118 | -5% $79 | +0% $40 | +5% $2 | +10% $-37 |
|---|---|---|---|---|---|
| Rent | -10% $-47 | -5% $-3 | +0% $40 | +5% $84 | +10% $128 |
| Rate | -1.0pp $109 | -0.5pp $75 | base $40 | +0.5pp $5 | +1.0pp $-31 |
UW: 25.0% down · 7.5% · 30yr · 1.5% tax · 5.0% vac · 8.0% maint · 8.0% mgmt
Financing live
Cash to close
- Down payment
- $34,225
- Closing costs
- $4,107
- Reserves months
- —
- Total cash needed
- —
Loan-product check · same deal, 3 products live
Conventional
25% down · 7.5% · 30yr
- Down + closing
- —
- Monthly P&I
- —
- Monthly cashflow
- —
- DSCR
- —
- Eligible?
- —
Personal DTI + credit; lowest rate.
DSCR
20% down · 8.5% · 30yr
- Down + closing
- —
- Monthly P&I
- —
- Monthly cashflow
- —
- DSCR
- —
- Eligible?
- —
No personal income docs; deal must DSCR.
Hard money
10% down · 12.0% · 12mo
- Down + closing
- —
- Monthly P&I
- —
- Monthly cashflow
- —
- DSCR
- —
- Eligible?
- —
Short-term bridge; refi at stabilization.
Rent comps 21 comps
| Address | Beds | Baths | Sqft | Rent | $/sqft | DOM | Units | Dist |
|---|---|---|---|---|---|---|---|---|
| 1821 7th St SE Decatur, AL | 3.0 | 1.0 | 908 | $1,100 | $1.21 | 25d | 1 | 0.38mi |
| 1628 8th St SE Decatur, AL | 2.0 | 1.0 | 1012 | $1,200 | $1.19 | 45d | 1 | 0.40mi |
| 1205 Broadus Ave SE Decatur, AL | 3.0 | 2.0 | 1306 | $1,195 | $0.92 | 45d | 1 | 0.56mi |
| 1018 Grant St SE Unit 1026-4 Decatur, AL | 2.0 | 1.0 | 890 | $800 | $0.90 | 45d | 1 | 0.58mi |
| 1018 Grant St SE Unit 1018-4 Decatur, AL | 2.0 | 1.0 | 890 | $775 | $0.87 | 45d | 1 | 0.60mi |
| 102 Elm Ct NE Decatur, AL | 3.0 | 1.0 | 1216 | $1,450 | $1.19 | 25d | 1 | 0.63mi |
| 818 Grant St SE Decatur, AL | 2.0 | 1.0 | 910 | $1,300 | $1.43 | 45d | 1 | 0.69mi |
| 603 Prospect Dr SE Decatur, AL | 3.0 | 1.0 | 1362 | $1,795 | $1.32 | 45d | 1 | 0.70mi |
| 2136 Eastbrook SE Decatur, AL | 2.0 | 2.0 | 1400 | $1,495 | $1.07 | 45d | 1 | 0.73mi |
| 719 5th Ave SE #1 Decatur, AL | 1.0 | 1.0 | 700 | $850 | $1.21 | 45d | 1 | 0.81mi |
| 1314 Pennylane SE Decatur, AL | 3.0 | 1.5 | 1100 | $1,198 | $1.09 | 25d | 1 | 0.84mi |
| 1221 North St SE Decatur, AL | 2.0 | 1.0 | 937 | $775 | $0.83 | 45d | 2 | 0.98mi |
| 2234 Harrison St SE Decatur, AL | 2.0 | 1.0 | 850 | $925 | $1.09 | 15d | 1 | 1.16mi |
| 516 Ferry St NE Decatur, AL | 2.0 | 1.0 | 900 | $1,150 | $1.28 | 25d | 1 | 1.22mi |
| 227 8th St SW Unit 19 Decatur, AL | 2.0 | 1.0 | 850 | $825 | $0.97 | 45d | 1 | 1.33mi |
| 227 8th St SW Unit 8th 15 Decatur, AL | 1.0 | 1.0 | 800 | $725 | $0.91 | 45d | 1 | 1.33mi |
| 1208 2nd Ave SW Unit 1208 28 Decatur, AL | 2.0 | 1.0 | 850 | $825 | $0.97 | 45d | 1 | 1.33mi |
| 1220 2nd Ave SW Unit 2nd 7 Decatur, AL | 2.0 | 1.0 | 850 | $825 | $0.97 | 45d | 1 | 1.34mi |
| 213 Wilson St NE Unit 2 Decatur, AL | 2.0 | 1.0 | 975 | $875 | $0.90 | 25d | 1 | 1.38mi |
| 213 Wilson St NE Unit 4 Decatur, AL | 2.0 | 1.0 | 975 | $700 | $0.72 | 25d | 1 | 1.38mi |
| 315 Hillside Rd SW Decatur, AL | 3.0 | 1.5 | 1344 | $1,400 | $1.04 | 45d | 1 | 1.45mi |
Listing history 20 events
-
2026-06-22days on market $136,900 Active 119 DOM
-
2026-06-21days on market $136,900 Active 118 DOM
-
2026-06-19days on market $136,900 Active 116 DOM
-
2026-06-18days on market $136,900 Active 115 DOM
-
2026-06-17days on market $136,900 Active 114 DOM
-
2026-06-16days on market $136,900 Active 113 DOM
-
2026-06-15days on market $136,900 Active 112 DOM
-
2026-06-14days on market $136,900 Active 110 DOM
-
2026-06-13days on market $136,900 Active 109 DOM
-
2026-06-10days on market $136,900 Active 107 DOM
-
2026-06-09days on market $136,900 Active 106 DOM
-
2026-06-08days on market $136,900 Active 105 DOM
-
2026-06-07days on market $136,900 Active 104 DOM
-
2026-06-05days on market $136,900 Active 101 DOM
-
2026-06-03days on market $136,900 Active 100 DOM
-
2026-06-02days on market $136,900 Active 99 DOM
-
2026-06-01days on market $136,900 Active 98 DOM
-
2026-05-31days on market $136,900 Active 97 DOM
-
2026-05-30days on market $136,900 Active 96 DOM
-
2026-02-23$136,900 Active 499-char remark
Show marketing remark (499 chars)
ADORABLE Craftsman/Bungalow with space where it counts! this 2BR/1BA offers a large living room with fireplace and bookshelves each side. Updated bathroom tile surround, and a functional kitchen complete with range and dishwasher. Out back you'll find generous yard plus a detached 2 car garage/workshop-ideal for storage, projects, or extra parking. Whether your a first time buyer, downsizing, or looking for a solid investment this one checks the boxes. Great layout. Great yard. Great potential.
ⓘ Source: listings_history table (triggers on properties + properties_extension) + one-shot
backfill from property_details.listing_events for pre-trigger history.
Tax reassessment forecast AL · Resets to sale price
- Current annual tax
- $682 · $57/mo
- Projected year-2 tax
- $682 · $57/mo
- Expected delta
- $0/yr ($0/mo · 0.0%)
ⓘ Screening estimate from a state-policy table — verify with the county assessor before closing.
Climate risk First Street
- Flood 4/10 Moderate FEMA zone X (unshaded) · 20% chance over 30 yrs
- Wildfire 1/10 Low
- Heat 6/10 Major 7 d/yr ≥106°F today · 19 d/yr by 30 yrs out
- Wind 4/10 Moderate 19% chance of damaging wind over 30 yrs
- Air quality 2/10 Low 1 unhealthy d/yr today · 1 by 30 yrs out
Nearby sold comps map
Loading sold comps map…
Walkable amenities ~0.75 mi
Loading nearby amenities…
Taxation est. · year 1
- Rental income
- $13,250
- − Mortgage interest
- −$7,669
- − Property taxes
- −$682
- − Insurance
- −$684
- − Repairs & maintenance
- −$1,060
- − Management
- −$1,060
- − Depreciation
- −$3,983
- Taxable loss
- −$1,888
- Est. tax savings @ 24.0%
- +$453
- After-tax cash flow
- $939/yr
For passive investors: Depreciation is non-cash, so a rental often shows a tax loss while cash-flowing — sheltering income. Rental losses are passive: they offset passive income freely, and up to $25,000/yr can offset ordinary (W-2) income if you actively participate and your MAGI is under $100k (phasing out to $0 by $150k); unused losses carry forward. On sale, claimed depreciation is recaptured at up to 25%, and gains may owe capital-gains tax (a 1031 exchange can defer both). Figures are a year-1 estimate at your 24.0% rate — not tax advice; consult a CPA.
Schools (NCES district)
- District
- Decatur City
- NCES district ID
- 0101170
- Math proficiency
- 22% ▼ -27.00%
- Reading proficiency
- 40% ▼ -1.00%
- Median HH income
- $42,170
- Composite
- 26.21/100
- National rank
- #7261
- State rank
- #66 of 129 in AL
Livability — Decatur
- Score
- 72/100
- State rank
- #28
- US rank
- #5989
Category grades
Schools grade is shown separately in the Schools card above.
Census & demographics
- Census place
- Decatur, AL
- County
- Morgan County · 67,628 people
- City population
- 67,628
- Metro
- Decatur, AL
- Population (ZIP)
- 35,449
- Household income
- $51,429
- Rent vs Own
- Severe rent burden
- 1386.0
Population outlook (Morgan County) Hauer SSP2
- Today (2025)
- 118,775 people
- By 2030
- 116,979 · -1.5%
- By 2040
- 111,800 · -5.9%
- By 2050
- 105,181 · -11.4%
- By 2075
- 87,736 · -26.1%
- By 2100
- 67,624 · -43.1%
Race, ethnicity, and origin ACS 2023
- Neighborhood character
- Diverse neighborhood (Simpson 0.66)
- Race & ethnicity
- White 47% Hispanic / Latino 24% Black 24% Two or more races 10% Native American 2%
- Hispanic origin (detail)
- Mexican 15% Puerto Rican 2%
- Common ancestry
- Slovak 1% Italian 1% Lithuanian 1%
- Foreign-born
- 10% · Canada
- Languages at home
- 81% English-only · Spanish 18%
Political lean MEDSL · Morgan
- 2024 margin
- Solid R (+52.6) · D 23.2% · R 75.8%
- 2008→2024 swing
- -8.8pp toward R · 2008: -43.8pp · 2024: -52.6pp
- All cycles
- 2024: R+52.6 2020: R+49.2 2016: R+52.4 2012: R+44.5 2008: R+43.8
Not yet ingested
- Civics
- —
Market trends
- HPI YoY
- ▼ -89.26%
- Current HPI
- 247.8437
- Rent YoY
- ▲ 4.67%
- Metro
- Decatur, AL
- State GDP YoY
- ▲ 2.94%
- F500 in state
- 4
Industry mix (Fortune 500 HQ in AL)
| Industry | F500 HQs | Revenue |
|---|---|---|
| Financial Services | 1 | $8B |
|
||
| Healthcare | 1 | $5B |
|
||
Price history
1 event — show timeline
- 2026-02-23 Listed $136,900 VMLS
Property tax history
+8.4%/yrLatest (2025): $682 · +0.0% YoY. Source: county tax records.
Cash-flow waterfall
monthlySold comps — $/sqft
last 12 mo · ≤1 miLoading sold comps…