 Duplex
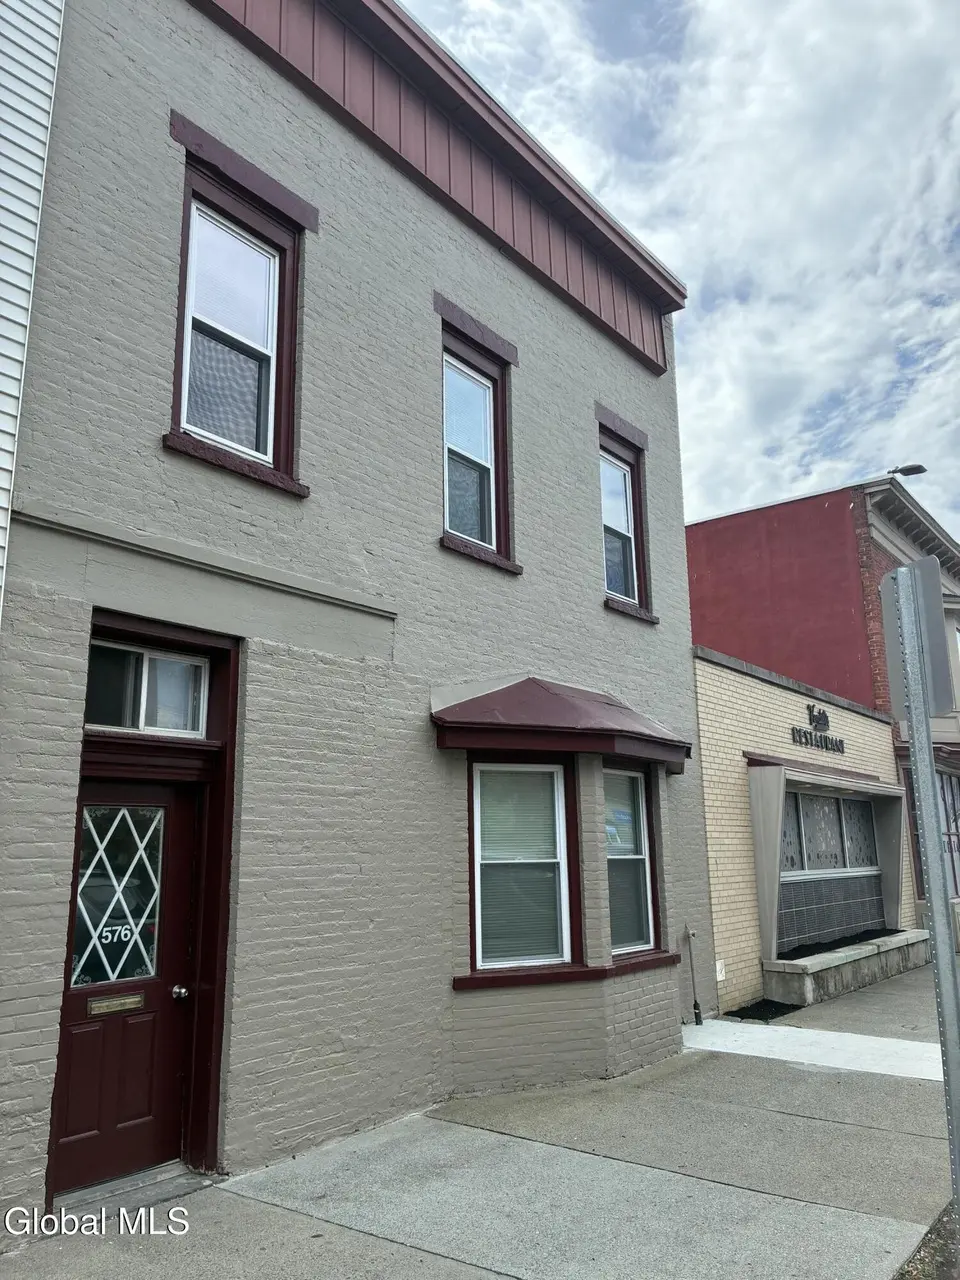
576 2nd Ave · Troy, NY
Flood risk 9/10 · Severe
- FEMA flood zone
- AE
- Chance of flooding over 30 yrs
- 0.99%
- Est. flood insurance / yr
- $2,026 – $9,024
Fire risk 3/10 · Minor
- Est. fire insurance / yr
- $691 – $1,283
Heat risk 4/10 · Minor
- Hot days now (above 95°F)
- 7 days/yr
- Hot days in 30 yrs
- 17 days/yr
Wind risk 3/10 · Minor
- Chance of severe wind over 30 yrs
- 6.0%
Air-quality risk 2/10 · Minimal
- Unhealthy air days now
- 0 days/yr
- Unhealthy air days in 30 yrs
- 1 days/yr
Risk factors via First Street. Map © Google.
Why this score? — see what drove the B+ grade
The composite is a weighted blend of 9 inputs, each scored 0–100. Each bar is that input's sub-score; the figure is the points it added to the 100-point composite (weight × sub-score).
- Cash flow +30.0/30.0
- ARV discount +15.0/15.0
- 1% rule +10.0/10.0
- DSCR +10.0/10.0
- Livability +4.0/5.0
- Schools +2.8/10.0
- Rent growth +2.5/5.0
- Condition / age +2.5/5.0
- Appreciation +0.0/10.0
$224,900
🖨 Deal sheet 📄 Offer letter ✓ Due diligence
Multi-family units
County records classify this as Multi-Family (2-4 Unit). Listing-text estimate: 2 units. confirmed
Listing remarks
Here is a great investment to receive monthly income while remodeling 1/4 of bldg interior and/or 3 car garage! This large 5 bedroom 4 bath 2 family adjacent to Verdile's Restaurant features in-law's accommodation/s to the rear of each floor. With 3/4 of bldg finished and rented out at $2,700 monthly ($1,725 - 1st Floor + $975- 2nd Floor) + utilities which leaves 1/4 of the bldg specifically the 2nd floor rear in-law area that needs rehab for potential ($700) more monthly income if needed. Front windows, kitchens, all appliances, between 2 and 4 years, & roof is 4 years old. If getting a loan flood insurance will be needed. Property is being sold ''as is where is''. Inspections can be
Key facts
- 3 car garage
- Roof is 4 years old
- 3,049 sq ft lot
Tags
Property features AI
Finance
- Financial info: Owner pays water, sewer, and trash collection; Tenants pay electricity and gas
Exterior
- Parking: 2-car garage; Off-street parking; Total parking for 3 vehicles
- Utilities: Public water; Public sewer; 100-amp electric service
- Home design: Duplex; Level lot; Lot dimensions approximately 26 x 121; Main road frontage approximately 26 feet
- Construction: Brick construction; Combination foundation
- Exterior features: Rubber roof; Wood fencing; Detached garage(s)
Interior
- Kitchen: Unit 1: 1 kitchen; Unit 2: 1 kitchen
- Bedrooms: Unit 1: 2 bedrooms (both on the 1st floor); Unit 2: 2 bedrooms (both on the 2nd floor)
- Flooring: Hardwood floors
- Bathrooms: Total: 4 full bathrooms; Unit 1: 2 full bathrooms (1st floor); Unit 2: 2 full bathrooms (2nd floor)
- Heating & cooling: Natural gas heating; Space heaters
- Interior features: High-speed internet; Unfinished basement
Neighborhood map
What this means for you Summary
Snapshot
- This is a 2 × 2-bed/2.0-bath units multifamily listed at $225k.
Deal economics
- At list price, monthly cash flow is $953 ($11k/yr) — positive. Per door: $477/mo.
- The deal already cash-flows at list — no discount required.
- Meets the 1% rule at list price ($4k rent vs $225k).
- Recommended offer: $218k (3.0% below list) — sets the bar for market timing.
- Cap rate 13.8% vs local median 5.3% in Troy — top-decile yield for the area; either an underpriced asset or a hidden risk that comps aren't pricing in. Stress-test before assuming the spread holds.
Location & tenants
- Location reads 81/100 on livability (#88 in NY, #1,350 nationally) — a professional / high-income tenant draw. Strengths: amenities A+, commute A+, housing A+; Watch: schools C-, employment C-, crime F.
- Lansingburgh Central School District (urban): math 31% / reading 35% proficiency, ranked #566 of 590 in NY (top 96%) — families likely to look elsewhere, expect single-tenant / working-renter base with shorter leases.
- Market conditions: 75 active listings in the ZIP; 405 units permitted in Rensselaer County in 2024 (224 in 5+ unit buildings).
Forward outlook
- Local home prices are declining (-3.0%/yr); year-one equity from $2k of loan paydown is wiped out by about $7k of value loss. Plan a longer hold.
- Rensselaer County population projected to shrink 6% by 2050 — rents likely to lag national; underwrite the cash flow, not the appreciation.
- At projected returns (-3.0% appreciation + 3.0% rent growth), your $63k cash investment doubles in ~7 years — after that, you're playing with house money.
Negotiation context
- It's been on market 41 days — a 3% lower offer ($218k) is reasonable based on typical stale-listing flexibility.
- 2 sale attempts since 2y ago with the ask held roughly flat each time — persistent listings suggest the price (not the market) is what's stuck; bring a comps-based counter.
Risks & watch-outs
- Watch-outs: flood insurance adds $460/mo; built in 1890 — expect roof / HVAC / electrical / plumbing capex.
- Climate carrying-cost: in FEMA flood zone AE (mandatory federal flood insurance) — expect insurance premiums to compound above CPI over the hold.
Questions for the listing agent
- It's been on market 41 days. Have you received any prior offers? Is the seller open to a 3% concession, seller financing, or rate buy-down credit?
- Can we see the unit-by-unit rent roll, current vacancy, and any below-market leases? What's the average tenancy length?
- What capital expenditures (roof, boiler, parking lot, exteriors) have been made in the last 5 years, and what's planned in the next 2?
- Built in 1890 — when were the roof, HVAC, electrical panel, plumbing, and water heater last replaced?
- What's the actual annual flood-insurance premium (NFIP or private), and is the property in a SFHA with mandatory coverage?
- Is there a deadline driving the sale (1031 exchange, divorce, estate, relocation)? That informs how much negotiation room exists.
- Crime grade is F in this area — have there been break-ins, vandalism, or insurance claims at this property in the last 3 years? What carrier currently insures it and at what premium?
- What's the average days-on-market for RENTAL listings here right now (not sales)? A rising rental-DOM trend means longer vacancies and softer asking-rent achievability than the comps imply.
- What's the recent tenant-quality profile in this submarket — average credit score on applications, eviction rate, late-payment / NSF rate, and stable-employment percentage? A property-management company in the area should have these aggregated.
- How much new apartment / multifamily construction is in the pipeline within 1–3 miles? Heavy new supply (>2% of stock underway) typically softens rents 12–24 months out; light construction supports rent growth.
Investment metrics
- 1% rule
- 1.77% ✓
- Cap rate
- 13.83%
- Cash-on-cash
- 26.94%
- DSCR
- 2.20
- GRM
- 4.7
CMA / ARV
- ARV (median comp)
- $381,215
- List price
- $224,900
- Delta
- -41.00%
- Verdict
- UNDERPRICED
- Comps
- 20 within 1.0 mi
Show comp detail 2 sales within ~0.75 mi
| Address | Dist | Beds/Ba | Sqft | Sold | Price | $/sf | Match |
|---|---|---|---|---|---|---|---|
| 842 2nd Ave | 0.72mi | 5/2.0 (+1) | 3,402 (-12%) | 10mo | $245,000 | $72 | 33 |
| 769 2nd Ave | 0.53mi | 5/3.0 (+1) | 3,302 (-15%) | 22mo | $200,000 | $61 | 23 |
Match score weights: distance 35% · size 25% · config 20% · recency 20%. Top-matched comps best support the ARV.
Projected returns pro-forma
-3.0% appreciation · 3.0% rent growth · sell at horizon
- IRR
- 9.9%
- Equity multiple
- 1.39×
- Total profit
- $24,705
- Equity at exit
- $33,533
- IRR
- 19.2%
- Equity multiple
- 2.61×
- Total profit
- $101,493
- Equity at exit
- $19,445
Cash invested: $62,972 (down + closing). Projections, not guarantees.
Landlord ↔ Tenant lean methodology
- Overall (STATE)
- 15 Strongly Tenant-Friendly
- State New York
- 15 Strongly Tenant-Friendly · D+10
- County
- — inherits STATE
- City
- — inherits STATE
ZIP-level market 12182
- Home prices YoY
- -15.6%
- Active inventory
- 75
- Price-to-rent
- 9.4×
Monthly cashflow live
- Estimated rent
- $3,972 high interval (Pro) →
- Mortgage (P&I)
- −$1,179
- Tax from tax record
- −$451 /mo · $5,416/yr
- Insurance
- −$94
- Flood insurance flood zone
- −$460 /mo · $5,525/yr
- HOA
- −$0
- Vacancy / Maint / Mgmt
- −$834
- Net cashflow
- $953
Break-even live
2-unit breakdown (identical units grouped — click to expand)
| Units | Beds | Baths | Est. rent |
|---|---|---|---|
| 2× units | 2 | 2 | $3,972 |
| #1 | 2 | 2 | $1,986 |
| #2 | 2 | 2 | $1,986 |
| Total (2 units) | $3,972 | ||
UW: 25.0% down · 7.5% · 30yr · 1.5% tax · 5.0% vac · 8.0% maint · 8.0% mgmt
Financing live
Cash to close
- Down payment
- $56,225
- Closing costs
- $6,747
- Reserves months
- —
- Total cash needed
- —
Loan-product check · same deal, 3 products live
Conventional
25% down · 7.5% · 30yr
- Down + closing
- —
- Monthly P&I
- —
- Monthly cashflow
- —
- DSCR
- —
- Eligible?
- —
Personal DTI + credit; lowest rate.
DSCR
20% down · 8.5% · 30yr
- Down + closing
- —
- Monthly P&I
- —
- Monthly cashflow
- —
- DSCR
- —
- Eligible?
- —
No personal income docs; deal must DSCR.
Hard money
10% down · 12.0% · 12mo
- Down + closing
- —
- Monthly P&I
- —
- Monthly cashflow
- —
- DSCR
- —
- Eligible?
- —
Short-term bridge; refi at stabilization.
Listing history 20 events
-
2026-06-18days on market $224,900 Active 41 DOM
-
2026-06-17days on market $224,900 Active 40 DOM
-
2026-06-16days on market $224,900 Active 39 DOM
-
2026-06-15days on market $224,900 Active 38 DOM
-
2026-06-14days on market $224,900 Active 36 DOM
-
2026-06-10days on market $224,900 Active 33 DOM
-
2026-06-09days on market $224,900 Active 32 DOM
-
2026-06-08days on market $224,900 Active 31 DOM
-
2026-06-07days on market $224,900 Active 30 DOM
-
2026-06-05days on market $224,900 Active 27 DOM
-
2026-06-03days on market $224,900 Active 26 DOM
-
2026-06-02days on market $224,900 Active 25 DOM
-
2026-06-01days on market $224,900 Active 24 DOM
-
2026-05-31days on market $224,900 Active 23 DOM
-
2026-05-31days on market $224,900 Active 22 DOM
-
2026-05-08$224,900 Active 765-char remark
-
2024-08-01historical
-
2024-05-31price $275,000
-
2024-03-07price $284,000
-
2024-01-31$299,000 Active
ⓘ Source: listings_history table (triggers on properties + properties_extension) + one-shot
backfill from property_details.listing_events for pre-trigger history.
Tax reassessment forecast NY · Partial reset (capped growth)
- Current annual tax
- $5,416 · $451/mo
- Projected year-2 tax
- $5,416 · $451/mo
- Expected delta
- $0/yr ($0/mo · 0.0%)
ⓘ Screening estimate from a state-policy table — verify with the county assessor before closing.
Climate risk First Street
- Flood 9/10 Extreme FEMA zone AE · 99% chance over 30 yrs
- Wildfire 3/10 Moderate
- Heat 4/10 Moderate 7 d/yr ≥95°F today · 17 d/yr by 30 yrs out
- Wind 3/10 Moderate 6% chance of damaging wind over 30 yrs
- Air quality 2/10 Low 0 unhealthy d/yr today · 1 by 30 yrs out
Nearby sold comps map
Loading sold comps map…
Walkable amenities ~0.75 mi
Loading nearby amenities…
Taxation est. · year 1
- Rental income
- $47,664
- − Mortgage interest
- −$12,598
- − Property taxes
- −$5,416
- − Insurance
- −$6,650
- − Repairs & maintenance
- −$3,813
- − Management
- −$3,813
- − Depreciation
- −$6,543
- Taxable income
- $8,832
- Est. tax owed @ 24.0%
- −$2,120
- After-tax cash flow
- $9,317/yr
For passive investors: Depreciation is non-cash, so a rental often shows a tax loss while cash-flowing — sheltering income. Rental losses are passive: they offset passive income freely, and up to $25,000/yr can offset ordinary (W-2) income if you actively participate and your MAGI is under $100k (phasing out to $0 by $150k); unused losses carry forward. On sale, claimed depreciation is recaptured at up to 25%, and gains may owe capital-gains tax (a 1031 exchange can defer both). Figures are a year-1 estimate at your 24.0% rate — not tax advice; consult a CPA.
Schools (NCES district)
- District
- Lansingburgh Central School District
- NCES district ID
- 3616740
- Math proficiency
- 31% ▼ -7.00%
- Reading proficiency
- 35% ▼ -6.00%
- Median HH income
- $44,807
- Composite
- 28.19/100
- National rank
- #6810
- State rank
- #566 of 590 in NY
Livability — Troy
- Score
- 81/100
- State rank
- #88
- US rank
- #1350
Category grades
Schools grade is shown separately in the Schools card above.
Census & demographics
- Census place
- Troy, NY
- City population
- 53,479
- Population (ZIP)
- 14,273
Population outlook (Rensselaer County) Hauer SSP2
- Today (2025)
- 162,400 people
- By 2030
- 161,746 · -0.4%
- By 2040
- 158,095 · -2.7%
- By 2050
- 152,966 · -5.8%
- By 2075
- 140,767 · -13.3%
- By 2100
- 124,727 · -23.2%
Race, ethnicity, and origin ACS 2023
- Neighborhood character
- Predominantly White (70%)
- Race & ethnicity
- White 70% Black 14% Two or more races 12% Hispanic / Latino 7%
- Hispanic origin (detail)
- Puerto Rican 6%
- Common ancestry
- Lithuanian 7% Romanian 3% Iranian 1%
- Foreign-born
- 3% · Canada, Jamaica
- Languages at home
- 94% English-only · Spanish 4% Other Indo-European 1%
Political lean MEDSL · Rensselaer
- 2024 margin
- Toss-up / Even · D 50.7% · R 49.3%
- 2008→2024 swing
- -8.0pp toward R · 2008: 9.3pp · 2024: 1.4pp
- All cycles
- 2024: D+1.4 2020: D+5.6 2016: R+2.9 2012: D+11.8 2008: D+9.3
Not yet ingested
- Civics
- —
Market trends
- HPI YoY
- ▼ -50.58%
- Current HPI
- 273.5758
- Rent YoY
- —
- Metro
- —
- State GDP YoY
- ▲ 2.60%
- F500 in state
- 92
Industry mix (Fortune 500 HQ in NY)
| Industry | F500 HQs | Revenue |
|---|---|---|
| Financial Services | 10 | $950B |
|
||
| Consumer Goods | 9 | $162B |
|
||
| Insurance | 4 | $225B |
|
||
| Telecommunications | 2 | $144B |
|
||
| Pharmaceuticals | 2 | $112B |
|
||
| Media / Entertainment | 2 | $69B |
|
||
Price history
-24.8% since first listed5 events — show timeline
- 2026-05-08 Listed $224,900 Global MLS
- 2024-08-01 Listing Removed — Global MLS
- 2024-05-31 Price Changed $275,000 Global MLS
- 2024-03-07 Price Changed $284,000 Global MLS
- 2024-01-31 Listed $299,000 Global MLS
Property tax history
+15.5%/yrLatest (2025): $5,416 · +1.3% YoY. Source: county tax records.
Cash-flow waterfall
monthlySold comps — $/sqft
last 12 mo · ≤1 miLoading sold comps…