 Duplex
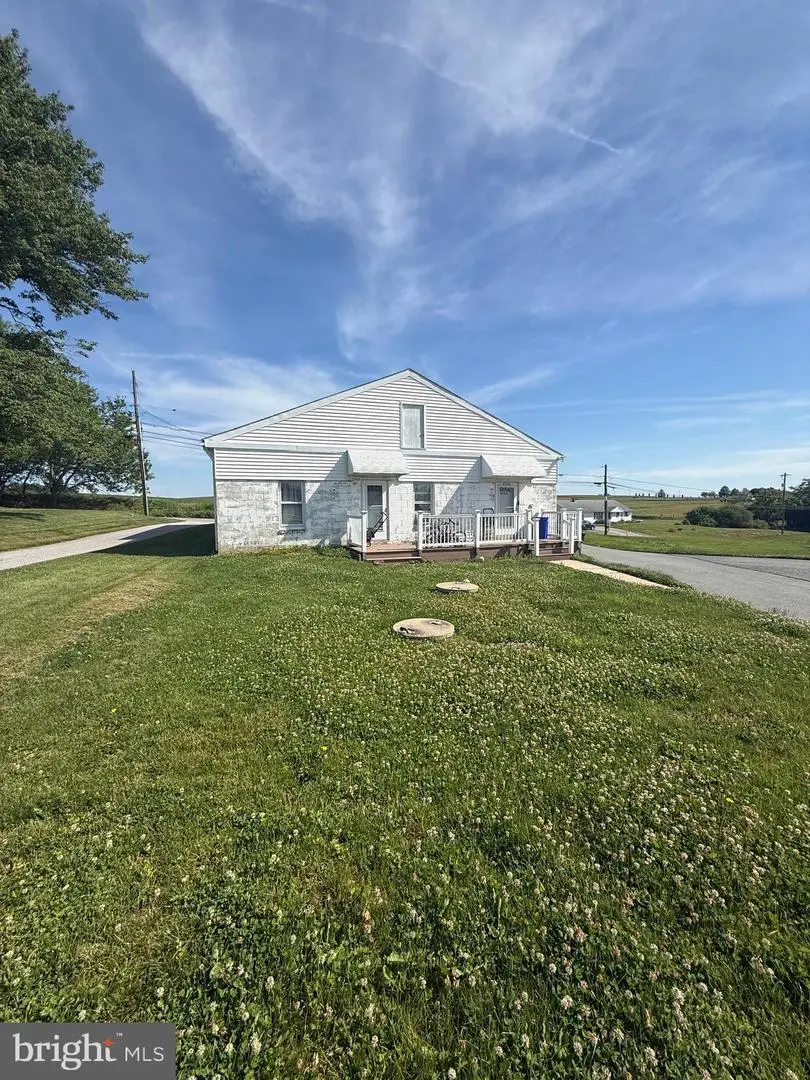
2312 Craley Rd · Lower Windsor, PA
Flood risk 1/10 · Minimal
- FEMA flood zone
- X (unshaded)
- Chance of flooding over 30 yrs
- 0.0%
- Est. flood insurance / yr
- $473 – $860
Fire risk 2/10 · Minimal
- Est. fire insurance / yr
- $511 – $949
Heat risk 5/10 · Moderate
- Hot days now (above 100°F)
- 7 days/yr
- Hot days in 30 yrs
- 15 days/yr
Wind risk 4/10 · Minor
- Chance of severe wind over 30 yrs
- 17.0%
Air-quality risk 3/10 · Minor
- Unhealthy air days now
- 2 days/yr
- Unhealthy air days in 30 yrs
- 5 days/yr
Risk factors via First Street. Map © Google.
Why this score? — see what drove the C- grade
The composite is a weighted blend of 9 inputs, each scored 0–100. Each bar is that input's sub-score; the figure is the points it added to the 100-point composite (weight × sub-score).
- Cash flow +18.3/30.0
- ARV discount +7.5/15.0
- DSCR +5.7/10.0
- Appreciation +4.7/10.0
- 1% rule +4.5/10.0
- Schools +4.5/10.0
- Rent growth +2.5/5.0
- Livability +2.5/5.0
- Condition / age +2.5/5.0
$275,000
🖨 Deal sheet 📄 Offer letter ✓ Due diligence
Multi-family units
County records classify this as Multi-Family (2-4 Unit). Listing-text estimate: 2 units. confirmed
Listing remarks MLS
You won't find an easier 2-unit anywhere in the area. This rented property is low maintenance with updated plumbing and electric, new septic system in 2020, a new rear porch, separate utilities, loads of parking, great storage shed, all in a rural setting. It is located minutes from Rexroth Park and the Long Level Marina area, and a short drive from I-83 or Route 30. The current owner has meticulous recordkeeping to pass along to the new owner. Investors don't miss out on this sweet opportunity!
Key facts
- New septic
- Two separate units
- Spacious lot
Tags
Property features AI
Finance
- Other: Fee simple ownership
- Financial info: Property is operated month-to-month leases; Total actual rent reported: $22,500
Exterior
- Parking: Asphalt driveway; Paved off-street parking
- Utilities: Public water; Public sewer; 100 amp electric service; Trash expense reported ($850)
- Home design: Detached structure; Above-grade finished living area reported by assessor
- Construction: Block construction; Stone and concrete perimeter foundation; Shed (outbuilding)
- Exterior features: Outbuilding(s) / shed; Play area; Side yards; Rural setting; Road frontage
Interior
- Kitchen: Stove; Extra refrigerator/freezer
- Bedrooms: Two 2-bedroom units (Unit 1 and Unit 2)
- Heating & cooling: Oil heating; Hot water heated by electric; 100 amp electric service
- Interior features: Attic/house fan; Outside entrance to the basement; Unfinished basement
Neighborhood map
What this means for you Summary
Snapshot
- This is a 2 × 2-bed/1.0-bath units multifamily listed at $275k.
Deal economics
- At list price, monthly cash flow is $250 ($3k/yr) — positive. Per door: $125/mo.
- The deal already cash-flows at list — no discount required.
- To meet the 1% rule (rent ≥ 1% of price), the offer needs to be $261k (5.1% below list).
- Recommended offer: $261k (5.1% below list) — sets the bar for 1% rule.
Location & tenants
- Location reads: area grade C — affects rentability + tenant quality, not the cash-flow math above.
- Eastern York SD (rural): math 40% / reading 64% proficiency, ranked #146 of 539 in PA (top 27%) — acceptable for families but not a draw, mixed tenant base, ~2y average lease.
- Zoned schools: Eastern York Hs (math 77% / reading 24%, grade D+, #125 of 437 statewide, top 30%, 632 students, 46% FRL).
- Market conditions: 50 active listings in the ZIP; 1,328 units permitted in York County in 2024 (338 in 5+ unit buildings).
Forward outlook
- In year one you build about $352 of equity ($2k loan paydown + $-2k appreciation (-0.6% local appreciation)).
Negotiation context
- Only 12 days on market — expect competitive offers; lowballing is unlikely to land.
- 2 sale attempts since 5y ago with the ask held roughly flat each time — persistent listings suggest the price (not the market) is what's stuck; bring a comps-based counter.
- Current owner paid $190k; 45% above their basis — modest negotiation headroom, anchor on the comps not their cost.
Risks & watch-outs
- Watch-outs: built in 1940 — expect roof / HVAC / electrical / plumbing capex.
- Climate carrying-cost: extreme-heat days projected 7→15/yr by 2055 (HVAC capex compounding) — expect insurance premiums to compound above CPI over the hold.
Questions for the listing agent
- Can we see the unit-by-unit rent roll, current vacancy, and any below-market leases? What's the average tenancy length?
- What capital expenditures (roof, boiler, parking lot, exteriors) have been made in the last 5 years, and what's planned in the next 2?
- Built in 1940 — when were the roof, HVAC, electrical panel, plumbing, and water heater last replaced?
- Is there a deadline driving the sale (1031 exchange, divorce, estate, relocation)? That informs how much negotiation room exists.
- What's the average days-on-market for RENTAL listings here right now (not sales)? A rising rental-DOM trend means longer vacancies and softer asking-rent achievability than the comps imply.
- What's the recent tenant-quality profile in this submarket — average credit score on applications, eviction rate, late-payment / NSF rate, and stable-employment percentage? A property-management company in the area should have these aggregated.
- How much new apartment / multifamily construction is in the pipeline within 1–3 miles? Heavy new supply (>2% of stock underway) typically softens rents 12–24 months out; light construction supports rent growth.
Investment metrics
- 1% rule
- 0.95% ✗
- Cap rate
- 7.39%
- Cash-on-cash
- 3.90%
- DSCR
- 1.17
- GRM
- 8.8
CMA / ARV
No comps found within radius.
Projected returns pro-forma
-0.56% appreciation · 3.0% rent growth · sell at horizon
- IRR
- 0.2%
- Equity multiple
- 1.01×
- Total profit
- $684
- Equity at exit
- $72,192
- IRR
- 6.3%
- Equity multiple
- 1.64×
- Total profit
- $49,210
- Equity at exit
- $80,879
Cash invested: $77,000 (down + closing). Projections, not guarantees.
Landlord ↔ Tenant lean methodology
- Overall (STATE)
- 62 Landlord-Friendly
- State Pennsylvania
- 62 Landlord-Friendly · EVEN
- County
- — inherits STATE
- City
- — inherits STATE
ZIP-level market 17366
- Home prices YoY
- -0.2%
- Active inventory
- 50
- Price-to-rent
- 17.6×
Monthly cashflow live
- Estimated rent
- $2,609 medium interval (Pro) →
- Mortgage (P&I)
- −$1,442
- Tax from tax record
- −$254 /mo · $3,049/yr
- Insurance
- −$115
- HOA
- −$0
- Vacancy / Maint / Mgmt
- −$548
- Net cashflow
- $250
Break-even live
2-unit breakdown (identical units grouped — click to expand)
| Units | Beds | Baths | Est. rent |
|---|---|---|---|
| 2× units | 2 | 1 | $2,608 |
| #1 | 2 | 1 | $1,304 |
| #2 | 2 | 1 | $1,304 |
| Total (2 units) | $2,609 | ||
UW: 25.0% down · 7.5% · 30yr · 1.5% tax · 5.0% vac · 8.0% maint · 8.0% mgmt
Financing live
Cash to close
- Down payment
- $68,750
- Closing costs
- $8,250
- Reserves months
- —
- Total cash needed
- —
Loan-product check · same deal, 3 products live
Conventional
25% down · 7.5% · 30yr
- Down + closing
- —
- Monthly P&I
- —
- Monthly cashflow
- —
- DSCR
- —
- Eligible?
- —
Personal DTI + credit; lowest rate.
DSCR
20% down · 8.5% · 30yr
- Down + closing
- —
- Monthly P&I
- —
- Monthly cashflow
- —
- DSCR
- —
- Eligible?
- —
No personal income docs; deal must DSCR.
Hard money
10% down · 12.0% · 12mo
- Down + closing
- —
- Monthly P&I
- —
- Monthly cashflow
- —
- DSCR
- —
- Eligible?
- —
Short-term bridge; refi at stabilization.
Listing history 11 events
-
2026-06-18days on market $275,000 Active 12 DOM
-
2026-06-17days on market $275,000 Active 11 DOM
-
2026-06-16days on market $275,000 Active 10 DOM
-
2026-06-15days on market $275,000 Active 9 DOM
-
2026-06-14days on market $275,000 Active 7 DOM
-
2026-06-13days on market $275,000 Active 6 DOM
-
2026-06-10days on market $275,000 Active 4 DOM
-
2026-06-09days on market $275,000 Active 3 DOM
-
2026-06-08days on market $275,000 Active 2 DOM
-
2026-06-07remarks 588-char remark
-
2026-06-07$275,000 Active 1 DOM
ⓘ Source: listings_history table (triggers on properties + properties_extension) + one-shot
backfill from property_details.listing_events for pre-trigger history.
Tax reassessment forecast PA · Partial reset (capped growth)
- Current annual tax
- $3,049 · $254/mo
- Projected year-2 tax
- $3,697 · $308/mo
- Expected delta
- +$648/yr (+$54/mo · 21.3%)
ⓘ Screening estimate from a state-policy table — verify with the county assessor before closing.
Climate risk First Street
- Flood 1/10 Low FEMA zone X (unshaded) · 0% chance over 30 yrs
- Wildfire 2/10 Low
- Heat 5/10 Major 7 d/yr ≥100°F today · 15 d/yr by 30 yrs out
- Wind 4/10 Moderate 17% chance of damaging wind over 30 yrs
- Air quality 3/10 Moderate 2 unhealthy d/yr today · 5 by 30 yrs out
Nearby sold comps map
Loading sold comps map…
Walkable amenities ~0.75 mi
Loading nearby amenities…
Taxation est. · year 1
- Rental income
- $31,308
- − Mortgage interest
- −$15,404
- − Property taxes
- −$3,049
- − Insurance
- −$1,375
- − Repairs & maintenance
- −$2,505
- − Management
- −$2,505
- − Depreciation
- −$8,000
- Taxable loss
- −$1,529
- Est. tax savings @ 24.0%
- +$367
- After-tax cash flow
- $3,371/yr
For passive investors: Depreciation is non-cash, so a rental often shows a tax loss while cash-flowing — sheltering income. Rental losses are passive: they offset passive income freely, and up to $25,000/yr can offset ordinary (W-2) income if you actively participate and your MAGI is under $100k (phasing out to $0 by $150k); unused losses carry forward. On sale, claimed depreciation is recaptured at up to 25%, and gains may owe capital-gains tax (a 1031 exchange can defer both). Figures are a year-1 estimate at your 24.0% rate — not tax advice; consult a CPA.
Schools (NCES district)
- District
- Eastern York SD
- NCES district ID
- 4208790
- Math proficiency
- 40% ▼ -18.00%
- Reading proficiency
- 64% ▼ -11.00%
- Median HH income
- $56,178
- Composite
- 44.94/100
- National rank
- #2712
- State rank
- #146 of 539 in PA
Livability — Lower Windsor
No livability data for this city. (Only ~50 U.S. cities are tracked.)
Census & demographics
- Population (ZIP)
- 6,350
Population outlook (York County) Hauer SSP2
- Today (2025)
- 454,205 people
- By 2030
- 457,407 · +0.7%
- By 2040
- 457,529 · +0.7%
- By 2050
- 448,261 · -1.3%
- By 2075
- 427,388 · -5.9%
- By 2100
- 384,218 · -15.4%
Race, ethnicity, and origin ACS 2023
- Neighborhood character
- Predominantly White (82%)
- Race & ethnicity
- White 82% Hispanic / Latino 8% Black 6% Two or more races 5%
- Hispanic origin (detail)
- Mexican 5% Puerto Rican 2%
- Common ancestry
- Romanian 2% Slovak 1% Polish 1%
- Foreign-born
- 1% · Canada
- Languages at home
- 98% English-only · Spanish 2%
Political lean MEDSL · York
- 2024 margin
- Strong R (+25.3) · D 36.9% · R 62.1%
- 2008→2024 swing
- -11.7pp toward R · 2008: -13.6pp · 2024: -25.3pp
- All cycles
- 2024: R+25.3 2020: R+24.6 2016: R+29.3 2012: R+21.2 2008: R+13.6
Not yet ingested
- Civics
- —
Market trends
- HPI YoY
- ▼ -0.56%
- Current HPI
- 274.8409
- Rent YoY
- —
- Metro
- —
- State GDP YoY
- ▲ 1.68%
- F500 in state
- 34
Industry mix (Fortune 500 HQ in PA)
| Industry | F500 HQs | Revenue |
|---|---|---|
| Healthcare | 2 | $309B |
|
||
| Insurance | 2 | $27B |
|
||
| Telecommunications / Media | 1 | $124B |
|
||
| Industrial Distribution | 1 | $22B |
|
||
| Financial Services | 1 | $20B |
|
||
| Chemicals / Materials | 1 | $18B |
|
||
Price history
+223.5% since first listed6 events — show timeline
- 2026-06-06 Listed $275,000 BRIGHT MLS
- 2022-02-28 Sold (Public Records) $190,000 Public Records
- 2022-02-25 Sold (MLS) $190,000 BRIGHT MLS
- 2022-01-24 Pending — BRIGHT MLS
- 2021-08-23 Listed $200,000 BRIGHT MLS
- 2002-12-09 Sold (Public Records) $85,000 Public Records
Property tax history
+3.1%/yrLatest (2025): $3,049 · +5.2% YoY. Source: county tax records.
Cash-flow waterfall
monthlySold comps — $/sqft
last 12 mo · ≤1 miLoading sold comps…