 🏷️ Likely Rental
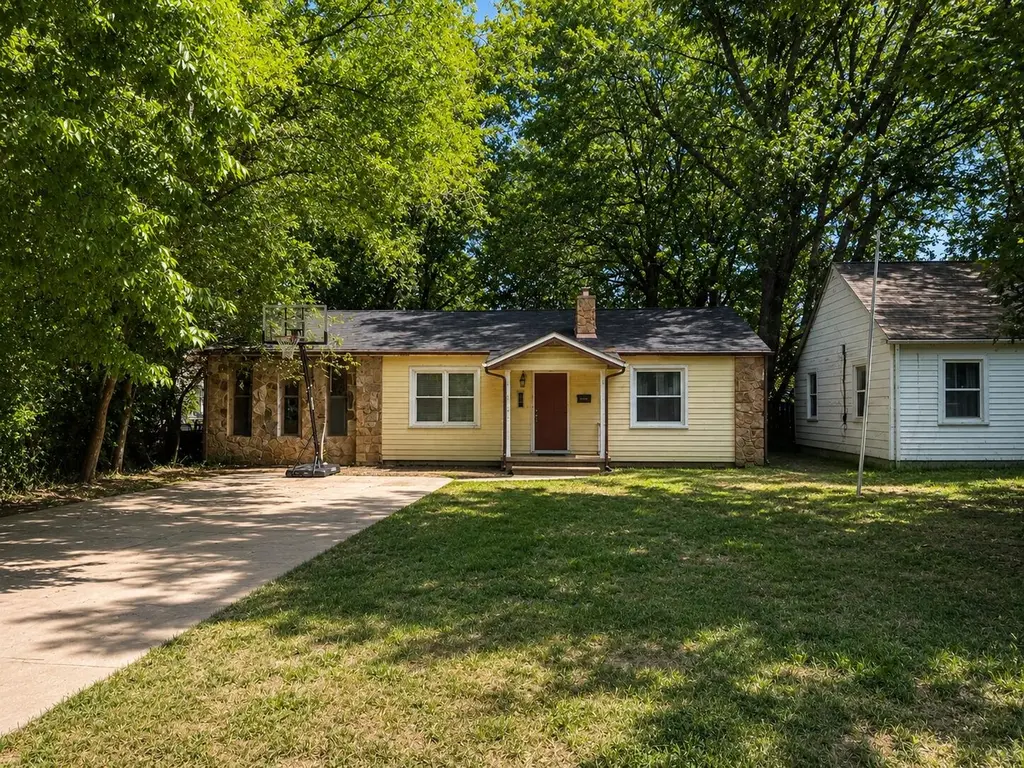
1421 E Seminole St · Springfield, MO
Flood risk 1/10 · Minimal
- FEMA flood zone
- X (unshaded)
- Chance of flooding over 30 yrs
- 0.0%
- Est. flood insurance / yr
- $507 – $1,088
Fire risk 1/10 · Minimal
- Est. fire insurance / yr
- $1,054 – $1,958
Heat risk 5/10 · Moderate
- Hot days now (above 105°F)
- 7 days/yr
- Hot days in 30 yrs
- 19 days/yr
Wind risk 2/10 · Minimal
- Chance of severe wind over 30 yrs
- —
Air-quality risk 2/10 · Minimal
- Unhealthy air days now
- 1 days/yr
- Unhealthy air days in 30 yrs
- 2 days/yr
Risk factors via First Street. Map © Google.
Why this score? — see what drove the B grade
The composite is a weighted blend of 9 inputs, each scored 0–100. Each bar is that input's sub-score; the figure is the points it added to the 100-point composite (weight × sub-score).
- Cash flow +29.5/30.0
- ARV discount +15.0/15.0
- DSCR +10.0/10.0
- 1% rule +7.3/10.0
- Livability +3.8/5.0
- Rent growth +3.3/5.0
- Schools +3.2/10.0
- Condition / age +2.5/5.0
- Appreciation +0.0/10.0
$135,000
🖨 Deal sheet (PDF) 📄 Offer letter ✓ Due diligence
Listing remarks
Excellent opportunity for investors! With strong curb appeal, this property offers the kind of long-term value buyers are looking for. Currently tenant-occupied at $1,067 per month through 02/28/2027, providing immediate rental income from day one. The appealing exterior, established tenancy, and dependable rental history make this property a great addition to an investment portfolio. Whether you are expanding your holdings or purchasing your first rental property, this home offers strong investment potential with a lease already in place.
Key facts
- 6,970 sq ft lot
- Built 1947
- Listed 15 days
Property features AI
Exterior
- Utilities: Public water; Public sewer
- Home design: Single-family residence; One level
- Construction: 1,520 above-grade finished area
- Exterior features: Public water; Public sewer; Lot in Melrose Place subdivision
Interior
- Bathrooms: 2 full bathrooms
- Heating & cooling: Central heating (natural gas); Central air conditioning
- Interior features: Fireplace; Basement
Neighborhood map
What this means for you Summary
Snapshot
- This is a 3-bed/2.0-bath single-family listed at $135k.
Deal economics
- At list price, monthly cash flow is $482 ($6k/yr) — positive.
- The deal already cash-flows at list — no discount required.
- Meets the 1% rule at list price ($2k rent vs $135k).
- Recommended offer: $133k (1.5% below list) — sets the bar for market timing.
- Cap rate 10.6% vs local median 4.6% in Springfield — top-decile yield for the area; either an underpriced asset or a hidden risk that comps aren't pricing in. Stress-test before assuming the spread holds.
Location & tenants
- Location reads 75/100 on livability (#57 in MO, #4,121 nationally) — a middle-class / working-renter tenant base. Strengths: commute A+, cost of living A+, housing A+; Watch: crime F, employment F.
- Springfield R-XII (urban): math 32% / reading 46% proficiency, ranked #174 of 324 in MO (top 54%) — families likely to look elsewhere, expect single-tenant / working-renter base with shorter leases.
- Zoned schools: Delaware Elem. (math 27% / reading 37%, grade F, #761 of 1,115 statewide, top 72%, 303 students, 66% FRL); Jarrett Middle (math 19% / reading 40%, grade F, #291 of 391 statewide, top 76%, 445 students, 70% FRL); Parkview High (math 11% / reading 40%, grade F, #433 of 521 statewide, top 83%, 1,234 students, 62% FRL) — zoned schools average 66% FRL vs 46% district-wide (20 pts higher); higher-poverty schools than district average — tighter screening recommended.
- Market conditions: Rents rising (+3.2%/yr); 270 active listings in the ZIP; 19 comparable units currently listed for rent nearby; rentals lingering (median 46d on market — plan ~5-8 weeks vacancy on turnover, expect pricing pressure); 53% of comp listings sitting > 30 days — soft ceiling on asking rent; 1,302 units permitted in Greene County in 2024 (250 in 5+ unit buildings).
- This rent runs 32% of the median local income ($62k/yr) — at the standard rent-burdened threshold; future hikes will face affordability resistance.
Forward outlook
- Local home prices are declining (-3.0%/yr); year-one equity from $933 of loan paydown is wiped out by about $4k of value loss. Plan a longer hold.
- Greene County population projected at +25% by 2050 — long-run rental-demand tailwind backs the buy-and-hold thesis.
- At projected returns (-3.0% appreciation + 3.2% rent growth), your $38k cash investment doubles in ~8 years — after that, you're playing with house money.
Negotiation context
- It's been on market 15 days — a 2% lower offer ($133k) is reasonable based on typical stale-listing flexibility.
- 2 sale attempts since 9y ago with the ask held roughly flat each time — persistent listings suggest the price (not the market) is what's stuck; bring a comps-based counter.
Risks & watch-outs
- Watch-outs: built in 1947 — expect roof / HVAC / electrical / plumbing capex.
- Climate carrying-cost: extreme-heat days projected 7→19/yr by 2055 (HVAC capex compounding) — expect insurance premiums to compound above CPI over the hold.
Questions for the listing agent
- Built in 1947 — when were the roof, HVAC, electrical panel, plumbing, and water heater last replaced?
- Is there a deadline driving the sale (1031 exchange, divorce, estate, relocation)? That informs how much negotiation room exists.
- Crime grade is F in this area — have there been break-ins, vandalism, or insurance claims at this property in the last 3 years? What carrier currently insures it and at what premium?
- What's the average days-on-market for RENTAL listings here right now (not sales)? A rising rental-DOM trend means longer vacancies and softer asking-rent achievability than the comps imply.
- What's the recent tenant-quality profile in this submarket — average credit score on applications, eviction rate, late-payment / NSF rate, and stable-employment percentage? A property-management company in the area should have these aggregated.
- How much new for-sale + rental construction is in the pipeline within 1–3 miles? Heavy new supply typically softens prices + rents 12–24 months out; constrained supply supports both.
Investment metrics
- 1% rule
- 1.23% ✓
- Cap rate
- 10.58%
- Cash-on-cash
- 15.31%
- DSCR
- 1.68
- GRM
- 6.8
CMA / ARV
- ARV (median comp)
- $210,352
- List price
- $135,000
- Delta
- -35.82%
- Verdict
- UNDERPRICED
- Comps
- 20 within 1.0 mi
Show comp detail 12 sales within ~0.75 mi
| Address | Dist | Beds/Ba | Sqft | Sold | Price | $/sf | Match |
|---|---|---|---|---|---|---|---|
| 1541 E Crestview St | 0.30mi | 3/1.5 | 1,521 (+0%) | 3mo | $219,900 | $145 | 82 |
| 1538 E Lindberg St | 0.21mi | 3/1.5 | 1,430 (-6%) | 2mo | $190,000 | $133 | 76 |
| 2323 S Hampton Ave | 0.52mi | 3/1.5 | 1,524 (+0%) | 2mo | $229,900 | $151 | 72 |
| 2528 S Weller Ave | 0.47mi | 3/2.0 | 1,568 (+3%) | 2mo | $260,000 | $166 | 71 |
| 1532 E Seminole St | 0.17mi | 3/1.5 | 1,310 (-14%) | 2mo | $223,900 | $171 | 65 |
| 1847 S Collinson Ave | 0.39mi | 3/1.5 | 1,633 (+7%) | 3mo | $228,000 | $140 | 65 |
| 2524 S Kickapoo Ave | 0.44mi | 2/1.5 (-1) | 1,464 (-4%) | 2mo | $219,900 | $150 | 65 |
| 2535 S Prospect Ave | 0.50mi | 3/2.0 | 1,404 (-8%) | 2mo | $250,000 | $178 | 62 |
| 1261 E Gretna St | 0.66mi | 3/2.0 | 1,460 (-4%) | 0mo | $229,000 | $157 | 62 |
| 1229 E Berkeley St | 0.30mi | 4/2.0 (+1) | 1,733 (+14%) | 3mo | $260,000 | $150 | 56 |
| 2147 S Hampton Ave | 0.49mi | 2/1.0 (-1) | 1,416 (-7%) | 3mo | $259,900 | $184 | 54 |
| 2346 S Florence Ave | 0.45mi | 4/2.5 (+1) | 1,716 (+13%) | 2mo | $260,000 | $152 | 49 |
Match score weights: distance 35% · size 25% · config 20% · recency 20%. Top-matched comps best support the ARV.
Projected returns pro-forma
-3.0% appreciation · 3.23% rent growth · sell at horizon
- IRR
- 6.2%
- Equity multiple
- 1.24×
- Total profit
- $9,183
- Equity at exit
- $20,129
- IRR
- 15.8%
- Equity multiple
- 2.30×
- Total profit
- $48,964
- Equity at exit
- $11,672
Cash invested: $37,800 (down + closing). Projections, not guarantees.
Landlord ↔ Tenant lean methodology
- Overall (STATE)
- 81 Strongly Landlord-Friendly
- State Missouri
- 81 Strongly Landlord-Friendly · R+10
- County
- — inherits STATE
- City
- — inherits STATE
ZIP-level market 65804
- Rents YoY
- 3.2%
- Active inventory
- 270
- Price-to-rent
- 6.8×
Monthly cashflow live
- Estimated rent
- $1,656 high interval (Pro) →
- Mortgage (P&I)
- −$708
- Tax from tax record
- −$61 /mo · $737/yr
- Insurance
- −$56
- HOA
- −$0
- Lot rent
- −$0
- Vacancy / Maint / Mgmt
- −$348
- Net cashflow
- $482
Break-even live
Sensitivity live
| Price | -10% $559 | -5% $520 | +0% $482 | +5% $444 | +10% $406 |
|---|---|---|---|---|---|
| Rent | -10% $351 | -5% $417 | +0% $482 | +5% $548 | +10% $613 |
| Rate | -1.0pp $550 | -0.5pp $517 | base $482 | +0.5pp $447 | +1.0pp $412 |
UW: 25.0% down · 7.5% · 30yr · 1.5% tax · 5.0% vac · 8.0% maint · 8.0% mgmt
Financing live
Cash to close
- Down payment
- $33,750
- Closing costs
- $4,050
- Reserves months
- —
- Total cash needed
- —
Loan-product check · same deal, 3 products live
Conventional
25% down · 7.5% · 30yr
- Down + closing
- —
- Monthly P&I
- —
- Monthly cashflow
- —
- DSCR
- —
- Eligible?
- —
Personal DTI + credit; lowest rate.
DSCR
20% down · 8.5% · 30yr
- Down + closing
- —
- Monthly P&I
- —
- Monthly cashflow
- —
- DSCR
- —
- Eligible?
- —
No personal income docs; deal must DSCR.
Hard money
10% down · 12.0% · 12mo
- Down + closing
- —
- Monthly P&I
- —
- Monthly cashflow
- —
- DSCR
- —
- Eligible?
- —
Short-term bridge; refi at stabilization.
Rent comps 19 comps
| Address | Beds | Baths | Sqft | Rent | $/sqft | DOM | Units | Dist |
|---|---|---|---|---|---|---|---|---|
| 1477 E Lindberg St Springfield, MO | 3.0 | 1.0 | 1300 | $1,445 | $1.11 | 16d | 1 | 0.16mi |
| 1259 E Berkeley St Springfield, MO | 3.0 | 2.0 | 1382 | $1,699 | $1.23 | 46d | 1 | 0.25mi |
| 2308 S Hampton Ave Springfield, MO | 3.0 | 1.5 | 1440 | $1,650 | $1.15 | 46d | 1 | 0.47mi |
| 2535 S Prospect Ave Springfield, MO | 3.0 | 2.0 | 1404 | $1,595 | $1.14 | 16d | 1 | 0.51mi |
| 1918 S Kings Ave Springfield, MO | 3.0 | 2.0 | 1520 | $2,200 | $1.45 | 46d | 1 | 0.64mi |
| 1562 S National Ave Springfield, MO | 3.0 | 1.0 | 1064 | $1,225 | $1.15 | 46d | 1 | 0.82mi |
| 932 E Sunset St Springfield, MO | 2.0–3.0 | 2.0 | 1088 | $1,895 | $1.74 | 16d | 3 | 0.83mi |
| 1855 S Valleyroad Ave Springfield, MO | 4.0 | 2.0 | 1920 | $2,300 | $1.20 | 46d | 1 | 0.84mi |
| 1044 E Linwood Dr Springfield, MO | 3.0 | 1.5 | 1720 | $1,750 | $1.02 | 46d | 1 | 0.91mi |
| 1420 S Pickwick Ave Springfield, MO | 3.0 | 2.0 | 1164 | $1,550 | $1.33 | 46d | 1 | 0.93mi |
| 813 E Morningside St Springfield, MO | 3.0 | 1.0 | 1216 | $1,395 | $1.15 | 26d | 1 | 0.95mi |
| 2720 S Stewart Ave Springfield, MO | 2.0 | 1.5 | 1600 | $1,200 | $0.75 | 26d | 1 | 0.95mi |
| 2521 S Holland Ave Springfield, MO | 1.0–2.0 | 1.0–2.0 | 1034 | $1,695 | $1.64 | 46d | 1 | 0.98mi |
| 2715 S Kimbrough Ave Springfield, MO | 2.0 | 2.0 | 1640 | $2,660 | $1.62 | 16d | 8 | 1.18mi |
| 2020 E Holly Ct Springfield, MO | 3.0 | 2.0 | 1718 | $1,595 | $0.93 | 46d | 1 | 1.38mi |
| 2917 S Roanoke Ave Springfield, MO | 3.0 | 2.0 | 1262 | $1,700 | $1.35 | 26d | 1 | 1.39mi |
| 2935 S Roanoke Ave Springfield, MO | 3.0 | 2.0 | 1429 | $1,150 | $0.80 | 16d | 1 | 1.42mi |
| 428 W Broadmoor St Springfield, MO | 4.0 | 2.0 | 1804 | $1,850 | $1.03 | 16d | 1 | 1.43mi |
| 820 E Montclair St Springfield, MO | 1.0–2.0 | 1.0–2.0 | 870 | $1,100 | $1.26 | 46d | 1 | 1.44mi |
Listing history 4 events
-
2026-05-30status $135,000 Pending 15 DOM
-
2026-05-14$135,000 Active 545-char remark
-
2022-09-01soldstatus
-
2017-01-02$70,000
ⓘ Source: listings_history table (triggers on properties + properties_extension) + one-shot
backfill from property_details.listing_events for pre-trigger history.
Tax reassessment forecast MO · Resets to sale price
- Current annual tax
- $737 · $61/mo
- Projected year-2 tax
- $1,310 · $109/mo
- Expected delta
- +$572/yr (+$48/mo · 77.6%)
ⓘ Screening estimate from a state-policy table — verify with the county assessor before closing.
Climate risk First Street
- Flood 1/10 Low FEMA zone X (unshaded) · 0% chance over 30 yrs
- Wildfire 1/10 Low
- Heat 5/10 Major 7 d/yr ≥105°F today · 19 d/yr by 30 yrs out
- Wind 2/10 Low
- Air quality 2/10 Low 1 unhealthy d/yr today · 2 by 30 yrs out
Nearby sold comps map
Loading sold comps map…
Walkable amenities ~0.75 mi
Loading nearby amenities…
Taxation est. · year 1
- Rental income
- $19,867
- − Mortgage interest
- −$7,562
- − Property taxes
- −$737
- − Insurance
- −$675
- − Repairs & maintenance
- −$1,589
- − Management
- −$1,589
- − Depreciation
- −$3,927
- Taxable income
- $3,787
- Est. tax owed @ 24.0%
- −$909
- After-tax cash flow
- $4,878/yr
For passive investors: Depreciation is non-cash, so a rental often shows a tax loss while cash-flowing — sheltering income. Rental losses are passive: they offset passive income freely, and up to $25,000/yr can offset ordinary (W-2) income if you actively participate and your MAGI is under $100k (phasing out to $0 by $150k); unused losses carry forward. On sale, claimed depreciation is recaptured at up to 25%, and gains may owe capital-gains tax (a 1031 exchange can defer both). Figures are a year-1 estimate at your 24.0% rate — not tax advice; consult a CPA.
Schools (NCES district)
- District
- Springfield R-XII
- NCES district ID
- 2928860
- Math proficiency
- 32% ▼ -2.00%
- Reading proficiency
- 46% ▼ -3.00%
- Median HH income
- $37,886
- Composite
- 32.45/100
- National rank
- #5717
- State rank
- #174 of 324 in MO
Livability — Springfield
- Score
- 75/100
- State rank
- #57
- US rank
- #4121
Category grades
Schools grade is shown separately in the Schools card above.
Census & demographics
- Census place
- Springfield, MO
- County
- Greene County · 244,327 people
- City population
- 223,044
- Metro
- Springfield, MO
- Population (ZIP)
- 40,935
- Household income
- $62,301
- Rent vs Own
- Severe rent burden
- 1412.0
Population outlook (Greene County) Hauer SSP2
- Today (2025)
- 319,054 people
- By 2030
- 335,135 · +5.0%
- By 2040
- 366,186 · +14.8%
- By 2050
- 397,431 · +24.6%
- By 2075
- 477,035 · +49.5%
- By 2100
- 520,828 · +63.2%
Race, ethnicity, and origin ACS 2023
- Neighborhood character
- Predominantly White (87%)
- Race & ethnicity
- White 87% Two or more races 5% Hispanic / Latino 4% Black 2% Asian 2%
- Common ancestry
- Italian 3% Lithuanian 3% Slovak 3%
- Foreign-born
- 3% · Canada, South Korea
- Languages at home
- 95% English-only · Spanish 2% Other Indo-European 1%
Political lean MEDSL · Greene
- 2024 margin
- Strong R (+20.8) · D 38.9% · R 59.7% · Other 1.4%
- 2008→2024 swing
- -5.0pp toward R · 2008: -15.8pp · 2024: -20.8pp
- All cycles
- 2024: R+20.8 2020: R+20.1 2016: R+27.4 2012: R+24.4 2008: R+15.8
Not yet ingested
- Civics
- —
Market trends
- HPI YoY
- ▼ -271.81%
- Current HPI
- 197.8418
- Rent YoY
- ▲ 3.23%
- Metro
- Springfield, MO
- State GDP YoY
- ▲ 1.84%
- F500 in state
- 20
Industry mix (Fortune 500 HQ in MO)
| Industry | F500 HQs | Revenue |
|---|---|---|
| Healthcare | 1 | $163B |
|
||
| Insurance | 1 | $21B |
|
||
| Industrial Technology | 1 | $17B |
|
||
| Retail | 1 | $16B |
|
||
| Industrial Distribution | 1 | $10B |
|
||
| Utilities | 1 | $9B |
|
||
Price history
+92.9% since first listed4 events — show timeline
- 2026-05-29 Pending — SOMO
- 2026-05-14 Listed $135,000 SOMO
- 2022-09-01 Sold (Public Records) — Public Records
- 2017-01-02 Listed $70,000 SOMO
Property tax history
+4.8%/yrLatest (2025): $737 · +1.1% YoY. Source: county tax records.
Cash-flow waterfall
monthlySold comps — $/sqft
last 12 mo · ≤1 miLoading sold comps…