31200 Landau Blvd #206 · Cathedral City, CA
Flood risk 1/10 · Minimal
- FEMA flood zone
- X
- Chance of flooding over 30 yrs
- 0.0%
- Est. flood insurance / yr
- $507 – $1,088
Fire risk 1/10 · Minimal
- Est. fire insurance / yr
- $659 – $1,223
Heat risk 9/10 · Severe
- Hot days now (above 113°F)
- 7 days/yr
- Hot days in 30 yrs
- 20 days/yr
Wind risk 1/10 · Minimal
- Chance of severe wind over 30 yrs
- —
Air-quality risk 5/10 · Moderate
- Unhealthy air days now
- 6 days/yr
- Unhealthy air days in 30 yrs
- 8 days/yr
Risk factors via First Street. Map © Google.
Why this score? — see what drove the D grade
The composite is a weighted blend of 9 inputs, each scored 0–100. Each bar is that input's sub-score; the figure is the points it added to the 100-point composite (weight × sub-score).
- ARV discount +13.8/15.0
- Cash flow +7.7/30.0
- 1% rule +5.1/10.0
- Rent growth +3.3/5.0
- Livability +3.3/5.0
- Schools +2.7/10.0
- Condition / age +2.5/5.0
- DSCR +1.8/10.0
- Appreciation +0.0/10.0
$219,000
🖨 Deal sheet (PDF) 📄 Offer letter ✓ Due diligence
Listing remarks MLS
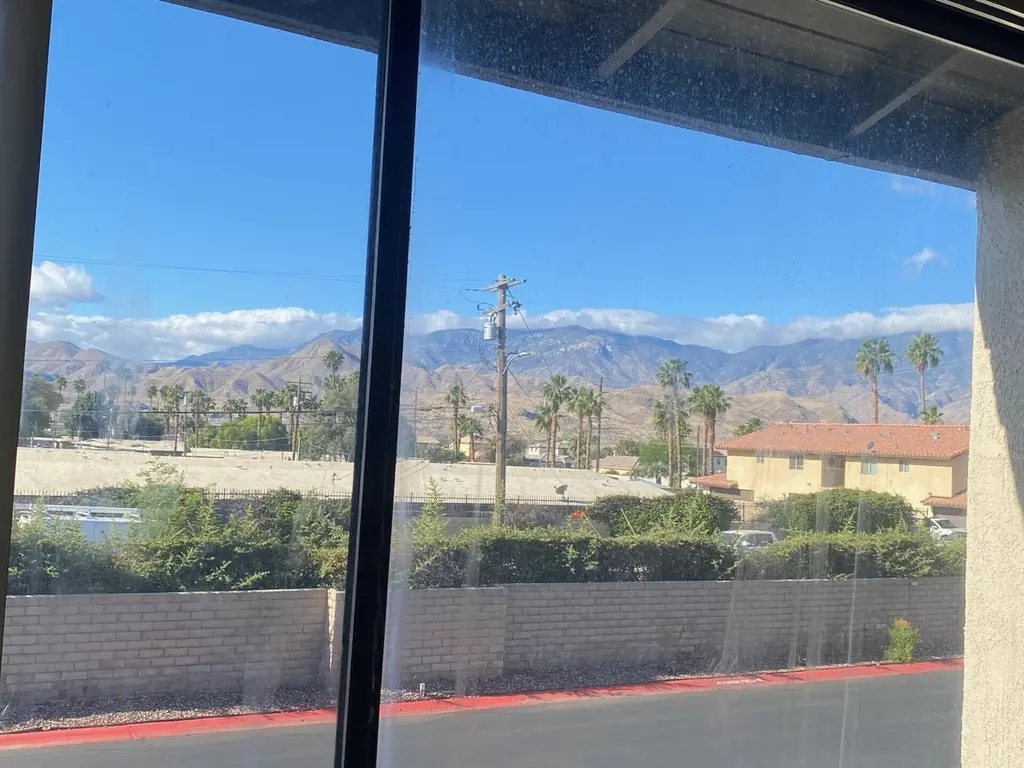
Mountain views with 2 bedrooms & 2 full bathsl community offers gym, pools, spas and Pickle Ball/Tennis court. This condo is ready for some renovation and is priced to sell. Air conditioning and appliances are all in working condition.
Key facts
- Air conditioning
- Spas
- Gym
Tags
Neighborhood map
What this means for you Summary
Snapshot
- This is a 2-bed/2.0-bath condo listed at $219k.
Deal economics
- At list price, monthly cash flow is $-250 ($-3k/yr) — negative.
- To cash-flow at today's rent, offer at most $175k (20.2% below list).
- Meets the 1% rule at list price ($2k rent vs $219k).
- Recommended offer: $175k (20.2% below list) — sets the bar for cash-flow.
Location & tenants
- Location reads 66/100 on livability (#344 in CA) — a middle-class / working-renter tenant base. Strengths: commute A+, housing B+; Watch: employment D+, schools F, amenities D-.
- Palm Springs Unified (suburban): math 21% / reading 42% proficiency, ranked #328 of 517 in CA (top 63%) — families likely to look elsewhere, expect single-tenant / working-renter base with shorter leases; 73% free/reduced lunch — lower-income household profile, screen leases tightly.
- Market conditions: Rents rising (+3.2%/yr); 525 active listings in the ZIP; 21 comparable units currently listed for rent nearby; rentals at typical pace (median 25d on market — plan ~3-4 weeks tenant-placement turnaround); 48% of comp listings sitting > 30 days — soft ceiling on asking rent; 9,195 units permitted in Riverside County in 2024 (1,512 in 5+ unit buildings).
- This rent runs 36% of the median local income ($74k/yr) — at the standard rent-burdened threshold; future hikes will face affordability resistance.
Forward outlook
- Local home prices are declining (-3.0%/yr); year-one equity from $2k of loan paydown is wiped out by about $7k of value loss. Plan a longer hold.
- Riverside County population projected at +22% by 2050 — long-run rental-demand tailwind backs the buy-and-hold thesis.
Negotiation context
- It's been on market 28 days — a 2% lower offer ($216k) is reasonable based on typical stale-listing flexibility.
- 3 sale attempts since 25y ago with the ask held roughly flat each time — persistent listings suggest the price (not the market) is what's stuck; bring a comps-based counter.
- Current owner paid $140k; list at $219k implies a 56% gain — meaningful room to come down on a strong offer.
Risks & watch-outs
- Watch-outs: HOA is 24% of rent.
- Climate carrying-cost: extreme-heat days projected 7→20/yr by 2055 (HVAC capex compounding) — expect insurance premiums to compound above CPI over the hold.
Questions for the listing agent
- What do current leases actually rent for vs. the listed asking? Can we see a recent rent roll and the last 12 months of T-12 income?
- What does the HOA fee cover, when was the last increase, and are there any pending special assessments or reserve-fund shortfalls?
- Any open or pending special assessments — roof, HVAC, plumbing, elevator, façade? What's the per-unit balance and payoff schedule, and is the seller paying it off at close or rolling it to the buyer?
- Is there a deadline driving the sale (1031 exchange, divorce, estate, relocation)? That informs how much negotiation room exists.
- Schools are F-rated, which usually means shorter tenancies and higher turnover. Who's the typical renter profile here, and what's been the actual vacancy rate?
- The area grade is low — what's the realistic commute time and amenity access for the typical tenant pool here? Any planned neighborhood developments (good or bad) we should know about?
- What's the average days-on-market for RENTAL listings here right now (not sales)? A rising rental-DOM trend means longer vacancies and softer asking-rent achievability than the comps imply.
- What's the recent tenant-quality profile in this submarket — average credit score on applications, eviction rate, late-payment / NSF rate, and stable-employment percentage? A property-management company in the area should have these aggregated.
- How much new apartment / multifamily construction is in the pipeline within 1–3 miles? Heavy new supply (>2% of stock underway) typically softens rents 12–24 months out; light construction supports rent growth.
Investment metrics
- 1% rule
- 1.01% ✓
- Cap rate
- 4.92%
- Cash-on-cash
- -4.90%
- DSCR
- 0.78
- GRM
- 8.3
CMA / ARV
- ARV (median comp)
- $254,488
- List price
- $219,000
- Delta
- -13.94%
- Verdict
- UNDERPRICED
- Comps
- 20 within 1.0 mi
Projected returns pro-forma
-3.0% appreciation · 3.22% rent growth · sell at horizon
- IRR
- -24.1%
- Equity multiple
- 0.17×
- Total profit
- $-50,610
- Equity at exit
- $32,654
- IRR
- -18.0%
- Equity multiple
- 0.00×
- Total profit
- $-61,252
- Equity at exit
- $18,935
Cash invested: $61,320 (down + closing). Projections, not guarantees.
Landlord ↔ Tenant lean methodology
- Overall (STATE)
- 18 Strongly Tenant-Friendly
- State California
- 18 Strongly Tenant-Friendly · D+13
- County
- — inherits STATE
- City
- — inherits STATE
ZIP-level market 92234
- Home prices YoY
- -27.7%
- Rents YoY
- 3.2%
- Active inventory
- 525
- Price-to-rent
- 8.3×
Monthly cashflow live
- Estimated rent
- $2,203 high interval (Pro) →
- Mortgage (P&I)
- −$1,148
- Tax from tax record
- −$231 /mo · $2,768/yr
- Insurance
- −$91
- HOA
- −$520
- Vacancy / Maint / Mgmt
- −$463
- Net cashflow
- $-250
Break-even live
Sensitivity live
| Price | -10% $-126 | -5% $-188 | +0% $-250 | +5% $-312 | +10% $-374 |
|---|---|---|---|---|---|
| Rent | -10% $-424 | -5% $-337 | +0% $-250 | +5% $-163 | +10% $-76 |
| Rate | -1.0pp $-140 | -0.5pp $-195 | base $-250 | +0.5pp $-307 | +1.0pp $-365 |
UW: 25.0% down · 7.5% · 30yr · 1.5% tax · 5.0% vac · 8.0% maint · 8.0% mgmt
Financing live
Cash to close
- Down payment
- $54,750
- Closing costs
- $6,570
- Reserves months
- —
- Total cash needed
- —
Loan-product check · same deal, 3 products live
Conventional
25% down · 7.5% · 30yr
- Down + closing
- —
- Monthly P&I
- —
- Monthly cashflow
- —
- DSCR
- —
- Eligible?
- —
Personal DTI + credit; lowest rate.
DSCR
20% down · 8.5% · 30yr
- Down + closing
- —
- Monthly P&I
- —
- Monthly cashflow
- —
- DSCR
- —
- Eligible?
- —
No personal income docs; deal must DSCR.
Hard money
10% down · 12.0% · 12mo
- Down + closing
- —
- Monthly P&I
- —
- Monthly cashflow
- —
- DSCR
- —
- Eligible?
- —
Short-term bridge; refi at stabilization.
Rent comps 21 comps
| Address | Beds | Baths | Sqft | Rent | $/sqft | DOM | Units | Dist |
|---|---|---|---|---|---|---|---|---|
| 31520 Landau Blvd Unit 3 Cathedral City, CA | 1.0 | 1.0 | 800 | $1,650 | $2.06 | 0d | 1 | 0.05mi |
| 31200 Landau Blvd Cathedral City, CA | 2.0–3.0 | 2.0 | 1016 | $2,300 | $2.26 | 44d | 3 | 0.16mi |
| 31200 Landau Blvd Cathedral City, CA | 2.0–3.0 | 2.0 | 1016 | $2,195 | $2.16 | 13d | 4 | 0.16mi |
| 68185 Alcita Rd Cathedral City, CA | 2.0 | 2.0 | 975 | $1,895 | $1.94 | 2d | 1 | 0.31mi |
| 68160 Modalo Rd Unit 68162 Cathedral City, CA | 3.0 | 2.0 | 1000 | $2,499 | $2.50 | 15d | 1 | 0.56mi |
| 32200 Cathedral Canyon Dr #31 Cathedral City, CA | 1.0 | 1.0 | 740 | $1,550 | $2.09 | 25d | 1 | 0.65mi |
| 1 Lakeview Cir Cathedral City, CA | 2.0 | 2.0 | 1000 | $2,300 | $2.30 | 44d | 1 | 0.75mi |
| 32150 Aurora Vista Rd Cathedral City, CA | 2.0 | 1.0 | 1100 | $2,195 | $2.00 | 44d | 1 | 0.81mi |
| 32150 Aurora Vista Rd Unit C Cathedral City, CA | 2.0 | 1.0 | 1100 | $2,395 | $2.18 | 44d | 1 | 0.81mi |
| 33030 Shifting Sands Trl Apt 4 Cathedral City, CA | 2.0 | 1.0 | 821 | $1,599 | $1.95 | 25d | 1 | 0.81mi |
| 68080 Risueno Rd Cathedral City, CA | 2.0 | 1.0 | 800 | $2,200 | $2.75 | 15d | 1 | 0.86mi |
| 30125 Avenida Juarez Unit 30127 Cathedral City, CA | 3.0 | 2.0 | 1000 | $2,499 | $2.50 | 15d | 1 | 0.93mi |
| Lawrence Crossley Rd Unit 62 Palm Springs, CA | 2.0 | 2.0 | 885 | $2,100 | $2.37 | 44d | 1 | 0.95mi |
| 32585 Cielo Vista Rd Cathedral City, CA | 2.0 | 2.0 | 840 | $2,000 | $2.38 | 25d | 1 | 0.99mi |
| 32425 Rancho Vista Dr Unit A Cathedral City, CA | 2.0 | 1.0 | 754 | $1,950 | $2.59 | 8d | 1 | 1.00mi |
| 30201 San Diego Dr Cathedral City, CA | 3.0 | 2.0 | 1060 | $2,700 | $2.55 | 44d | 1 | 1.05mi |
| 33495 Cathedral Canyon Dr Cathedral City, CA | 2.0 | 1.0 | 1100 | $2,200 | $2.00 | 44d | 1 | 1.12mi |
| 33495 Cathedral Canyon Dr Unit B Cathedral City, CA | 2.0 | 1.0 | 1100 | $2,100 | $1.91 | 44d | 1 | 1.12mi |
| 28984 Desert Princess Dr Unit 702 Cathedral City, CA | 1.0 | 2.0 | 851 | $3,400 | $4.00 | 44d | 1 | 1.28mi |
| 33255 Date Palm Dr Cathedral City, CA | 2.0 | 2.0 | 1050 | $1,795 | $1.71 | 44d | 1 | 1.35mi |
| 28763 E Portales Dr Cathedral City, CA | 2.0 | 2.0 | 984 | $4,200 | $4.27 | 8d | 1 | 1.38mi |
HOA detail condo
- Monthly dues
- $520 · $6,240/yr
- Likely covers
- poolgym
- Assessments
- None detected in remarks — confirm with the listing agent.
Listing history 10 events
-
2026-05-11status Pending 241-char remark
Show marketing remark (241 chars)
Mountain views with 2 bedrooms & 2 full bathsl community offers gym, pools, spas and Pickle Ball/Tennis court. This condo is ready for some renovation and is priced to sell. Air conditioning and appliances are all in working condition.
-
2026-04-24price $219,000 241-char remark
Show marketing remark (241 chars)
Mountain views with 2 bedrooms & 2 full bathsl community offers gym, pools, spas and Pickle Ball/Tennis court. This condo is ready for some renovation and is priced to sell. Air conditioning and appliances are all in working condition.
-
2026-04-13$223,000 Active 241-char remark
Show marketing remark (241 chars)
Mountain views with 2 bedrooms & 2 full bathsl community offers gym, pools, spas and Pickle Ball/Tennis court. This condo is ready for some renovation and is priced to sell. Air conditioning and appliances are all in working condition.
-
2004-07-20soldstatus $140,000
-
2004-07-20soldstatus $140,000
-
2004-06-08historical
-
2004-06-01$139,000
-
2001-10-18historical
-
2001-07-07$75,000
-
1986-09-12soldstatus $60,000
ⓘ Source: listings_history table (triggers on properties + properties_extension) + one-shot
backfill from property_details.listing_events for pre-trigger history.
Tax reassessment forecast CA · Resets to sale price
- Current annual tax
- $2,768 · $231/mo
- Projected year-2 tax
- $2,768 · $231/mo
- Expected delta
- $0/yr ($0/mo · 0.0%)
ⓘ Screening estimate from a state-policy table — verify with the county assessor before closing.
Climate risk First Street
- Flood 1/10 Low FEMA zone X · 0% chance over 30 yrs
- Wildfire 1/10 Low
- Heat 9/10 Extreme 7 d/yr ≥113°F today · 20 d/yr by 30 yrs out
- Wind 1/10 Low
- Air quality 5/10 Major 6 unhealthy d/yr today · 8 by 30 yrs out
Nearby sold comps map
Loading sold comps map…
Walkable amenities ~0.75 mi
Loading nearby amenities…
Taxation est. · year 1
- Rental income
- $26,432
- − Mortgage interest
- −$12,267
- − Property taxes
- −$2,768
- − Insurance
- −$1,095
- − Repairs & maintenance
- −$2,115
- − Management
- −$2,115
- − HOA
- −$6,240
- − Depreciation
- −$6,371
- Taxable loss
- −$6,538
- Est. tax savings @ 24.0%
- +$1,569
- After-tax cash flow
- $-1,434/yr
For passive investors: Depreciation is non-cash, so a rental often shows a tax loss while cash-flowing — sheltering income. Rental losses are passive: they offset passive income freely, and up to $25,000/yr can offset ordinary (W-2) income if you actively participate and your MAGI is under $100k (phasing out to $0 by $150k); unused losses carry forward. On sale, claimed depreciation is recaptured at up to 25%, and gains may owe capital-gains tax (a 1031 exchange can defer both). Figures are a year-1 estimate at your 24.0% rate — not tax advice; consult a CPA.
Schools (NCES district)
- District
- Palm Springs Unified
- NCES district ID
- 0629550
- Math proficiency
- 21% ▼ -7.00%
- Reading proficiency
- 42% ▬ 0.00%
- Median HH income
- $43,638
- Composite
- 26.76/100
- National rank
- #7131
- State rank
- #328 of 517 in CA
Livability — Cathedral City
- Score
- 66/100
- State rank
- #344
- US rank
- #11749
Category grades
Schools grade is shown separately in the Schools card above.
Census & demographics
- Census place
- Cathedral City, CA
- County
- Riverside County · 2,287,001 people
- City population
- 52,267
- Metro
- Riverside-San Bernardino-Ontario, CA
- Population (ZIP)
- 52,267
- Household income
- $73,572
- Rent vs Own
- Severe rent burden
- 1682.0
Population outlook (Riverside County) Hauer SSP2
- Today (2025)
- 2,664,475 people
- By 2030
- 2,802,692 · +5.2%
- By 2040
- 3,050,904 · +14.5%
- By 2050
- 3,256,783 · +22.2%
- By 2075
- 3,655,058 · +37.2%
- By 2100
- 3,766,594 · +41.4%
Race, ethnicity, and origin ACS 2023
- Neighborhood character
- Diverse neighborhood (Simpson 0.56)
- Race & ethnicity
- Hispanic / Latino 59% White 30% Two or more races 27% Asian 6% Native American 2% Black 2%
- Hispanic origin (detail)
- Mexican 51%
- Common ancestry
- Lithuanian 2% Romanian 1% Italian 1%
- Foreign-born
- 28% · Canada, Vietnam
- Languages at home
- 48% English-only · Spanish 46% Tagalog/Filipino 3% Other Asian/Pacific 1%
Political lean MEDSL · Riverside
- 2024 margin
- Toss-up / Even · D 48.0% · R 49.3% · Other 2.6%
- 2008→2024 swing
- -3.6pp toward R · 2008: 2.3pp · 2024: -1.3pp
- All cycles
- 2024: R+1.3 2020: D+8.0 2016: D+4.3 2012: R+0.4 2008: D+2.3
Not yet ingested
- Civics
- —
Market trends
- HPI YoY
- ▼ -136.57%
- Current HPI
- 356.9845
- Rent YoY
- ▲ 3.22%
- Metro
- Riverside-San Bernardino-Ontario, CA
- State GDP YoY
- ▲ 3.21%
- F500 in state
- 116
Industry mix (Fortune 500 HQ in CA)
| Industry | F500 HQs | Revenue |
|---|---|---|
| Technology | 27 | $1,492B |
|
||
| Financial Services | 3 | $174B |
|
||
| Retail | 3 | $44B |
|
||
| Insurance | 3 | $26B |
|
||
| Media / Entertainment | 2 | $115B |
|
||
| Pharmaceuticals / Biotech | 2 | $62B |
|
||
Price history
+265.0% since first listed10 events — show timeline
- 2026-05-11 Pending — GPSMLS
- 2026-04-24 Price Changed $219,000 GPSMLS
- 2026-04-13 Listed $223,000 GPSMLS
- 2004-07-20 Sold (Public Records) $140,000 Public Records
- 2004-07-20 Sold (Public Records) $140,000 Public Records
- 2004-06-08 Listing Removed — GPSMLS
- 2004-06-01 Listed $139,000 GPSMLS
- 2001-10-18 Listing Removed — GPSMLS
- 2001-07-07 Listed $75,000 GPSMLS
- 1986-09-12 Sold (Public Records) $60,000 Public Records
Property tax history
+3.0%/yrLatest (2025): $2,768 · -0.3% YoY. Source: county tax records.
Cash-flow waterfall
monthlySold comps — $/sqft
last 12 mo · ≤1 miLoading sold comps…