100 NW 16th #31 · Fruitland, ID
Flood risk 1/10 · Minimal
- FEMA flood zone
- —
- Chance of flooding over 30 yrs
- 0.0%
- Est. flood insurance / yr
- —
Fire risk 1/10 · Minimal
- Est. fire insurance / yr
- $584 – $1,086
Heat risk 5/10 · Moderate
- Hot days now (above 99°F)
- 7 days/yr
- Hot days in 30 yrs
- 19 days/yr
Wind risk 1/10 · Minimal
- Chance of severe wind over 30 yrs
- —
Air-quality risk 7/10 · Major
- Unhealthy air days now
- 10 days/yr
- Unhealthy air days in 30 yrs
- 12 days/yr
Risk factors via First Street. Map © Google.
Why this score? — see what drove the A- grade
The composite is a weighted blend of 9 inputs, each scored 0–100. Each bar is that input's sub-score; the figure is the points it added to the 100-point composite (weight × sub-score).
- Cash flow +30.0/30.0
- ARV discount +15.0/15.0
- 1% rule +10.0/10.0
- DSCR +10.0/10.0
- Appreciation +5.0/10.0
- Livability +3.6/5.0
- Schools +3.5/10.0
- Rent growth +2.5/5.0
- Condition / age +2.5/5.0
$75,000
🖨 Deal sheet 📄 Offer letter ✓ Due diligence
Listing remarks
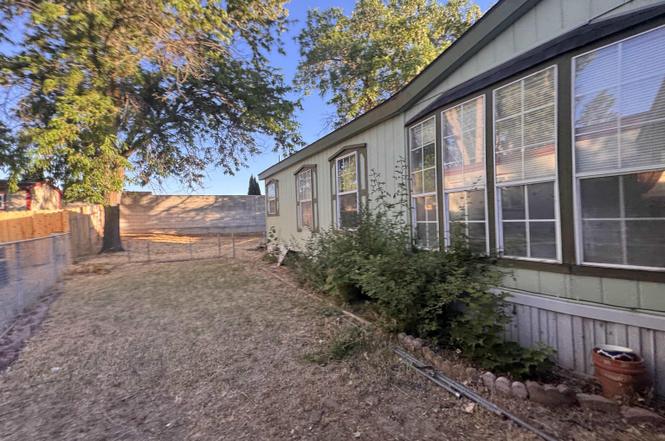
Spacious blank slate, ready for you to make it your own and gain equity! Large kitchen with breakfast nook, master suite with ensuite bath, formal dining room and living room with vaulted ceilings make this home flow wonderfully if you love to entertain or just want an open concept home to spread out. Split bedroom design boasts 3 additional bedrooms on the opposite end of the home from the master suite. The backyard backs to a tall privacy fence which allows for a great place to relax on the large covered deck. Space rent includes Water, Sewer and Garbage service. Home needs new flooring throughout.
Key facts
- Breakfast nook
- Master suite
- Formal dining room
Tags
Property features AI
Exterior
- Parking: Carport (covered) with 1 space; Total of 1 parking space
- Utilities: City water service; Sewer connected
- Home design: Mobile/manufactured home on a rented lot; Built in 1992; Accessible approach with ramp; Located in the Desert Rose subdivision
- Construction: Wood siding construction
- Exterior features: Partial metal fencing; Composition roof; Paved road access; Located in a mobile home park (current use)
Interior
- Kitchen: Freestanding oven/range
- Bedrooms: Four bedrooms, all on the main level
- Bathrooms: Two bathrooms
- Heating & cooling: Electric forced-air heating; Central air conditioning
- Interior features: Main-level master bedroom; Formal dining room; Laminate countertops
- Laundry & utility: Utility room on the main level; Electric water heater
Neighborhood map
What this means for you Summary
Snapshot
- This is a 4-bed/2.0-bath manufactured listed at $75k.
Deal economics
- At list price, monthly cash flow is $824 ($10k/yr) — positive.
- The deal already cash-flows at list — no discount required.
- Meets the 1% rule at list price ($2k rent vs $75k).
- Cap rate 19.5% vs local median 3.0% in Fruitland — top-decile yield for the area; either an underpriced asset or a hidden risk that comps aren't pricing in. Stress-test before assuming the spread holds.
Location & tenants
- Location reads 71/100 on livability (#51 in ID) — a middle-class / working-renter tenant base. Strengths: crime A+, cost of living A+, housing A+; Watch: employment C-, amenities F, commute F.
- Fruitland District (town): math 33% / reading 50% proficiency, ranked #60 of 92 in ID (top 65%) — families likely to look elsewhere, expect single-tenant / working-renter base with shorter leases.
- Zoned schools: Fruitland Elementary School (math 38% / reading 40%, grade F, #247 of 357 statewide, top 70%, 557 students, 45% FRL); Fruitland High School (math 27% / reading 62%, grade F, #61 of 169 statewide, top 41%, 542 students, 25% FRL) — zoned schools at 35% FRL track the district average.
- Market conditions: 3 active listings in the ZIP; 4 comparable units currently listed for rent nearby; rentals at typical pace (median 19d on market — plan ~3-4 weeks tenant-placement turnaround); 230 units permitted in Payette County in 2024 (0 in 5+ unit buildings).
Forward outlook
- In year one you build about $3k of equity ($519 loan paydown + $2k appreciation (3.0% local appreciation)).
- At projected returns (3.0% appreciation + 3.0% rent growth), your $21k cash investment doubles in ~2 years — after that, you're playing with house money.
Negotiation context
- Only 1 days on market — expect competitive offers; lowballing is unlikely to land.
- 2 sale attempts since 2y ago with the ask held roughly flat each time — persistent listings suggest the price (not the market) is what's stuck; bring a comps-based counter.
Risks & watch-outs
- Climate carrying-cost: extreme-heat days projected 7→19/yr by 2055 (HVAC capex compounding) — expect insurance premiums to compound above CPI over the hold.
Questions for the listing agent
- Is there a deadline driving the sale (1031 exchange, divorce, estate, relocation)? That informs how much negotiation room exists.
- Schools are D-rated, which usually means shorter tenancies and higher turnover. Who's the typical renter profile here, and what's been the actual vacancy rate?
- What's the average days-on-market for RENTAL listings here right now (not sales)? A rising rental-DOM trend means longer vacancies and softer asking-rent achievability than the comps imply.
- What's the recent tenant-quality profile in this submarket — average credit score on applications, eviction rate, late-payment / NSF rate, and stable-employment percentage? A property-management company in the area should have these aggregated.
- How much new for-sale + rental construction is in the pipeline within 1–3 miles? Heavy new supply typically softens prices + rents 12–24 months out; constrained supply supports both.
Investment metrics
- 1% rule
- 2.27% ✓
- Cap rate
- 19.48%
- Cash-on-cash
- 47.10%
- DSCR
- 3.10
- GRM
- 3.7
CMA / ARV
- ARV (on-the-fly)
- $123,984
- Comps found
- 3
Show comp detail 3 sales within ~0.75 mi
| Address | Dist | Beds/Ba | Sqft | Sold | Price | $/sf | Match |
|---|---|---|---|---|---|---|---|
| 100 NW 16th S #6 | 0.19mi | 3/2.0 (-1) | 1,539 (+2%) | 10mo | $139,900 | $91 | 75 |
| 100 NW 16th St #33 | 0.00mi | 3/2.0 (-1) | 1,728 (+14%) | 19mo | $110,000 | $64 | 55 |
| 916 Victoria | 0.65mi | 3/2.0 (-1) | 1,344 (-11%) | 2mo | $110,000 | $82 | 44 |
Match score weights: distance 35% · size 25% · config 20% · recency 20%. Top-matched comps best support the ARV.
Projected returns pro-forma
3.0% appreciation · 3.0% rent growth · sell at horizon
- IRR
- 52.3%
- Equity multiple
- 3.93×
- Total profit
- $61,560
- Equity at exit
- $33,723
- IRR
- 52.0%
- Equity multiple
- 7.93×
- Total profit
- $145,619
- Equity at exit
- $51,972
Cash invested: $21,000 (down + closing). Projections, not guarantees.
Landlord ↔ Tenant lean methodology
- Overall (STATE)
- 91 Strongly Landlord-Friendly
- State Idaho
- 91 Strongly Landlord-Friendly · R+18
- County
- — inherits STATE
- City
- — inherits STATE
ZIP-level market 83619-0000
- Active inventory
- 3
- Price-to-rent
- 3.7×
Monthly cashflow live
- Estimated rent
- $1,700 medium interval (Pro) →
- Mortgage (P&I)
- −$393
- Tax est. 1.5%
- −$94 /mo · $1,125/yr
- Insurance
- −$31
- HOA
- −$0
- Vacancy / Maint / Mgmt
- −$357
- Net cashflow
- $824
Break-even live
UW: 25.0% down · 7.5% · 30yr · 1.5% tax · 5.0% vac · 8.0% maint · 8.0% mgmt
Financing live
Cash to close
- Down payment
- $18,750
- Closing costs
- $2,250
- Reserves months
- —
- Total cash needed
- —
Loan-product check · same deal, 3 products live
Conventional
25% down · 7.5% · 30yr
- Down + closing
- —
- Monthly P&I
- —
- Monthly cashflow
- —
- DSCR
- —
- Eligible?
- —
Personal DTI + credit; lowest rate.
DSCR
20% down · 8.5% · 30yr
- Down + closing
- —
- Monthly P&I
- —
- Monthly cashflow
- —
- DSCR
- —
- Eligible?
- —
No personal income docs; deal must DSCR.
Hard money
10% down · 12.0% · 12mo
- Down + closing
- —
- Monthly P&I
- —
- Monthly cashflow
- —
- DSCR
- —
- Eligible?
- —
Short-term bridge; refi at stabilization.
Rent comps 4 comps
| Address | Beds | Baths | Sqft | Rent | $/sqft | DOM | Units | Dist |
|---|---|---|---|---|---|---|---|---|
| Orchid Ave Fruitland, ID | 4.0 | 2.0 | 1542 | $2,200 | $1.43 | 3d | 1 | 0.55mi |
| 909 Victoria Ave Fruitland, ID | 3.0 | 1.0 | 1152 | $700 | $0.61 | 19d | 1 | 0.65mi |
| 210 N Johnson Ave Fruitland, ID | 3.0 | 2.0 | 1450 | $1,700 | $1.17 | 3d | 1 | 0.72mi |
| 2509 Applewood Ave Fruitland, ID | 3.0 | 3.0 | 2046 | $2,100 | $1.03 | 23d | 1 | 1.04mi |
Listing history 2 events
-
2026-06-18remarks 607-char remark
-
2026-06-18$75,000 Active 1 DOM
ⓘ Source: listings_history table (triggers on properties + properties_extension) + one-shot
backfill from property_details.listing_events for pre-trigger history.
Climate risk First Street
- Flood 1/10 Low 0% chance over 30 yrs
- Wildfire 1/10 Low
- Heat 5/10 Major 7 d/yr ≥99°F today · 19 d/yr by 30 yrs out
- Wind 1/10 Low
- Air quality 7/10 Severe 10 unhealthy d/yr today · 12 by 30 yrs out
Nearby sold comps map
Loading sold comps map…
Walkable amenities ~0.75 mi
Loading nearby amenities…
Taxation est. · year 1
- Rental income
- $20,394
- − Mortgage interest
- −$4,201
- − Property taxes
- −$1,125
- − Insurance
- −$375
- − Repairs & maintenance
- −$1,632
- − Management
- −$1,632
- − Depreciation
- −$2,182
- Taxable income
- $9,248
- Est. tax owed @ 24.0%
- −$2,220
- After-tax cash flow
- $7,672/yr
For passive investors: Depreciation is non-cash, so a rental often shows a tax loss while cash-flowing — sheltering income. Rental losses are passive: they offset passive income freely, and up to $25,000/yr can offset ordinary (W-2) income if you actively participate and your MAGI is under $100k (phasing out to $0 by $150k); unused losses carry forward. On sale, claimed depreciation is recaptured at up to 25%, and gains may owe capital-gains tax (a 1031 exchange can defer both). Figures are a year-1 estimate at your 24.0% rate — not tax advice; consult a CPA.
Schools (NCES district)
- District
- Fruitland District
- NCES district ID
- 1601140
- Math proficiency
- 33% ▼ -8.00%
- Reading proficiency
- 50% ▼ -6.00%
- Median HH income
- $47,510
- Composite
- 35.43/100
- National rank
- #4933
- State rank
- #60 of 92 in ID
Livability — Fruitland
- Score
- 71/100
- State rank
- #51
- US rank
- #6760
Category grades
Schools grade is shown separately in the Schools card above.
Census & demographics
- Census place
- Fruitland, ID
Population outlook (Payette County) Hauer SSP2
- Today (2025)
- 23,392 people
- By 2030
- 23,523 · +0.6%
- By 2040
- 23,792 · +1.7%
- By 2050
- 24,002 · +2.6%
- By 2075
- 25,286 · +8.1%
- By 2100
- 26,673 · +14.0%
Not yet ingested
- Political lean
- —
- Race & ethnicity
- —
- Common origin
- —
- Civics
- —
Market trends
- HPI YoY
- —
- Current HPI
- —
- Rent YoY
- —
- Metro
- —
- State GDP YoY
- ▲ 4.51%
- F500 in state
- 6
Industry mix (Fortune 500 HQ in ID)
| Industry | F500 HQs | Revenue |
|---|---|---|
| Retail | 1 | $79B |
|
||
| Technology | 1 | $25B |
|
||
| Food / Agriculture | 1 | $6B |
|
||
Price history
+0.0% since first listed4 events — show timeline
- 2026-06-17 Listed $75,000 IMLS
- 2024-04-11 Listing Removed — IMLS
- 2024-03-28 Pending — IMLS
- 2024-03-22 Listed $75,000 IMLS
Cash-flow waterfall
monthlySold comps — $/sqft
last 12 mo · ≤1 miLoading sold comps…