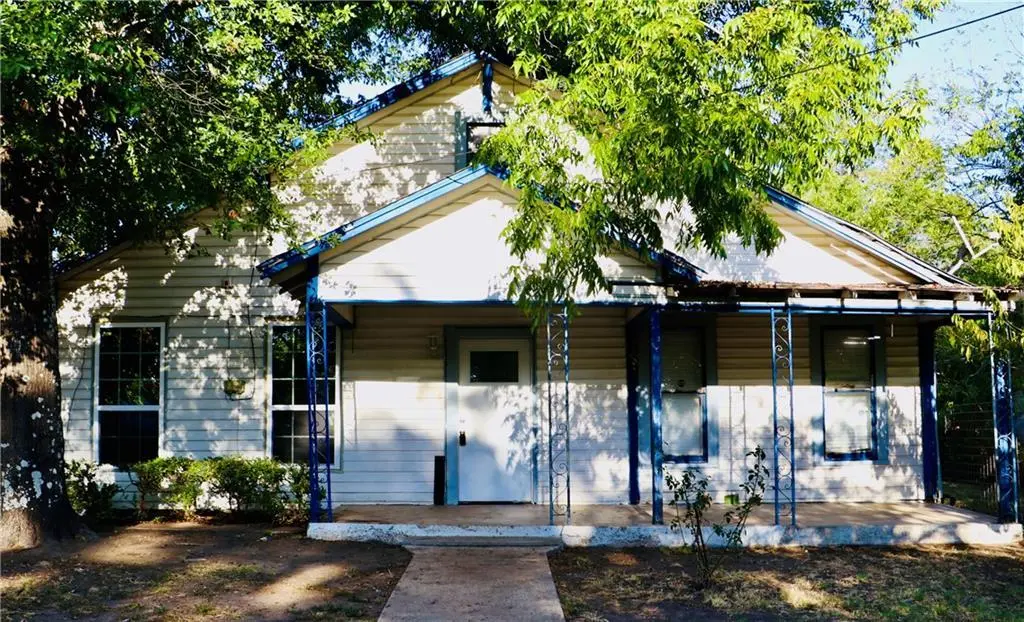
405 S Canton St · Mexia, TX
Flood risk 1/10 · Minimal
- FEMA flood zone
- X (unshaded)
- Chance of flooding over 30 yrs
- 0.0%
- Est. flood insurance / yr
- $507 – $1,088
Fire risk 6/10 · Moderate
- Est. fire insurance / yr
- $1,222 – $2,270
Heat risk 7/10 · Major
- Hot days now (above 111°F)
- 7 days/yr
- Hot days in 30 yrs
- 25 days/yr
Wind risk 6/10 · Moderate
- Chance of severe wind over 30 yrs
- 69.0%
Air-quality risk 1/10 · Minimal
- Unhealthy air days now
- 0 days/yr
- Unhealthy air days in 30 yrs
- 0 days/yr
Risk factors via First Street. Map © Google.
Why this score? — see what drove the B- grade
The composite is a weighted blend of 9 inputs, each scored 0–100. Each bar is that input's sub-score; the figure is the points it added to the 100-point composite (weight × sub-score).
- Cash flow +30.0/30.0
- 1% rule +10.0/10.0
- DSCR +10.0/10.0
- ARV discount +7.5/15.0
- Livability +3.4/5.0
- Rent growth +2.5/5.0
- Condition / age +2.5/5.0
- Schools +2.2/10.0
- Appreciation +0.0/10.0
$60,000
🖨 Deal sheet 📄 Offer letter ✓ Due diligence
Listing remarks MLS
Ready for your next project? Investor special or fixer upper home for a visionary buyer. It does need some TLC but the home has much potential with ideal location and beautiful neighborhood. This home is located 3 minutes from downtown, 3 minute walk to city park, 5 minute drive to HEB. This home is in an ideal location near historical homes. 3 bedroom 2 baths with a spacious living room and formal dinning area. The laundry room has it’s own area located in the house to create spacious a mud room and laundry site. Outside there is 2 storage units that are detached from the home.
Key facts
- Near shopping
- Near downtown
- Near major highways
Tags
Property features AI
Finance
- Other: Lot is approximately 0.193 acres (subdivided); Property type: Single family residence; Accessible: No
- Financial info: Listing terms: Cash or Conventional
- HOA & community: No association
Exterior
- Parking: Detached garage (1 car); Carport (1 space); Covered parking (1 space); Driveway; Circular driveway; Garage faces front
- Utilities: City water; City sewer; Electric service
- Home design: Single family residence; One story; Residential property; Subdivision: Crider Sub Div H
- Construction: Built in 1964; Siding exterior; Composition roof; Pillar/post/pier foundation
- Exterior features: Covered patio/porch; All-weather road access; City water and city sewer
Interior
- Kitchen: Electric range
- Bedrooms: 3 bedrooms (primary bedroom on main level)
- Flooring: Laminate flooring
- Bathrooms: 1 full bathroom
- Heating & cooling: Central heating (electric); Central air; Ceiling fans
- Interior features: Open floorplan; Eat-in kitchen; One living area; One dining area; Room count: 2
Neighborhood map
What this means for you Summary
Snapshot
- This is a 3-bed/1.0-bath single-family listed at $60k.
Deal economics
- At list price, monthly cash flow is $516 ($6k/yr) — positive.
- The deal already cash-flows at list — no discount required.
- Meets the 1% rule at list price ($1k rent vs $60k).
- Cap rate 16.6% vs local median 3.6% in Mexia — top-decile yield for the area; either an underpriced asset or a hidden risk that comps aren't pricing in. Stress-test before assuming the spread holds.
Location & tenants
- Location reads 68/100 on livability (#458 in TX) — a middle-class / working-renter tenant base. Strengths: cost of living A+, housing A+, health & safety B+; Watch: crime C-, amenities F, commute F.
- Mexia ISD (town): math 22% / reading 32% proficiency, ranked #696 of 826 in TX (top 84%) — low school quality limits family demand, transient renter base, plan for 1-2y turnover; 69% free/reduced lunch — lower-income household profile, screen leases tightly.
- Zoned schools: A B Mcbay El (527 students, 86% FRL) — zoned schools average 86% FRL vs 69% district-wide (18 pts higher); higher-poverty schools than district average — tighter screening recommended.
- Market conditions: 129 active listings in the ZIP; 17 units permitted in Limestone County in 2024 (0 in 5+ unit buildings).
Forward outlook
- Local home prices are declining (-3.0%/yr); year-one equity from $415 of loan paydown is wiped out by about $2k of value loss. Plan a longer hold.
- Limestone County population projected to shrink 4% by 2050 — rents likely to lag national; underwrite the cash flow, not the appreciation.
- At projected returns (-3.0% appreciation + 3.0% rent growth), your $17k cash investment doubles in ~4 years — after that, you're playing with house money.
Negotiation context
- Only 9 days on market — expect competitive offers; lowballing is unlikely to land.
- 2 sale attempts since 3y ago with the ask held roughly flat each time — persistent listings suggest the price (not the market) is what's stuck; bring a comps-based counter.
Risks & watch-outs
- Watch-outs: property tax is 3.2% of price.
- Climate carrying-cost: major wind risk, 69% chance of damaging wind over 30y; major wildfire risk; extreme-heat days projected 7→25/yr by 2055 (HVAC capex compounding) — expect insurance premiums to compound above CPI over the hold.
Questions for the listing agent
- Built in 1964 — when were the roof, HVAC, electrical panel, plumbing, and water heater last replaced?
- Property tax is high relative to price — has the assessment been appealed recently, and will the sale trigger a re-assessment?
- Is there a deadline driving the sale (1031 exchange, divorce, estate, relocation)? That informs how much negotiation room exists.
- Schools are F-rated, which usually means shorter tenancies and higher turnover. Who's the typical renter profile here, and what's been the actual vacancy rate?
- What's the average days-on-market for RENTAL listings here right now (not sales)? A rising rental-DOM trend means longer vacancies and softer asking-rent achievability than the comps imply.
- What's the recent tenant-quality profile in this submarket — average credit score on applications, eviction rate, late-payment / NSF rate, and stable-employment percentage? A property-management company in the area should have these aggregated.
- How much new for-sale + rental construction is in the pipeline within 1–3 miles? Heavy new supply typically softens prices + rents 12–24 months out; constrained supply supports both.
Investment metrics
- 1% rule
- 2.14% ✓
- Cap rate
- 16.62%
- Cash-on-cash
- 36.86%
- DSCR
- 2.64
- GRM
- 3.9
CMA / ARV
- ARV (on-the-fly)
- $150,336
- Comps found
- 8
Show comp detail 8 sales within ~0.75 mi
| Address | Dist | Beds/Ba | Sqft | Sold | Price | $/sf | Match |
|---|---|---|---|---|---|---|---|
| 203 S Red River St | 0.18mi | 2/1.0 (-1) | 1,218 (-6%) | 3mo | $110,000 | $90 | 74 |
| 805 E Palestine St | 0.39mi | 3/1.0 | 1,244 (-4%) | 4mo | $85,000 | $68 | 72 |
| 924 E Titus St | 0.40mi | 3/2.0 | 1,340 (+3%) | 1mo | $170,000 | $127 | 71 |
| 1005 E Evergreen St | 0.46mi | 3/2.0 | 1,316 (+2%) | 1mo | $84,999 | $65 | 71 |
| 504 E Bowie | 0.18mi | 3/2.0 | 1,350 (+4%) | 16mo | $215,000 | $159 | 67 |
| 1016 E Hopkins St | 0.52mi | 3/1.0 | 1,374 (+6%) | 14mo | $189,500 | $138 | 54 |
| 400 Travis NONE | 0.61mi | 4/1.5 (+1) | 1,405 (+8%) | 1mo | $99,000 | $70 | 50 |
| 206 E Tyler St | 0.41mi | 3/2.0 | 1,466 (+13%) | 12mo | $169,900 | $116 | 45 |
Match score weights: distance 35% · size 25% · config 20% · recency 20%. Top-matched comps best support the ARV.
Projected returns pro-forma
-3.0% appreciation · 3.0% rent growth · sell at horizon
- IRR
- 32.8%
- Equity multiple
- 2.38×
- Total profit
- $23,219
- Equity at exit
- $8,946
- IRR
- 39.8%
- Equity multiple
- 4.74×
- Total profit
- $62,833
- Equity at exit
- $5,188
Cash invested: $16,800 (down + closing). Projections, not guarantees.
Landlord ↔ Tenant lean methodology
- Overall (STATE)
- 87 Strongly Landlord-Friendly
- State Texas
- 87 Strongly Landlord-Friendly · R+5
- County
- — inherits STATE
- City
- — inherits STATE
ZIP-level market 76667
- Home prices YoY
- -8.9%
- Active inventory
- 129
- Price-to-rent
- 3.9×
Monthly cashflow live
- Estimated rent
- $1,284 medium interval (Pro) →
- Mortgage (P&I)
- −$315
- Tax from tax record
- −$158 /mo · $1,902/yr
- Insurance
- −$25
- HOA
- −$0
- Vacancy / Maint / Mgmt
- −$270
- Net cashflow
- $516
Break-even live
UW: 25.0% down · 7.5% · 30yr · 1.5% tax · 5.0% vac · 8.0% maint · 8.0% mgmt
Financing live
Cash to close
- Down payment
- $15,000
- Closing costs
- $1,800
- Reserves months
- —
- Total cash needed
- —
Loan-product check · same deal, 3 products live
Conventional
25% down · 7.5% · 30yr
- Down + closing
- —
- Monthly P&I
- —
- Monthly cashflow
- —
- DSCR
- —
- Eligible?
- —
Personal DTI + credit; lowest rate.
DSCR
20% down · 8.5% · 30yr
- Down + closing
- —
- Monthly P&I
- —
- Monthly cashflow
- —
- DSCR
- —
- Eligible?
- —
No personal income docs; deal must DSCR.
Hard money
10% down · 12.0% · 12mo
- Down + closing
- —
- Monthly P&I
- —
- Monthly cashflow
- —
- DSCR
- —
- Eligible?
- —
Short-term bridge; refi at stabilization.
Listing history 9 events
-
2026-06-18days on market $60,000 Active 9 DOM
-
2026-06-17days on market $60,000 Active 8 DOM
-
2026-06-16days on market $60,000 Active 7 DOM
-
2026-06-15days on market $60,000 Active 6 DOM
-
2026-06-15days on market $60,000 Active 5 DOM
-
2026-06-13days on market $60,000 Active 4 DOM
-
2026-06-12days on market $60,000 Active 3 DOM
-
2026-06-10remarks 203-char remark
-
2026-06-10$60,000 Active 1 DOM
ⓘ Source: listings_history table (triggers on properties + properties_extension) + one-shot
backfill from property_details.listing_events for pre-trigger history.
Tax reassessment forecast TX · Resets to sale price
- Current annual tax
- $1,902 · $158/mo
- Projected year-2 tax
- $1,902 · $158/mo
- Expected delta
- $0/yr ($0/mo · 0.0%)
ⓘ Screening estimate from a state-policy table — verify with the county assessor before closing.
Climate risk First Street
- Flood 1/10 Low FEMA zone X (unshaded) · 0% chance over 30 yrs
- Wildfire 6/10 Major
- Heat 7/10 Severe 7 d/yr ≥111°F today · 25 d/yr by 30 yrs out
- Wind 6/10 Major 69% chance of damaging wind over 30 yrs
- Air quality 1/10 Low 0 unhealthy d/yr today · 0 by 30 yrs out
Nearby sold comps map
Loading sold comps map…
Walkable amenities ~0.75 mi
Loading nearby amenities…
Taxation est. · year 1
- Rental income
- $15,406
- − Mortgage interest
- −$3,361
- − Property taxes
- −$1,902
- − Insurance
- −$300
- − Repairs & maintenance
- −$1,233
- − Management
- −$1,233
- − Depreciation
- −$1,745
- Taxable income
- $5,633
- Est. tax owed @ 24.0%
- −$1,352
- After-tax cash flow
- $4,841/yr
For passive investors: Depreciation is non-cash, so a rental often shows a tax loss while cash-flowing — sheltering income. Rental losses are passive: they offset passive income freely, and up to $25,000/yr can offset ordinary (W-2) income if you actively participate and your MAGI is under $100k (phasing out to $0 by $150k); unused losses carry forward. On sale, claimed depreciation is recaptured at up to 25%, and gains may owe capital-gains tax (a 1031 exchange can defer both). Figures are a year-1 estimate at your 24.0% rate — not tax advice; consult a CPA.
Schools (NCES district)
- District
- Mexia ISD
- NCES district ID
- 4830420
- Math proficiency
- 22% ▼ -10.00%
- Reading proficiency
- 32% ▬ 0.00%
- Median HH income
- $37,464
- Composite
- 22.48/100
- National rank
- #8101
- State rank
- #696 of 826 in TX
Livability — Mexia
- Score
- 68/100
- State rank
- #458
- US rank
- #9265
Category grades
Schools grade is shown separately in the Schools card above.
Census & demographics
- Census place
- Mexia, TX
- Population (ZIP)
- 10,494
Population outlook (Limestone County) Hauer SSP2
- Today (2025)
- 23,396 people
- By 2030
- 23,214 · -0.8%
- By 2040
- 22,829 · -2.4%
- By 2050
- 22,516 · -3.8%
- By 2075
- 22,088 · -5.6%
- By 2100
- 20,354 · -13.0%
Race, ethnicity, and origin ACS 2023
- Neighborhood character
- Diverse neighborhood (Simpson 0.67)
- Race & ethnicity
- White 45% Hispanic / Latino 29% Two or more races 24% Black 21%
- Hispanic origin (detail)
- Mexican 26%
- Common ancestry
- Serbian 3% Slovak 2% Italian 2%
- Foreign-born
- 11% · Canada
- Languages at home
- 77% English-only · Spanish 23%
Political lean MEDSL · Limestone
- 2024 margin
- Solid R (+56.9) · D 21.2% · R 78.1%
- 2008→2024 swing
- -23.4pp toward R · 2008: -33.5pp · 2024: -56.9pp
- All cycles
- 2024: R+56.9 2020: R+50.3 2016: R+52.3 2012: R+40.7 2008: R+33.5
Not yet ingested
- Civics
- —
Market trends
- HPI YoY
- ▼ -15.91%
- Current HPI
- 161.8191
- Rent YoY
- —
- Metro
- —
- State GDP YoY
- ▲ 3.95%
- F500 in state
- 110
Industry mix (Fortune 500 HQ in TX)
| Industry | F500 HQs | Revenue |
|---|---|---|
| Energy | 16 | $1,198B |
|
||
| Technology | 5 | $198B |
|
||
| Engineering / Construction | 4 | $72B |
|
||
| Energy Services | 3 | $60B |
|
||
| Utilities | 3 | $41B |
|
||
| Healthcare | 2 | $330B |
|
||
Price history
-20.0% since first listed6 events — show timeline
- 2026-06-09 Listed $60,000 NTREIS
- 2024-01-23 Sold (Public Records) — Public Records
- 2024-01-22 Sold (MLS) — NTREIS
- 2023-09-08 Listed $75,000 NTREIS
- 2001-08-08 Sold (Public Records) — Public Records
- 1999-11-17 Sold (Public Records) — Public Records
Property tax history
+9.5%/yrLatest (2025): $1,902 · +8.1% YoY. Source: county tax records.
Cash-flow waterfall
monthlySold comps — $/sqft
last 12 mo · ≤1 miLoading sold comps…