320 U.s. 84 · Sudan, TX
Flood risk 1/10 · Minimal
- FEMA flood zone
- —
- Chance of flooding over 30 yrs
- 0.0%
- Est. flood insurance / yr
- —
Fire risk 5/10 · Moderate
- Est. fire insurance / yr
- $1,222 – $2,270
Heat risk 4/10 · Minor
- Hot days now (above 98°F)
- 7 days/yr
- Hot days in 30 yrs
- 20 days/yr
Wind risk 2/10 · Minimal
- Chance of severe wind over 30 yrs
- 1.0%
Air-quality risk 1/10 · Minimal
- Unhealthy air days now
- 0 days/yr
- Unhealthy air days in 30 yrs
- 0 days/yr
Risk factors via First Street. Map © Google.
Why this score? — see what drove the D grade
The composite is a weighted blend of 9 inputs, each scored 0–100. Each bar is that input's sub-score; the figure is the points it added to the 100-point composite (weight × sub-score).
- Cash flow +11.6/30.0
- ARV discount +7.5/15.0
- Appreciation +5.4/10.0
- Schools +4.3/10.0
- DSCR +3.4/10.0
- Livability +3.1/5.0
- 1% rule +3.0/10.0
- Rent growth +2.5/5.0
- Condition / age +2.5/5.0
$155,000
🖨 Deal sheet (PDF) 📄 Offer letter ✓ Due diligence
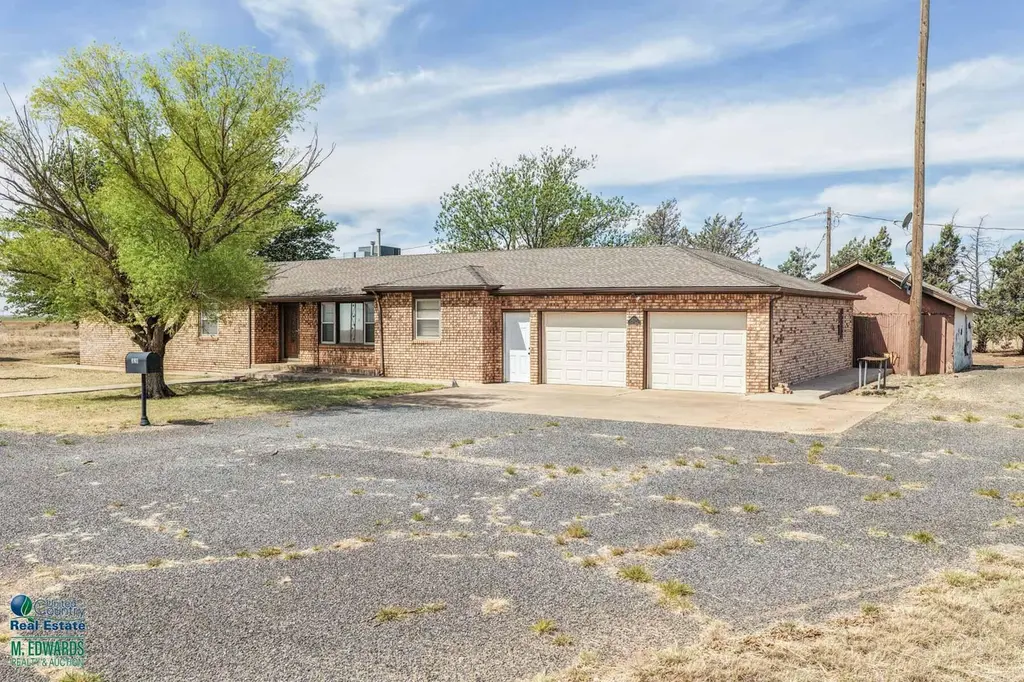
Listing remarks
Spacious 3-bedroom, 2-bath COUNTRY home situated on 5 acres offering privacy, space and endless potential, just outside of Sudan, TX on Hwy 84. This property is perfect for those seeking a peaceful rural lifestyle with room to grow! The home features a generous layout with a full basement and tons of storage. While it does need some repair and updating, this fixer-upper presents a fantastic opportunity to customize and create your dream home. You will all the space the living and dining areas provide making it perfect for entertaining! Other great features of the home include a spacious master, large laundry area and oversized garage! Outside, you wil find a detached carport for added cov
Key facts
- Expansive acreage
- Detached carport
- Full basement
Tags
Property features AI
Finance
- Other: 5-acre lot with paved road frontage on a highway; Back yard and front yard
- Financial info: Annual tax amount listed (financial details available)
Exterior
- Parking: Attached garage (oversized) with 2 garage spaces; Carport with 1 space; Garage faces front
- Utilities: Private well water; Water connected; Electricity connected; Cesspool sewer
- Home design: Single family residence; One story; Fixer condition
- Construction: Brick construction; Composition roof; Slab foundation; Built on 1 level
- Exterior features: Storage; Porch; Rear porch; Outbuilding
Interior
- Kitchen: Electric oven; Electric range
- Flooring: Carpet; Combination of flooring types
- Bathrooms: 2 full bathrooms
- Heating & cooling: Central heating; Central air; Ceiling fans for additional cooling
- Interior features: Bookcases; Ceiling fans; Window coverings; Unfinished concrete basement (has basement)
- Laundry & utility: Laundry room; Electric water heater
Neighborhood map
What this means for you Summary
Snapshot
- This is a 3-bed/2.0-bath single-family listed at $155k.
Deal economics
- At list price, monthly cash flow is $-48 ($-579/yr) — negative.
- To cash-flow at today's rent, offer at most $146k (5.5% below list).
- To meet the 1% rule (rent ≥ 1% of price), the offer needs to be $125k (19.6% below list).
- Recommended offer: $125k (19.6% below list) — sets the bar for 1% rule.
Location & tenants
- Location reads 61/100 on livability (#1,030 in TX) — a middle-class / working-renter tenant base. Strengths: cost of living A+, housing A+; Watch: health & safety C-, crime D, amenities F.
- Sudan ISD (rural): math 52% / reading 51% proficiency, ranked #171 of 826 in TX (top 21%) — acceptable for families but not a draw, mixed tenant base, ~2y average lease.
- Zoned schools: Sudan El (math 47% / reading 47%, grade D-, #1,006 of 4,322 statewide, top 25%, 294 students, 59% FRL); Sudan H S (math 62% / reading 57%, grade C+, #275 of 1,632 statewide, top 19%, 180 students, 44% FRL) — zoned schools at 52% FRL track the district average.
- Market conditions: 3 active listings in the ZIP.
Forward outlook
- In year one you build about $2k of equity ($1k loan paydown + $1k appreciation (0.7% local appreciation)).
- Lamb County population projected at -20% by 2050 — secular population decline; favor cash flow + early exit over multi-decade hold.
Negotiation context
- It's been on market 40 days — a 3% lower offer ($150k) is reasonable based on typical stale-listing flexibility.
Risks & watch-outs
- Climate carrying-cost: moderate wildfire risk — expect insurance premiums to compound above CPI over the hold.
Questions for the listing agent
- What do current leases actually rent for vs. the listed asking? Can we see a recent rent roll and the last 12 months of T-12 income?
- It's been on market 40 days. Have you received any prior offers? Is the seller open to a 20% concession, seller financing, or rate buy-down credit?
- Built in 1960 — when were the roof, HVAC, electrical panel, plumbing, and water heater last replaced?
- Is there a deadline driving the sale (1031 exchange, divorce, estate, relocation)? That informs how much negotiation room exists.
- Crime grade is D in this area — have there been break-ins, vandalism, or insurance claims at this property in the last 3 years? What carrier currently insures it and at what premium?
- The area grade is low — what's the realistic commute time and amenity access for the typical tenant pool here? Any planned neighborhood developments (good or bad) we should know about?
- What's the average days-on-market for RENTAL listings here right now (not sales)? A rising rental-DOM trend means longer vacancies and softer asking-rent achievability than the comps imply.
- What's the recent tenant-quality profile in this submarket — average credit score on applications, eviction rate, late-payment / NSF rate, and stable-employment percentage? A property-management company in the area should have these aggregated.
- How much new for-sale + rental construction is in the pipeline within 1–3 miles? Heavy new supply typically softens prices + rents 12–24 months out; constrained supply supports both.
Investment metrics
- 1% rule
- 0.80% ✗
- Cap rate
- 5.92%
- Cash-on-cash
- -1.33%
- DSCR
- 0.94
- GRM
- 10.4
CMA / ARV
No comps found within radius.
Projected returns pro-forma
0.72% appreciation · 3.0% rent growth · sell at horizon
- IRR
- -1.1%
- Equity multiple
- 0.95×
- Total profit
- $-2,300
- Equity at exit
- $50,659
- IRR
- 4.0%
- Equity multiple
- 1.47×
- Total profit
- $20,548
- Equity at exit
- $65,610
Cash invested: $43,400 (down + closing). Projections, not guarantees.
Landlord ↔ Tenant lean methodology
- Overall (STATE)
- 87 Strongly Landlord-Friendly
- State Texas
- 87 Strongly Landlord-Friendly · R+5
- County
- — inherits STATE
- City
- — inherits STATE
ZIP-level market 79371
- Home prices YoY
- 0.9%
- Active inventory
- 3
- Price-to-rent
- 10.4×
Monthly cashflow live
- Estimated rent
- $1,246 medium interval (Pro) →
- Mortgage (P&I)
- −$813
- Tax from tax record
- −$155 /mo · $1,862/yr
- Insurance
- −$65
- HOA
- −$0
- Vacancy / Maint / Mgmt
- −$262
- Net cashflow
- $-48
Break-even live
Sensitivity live
| Price | -10% $39 | -5% $-4 | +0% $-48 | +5% $-92 | +10% $-136 |
|---|---|---|---|---|---|
| Rent | -10% $-147 | -5% $-97 | +0% $-48 | +5% $1 | +10% $50 |
| Rate | -1.0pp $30 | -0.5pp $-9 | base $-48 | +0.5pp $-88 | +1.0pp $-129 |
UW: 25.0% down · 7.5% · 30yr · 1.5% tax · 5.0% vac · 8.0% maint · 8.0% mgmt
Financing live
Cash to close
- Down payment
- $38,750
- Closing costs
- $4,650
- Reserves months
- —
- Total cash needed
- —
Loan-product check · same deal, 3 products live
Conventional
25% down · 7.5% · 30yr
- Down + closing
- —
- Monthly P&I
- —
- Monthly cashflow
- —
- DSCR
- —
- Eligible?
- —
Personal DTI + credit; lowest rate.
DSCR
20% down · 8.5% · 30yr
- Down + closing
- —
- Monthly P&I
- —
- Monthly cashflow
- —
- DSCR
- —
- Eligible?
- —
No personal income docs; deal must DSCR.
Hard money
10% down · 12.0% · 12mo
- Down + closing
- —
- Monthly P&I
- —
- Monthly cashflow
- —
- DSCR
- —
- Eligible?
- —
Short-term bridge; refi at stabilization.
Listing history 19 events
-
2026-06-22days on market $155,000 Active 40 DOM
-
2026-06-21days on market $155,000 Active 39 DOM
-
2026-06-19days on market $155,000 Active 37 DOM
-
2026-06-18days on market $155,000 Active 36 DOM
-
2026-06-17days on market $155,000 Active 35 DOM
-
2026-06-16days on market $155,000 Active 34 DOM
-
2026-06-15days on market $155,000 Active 33 DOM
-
2026-06-14days on market $155,000 Active 31 DOM
-
2026-06-12days on market $155,000 Active 30 DOM
-
2026-06-09days on market $155,000 Active 27 DOM
-
2026-06-08days on market $155,000 Active 26 DOM
-
2026-06-07days on market $155,000 Active 25 DOM
-
2026-06-05days on market $155,000 Active 23 DOM
-
2026-06-04days on market $155,000 Active 21 DOM
-
2026-06-02days on market $155,000 Active 20 DOM
-
2026-06-01days on market $155,000 Active 19 DOM
-
2026-05-31days on market $155,000 Active 18 DOM
-
2026-05-31days on market $155,000 Active 17 DOM
-
2026-05-12$155,000 Active 948-char remark
ⓘ Source: listings_history table (triggers on properties + properties_extension) + one-shot
backfill from property_details.listing_events for pre-trigger history.
Tax reassessment forecast TX · Resets to sale price
- Current annual tax
- $1,862 · $155/mo
- Projected year-2 tax
- $2,836 · $236/mo
- Expected delta
- +$975/yr (+$81/mo · 52.3%)
ⓘ Screening estimate from a state-policy table — verify with the county assessor before closing.
Climate risk First Street
- Flood 1/10 Low 0% chance over 30 yrs
- Wildfire 5/10 Major
- Heat 4/10 Moderate 7 d/yr ≥98°F today · 20 d/yr by 30 yrs out
- Wind 2/10 Low 100% chance of damaging wind over 30 yrs
- Air quality 1/10 Low 0 unhealthy d/yr today · 0 by 30 yrs out
Nearby sold comps map
Loading sold comps map…
Walkable amenities ~0.75 mi
Loading nearby amenities…
Taxation est. · year 1
- Rental income
- $14,952
- − Mortgage interest
- −$8,682
- − Property taxes
- −$1,862
- − Insurance
- −$775
- − Repairs & maintenance
- −$1,196
- − Management
- −$1,196
- − Depreciation
- −$4,509
- Taxable loss
- −$3,269
- Est. tax savings @ 24.0%
- +$785
- After-tax cash flow
- $206/yr
For passive investors: Depreciation is non-cash, so a rental often shows a tax loss while cash-flowing — sheltering income. Rental losses are passive: they offset passive income freely, and up to $25,000/yr can offset ordinary (W-2) income if you actively participate and your MAGI is under $100k (phasing out to $0 by $150k); unused losses carry forward. On sale, claimed depreciation is recaptured at up to 25%, and gains may owe capital-gains tax (a 1031 exchange can defer both). Figures are a year-1 estimate at your 24.0% rate — not tax advice; consult a CPA.
Schools (NCES district)
- District
- Sudan ISD
- NCES district ID
- 4841760
- Math proficiency
- 52% ▼ -6.00%
- Reading proficiency
- 51% ▲ 4.00%
- Median HH income
- $42,137
- Composite
- 43.29/100
- National rank
- #3042
- State rank
- #171 of 826 in TX
Livability — Sudan
- Score
- 61/100
- State rank
- #1030
- US rank
- #18339
Category grades
Schools grade is shown separately in the Schools card above.
Census & demographics
- Population (ZIP)
- 1,464
Population outlook (Lamb County) Hauer SSP2
- Today (2025)
- 12,357 people
- By 2030
- 11,878 · -3.9%
- By 2040
- 10,950 · -11.4%
- By 2050
- 9,929 · -19.6%
- By 2075
- 7,355 · -40.5%
- By 2100
- 4,603 · -62.7%
Race, ethnicity, and origin ACS 2023
- Neighborhood character
- Diverse neighborhood (Simpson 0.57)
- Race & ethnicity
- White 47% Hispanic / Latino 46% Two or more races 8% Asian 3% Pacific Islander 2% Black 1%
- Hispanic origin (detail)
- Mexican 41%
- Common ancestry
- Slovak 1% Romanian 1% Lithuanian 1%
- Foreign-born
- 5% · Canada
- Languages at home
- 67% English-only · Spanish 32% Other Indo-European 1%
Political lean MEDSL · Lamb
- 2024 margin
- Solid R (+64.3) · D 17.6% · R 81.9%
- 2008→2024 swing
- -15.9pp toward R · 2008: -48.4pp · 2024: -64.3pp
- All cycles
- 2024: R+64.3 2020: R+60.8 2016: R+58.1 2012: R+50.3 2008: R+48.4
Not yet ingested
- Civics
- —
Market trends
- HPI YoY
- ▲ 0.72%
- Current HPI
- 84.4866
- Rent YoY
- —
- Metro
- —
- State GDP YoY
- ▲ 3.95%
- F500 in state
- 110
Industry mix (Fortune 500 HQ in TX)
| Industry | F500 HQs | Revenue |
|---|---|---|
| Energy | 16 | $1,198B |
|
||
| Technology | 5 | $198B |
|
||
| Engineering / Construction | 4 | $72B |
|
||
| Energy Services | 3 | $60B |
|
||
| Utilities | 3 | $41B |
|
||
| Healthcare | 2 | $330B |
|
||
Price history
1 event — show timeline
- 2026-05-12 Listed $155,000 LARMLS
Property tax history
+2.2%/yrLatest (2025): $1,862 · +11.9% YoY. Source: county tax records.
Cash-flow waterfall
monthlySold comps — $/sqft
last 12 mo · ≤1 miLoading sold comps…