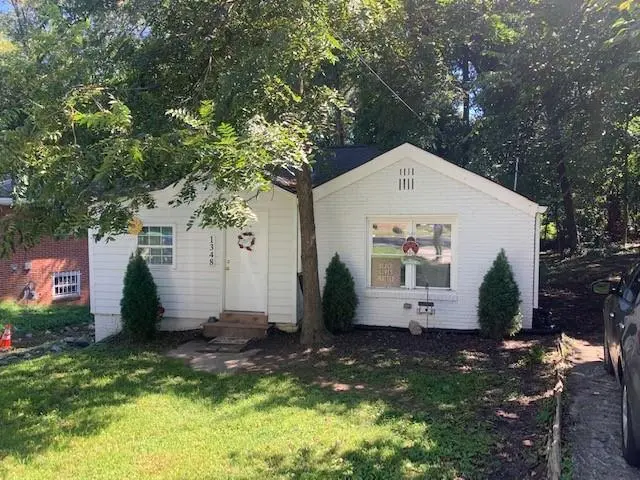
1348 Eason St NW · Atlanta, GA
Flood risk 1/10 · Minimal
- FEMA flood zone
- X (unshaded)
- Chance of flooding over 30 yrs
- 0.0%
- Est. flood insurance / yr
- $473 – $860
Fire risk 1/10 · Minimal
- Est. fire insurance / yr
- $963 – $1,789
Heat risk 5/10 · Moderate
- Hot days now (above 103°F)
- 7 days/yr
- Hot days in 30 yrs
- 16 days/yr
Wind risk 6/10 · Moderate
- Chance of severe wind over 30 yrs
- 27.0%
Air-quality risk 4/10 · Minor
- Unhealthy air days now
- 5 days/yr
- Unhealthy air days in 30 yrs
- 7 days/yr
Risk factors via First Street. Map © Google.
Why this score? — see what drove the C grade
The composite is a weighted blend of 9 inputs, each scored 0–100. Each bar is that input's sub-score; the figure is the points it added to the 100-point composite (weight × sub-score).
- Cash flow +18.2/30.0
- ARV discount +15.0/15.0
- DSCR +5.7/10.0
- 1% rule +5.2/10.0
- Livability +4.2/5.0
- Rent growth +3.1/5.0
- Schools +2.7/10.0
- Condition / age +2.5/5.0
- Appreciation +0.0/10.0
$154,500
🖨 Deal sheet 📄 Offer letter ✓ Due diligence
Listing remarks MLS
Charming brick ranch located just minutes from Mozley Park! This 3-bedroom, 2-bath home offers classic character with comfortable living space and great potential. The property features a traditional ranch layout with spacious bedrooms, ample natural light, and a functional floor plan ideal for both everyday living and entertaining. Enjoy the convenience of being close to downtown Atlanta, local parks, shopping, and dining while still having the feel of an established neighborhood. Whether you're a first-time homebuyer or an investor looking for a solid opportunity, this property offers plenty of possibilities.
Key facts
- Ample natural light
- Shopping
- Local parks
Tags
Neighborhood map
What this means for you Summary
Snapshot
- This is a 2-bed/1.0-bath single-family listed at $154k.
Deal economics
- At list price, monthly cash flow is $140 ($2k/yr) — positive.
- The deal already cash-flows at list — no discount required.
- Meets the 1% rule at list price ($2k rent vs $154k).
- Recommended offer: $145k (6.0% below list) — sets the bar for market timing.
- Cap rate 7.4% vs local median 3.1% in Atlanta — top-decile yield for the area; either an underpriced asset or a hidden risk that comps aren't pricing in. Stress-test before assuming the spread holds.
Location & tenants
- Location reads 83/100 on livability (#6 in GA, #919 nationally) — a professional / high-income tenant draw. Strengths: amenities A+, commute A+, housing A+; Watch: schools C-, cost of living C-.
- Atlanta Public Schools (urban): math 28% / reading 35% proficiency, ranked #80 of 174 in GA (top 46%) — families likely to look elsewhere, expect single-tenant / working-renter base with shorter leases; 71% free/reduced lunch — lower-income household profile, screen leases tightly.
- Market conditions: Rents rising (+2.5%/yr); 293 active listings in the ZIP; 40 comparable units currently listed for rent nearby; rentals at typical pace (median 24d on market — plan ~3-4 weeks tenant-placement turnaround); lower-income renter base — watch delinquency; 11,565 units permitted in Fulton County in 2024 (8,159 in 5+ unit buildings).
- At $1,580/mo this rent would consume 45% of the median local household income ($42k/yr) (locally 1293% of renters already pay >50% of income on rent) — very limited rent-growth headroom before tenants either downsize or default.
Forward outlook
- Local home prices are declining (-3.0%/yr); year-one equity from $1k of loan paydown is wiped out by about $5k of value loss. Plan a longer hold.
- Fulton County population projected at +38% by 2050 — long-run rental-demand tailwind backs the buy-and-hold thesis.
Negotiation context
- It's been on market 77 days — a 6% lower offer ($145k) is reasonable based on typical stale-listing flexibility.
- 14 sale attempts since 11y ago; this cycle's ask has dropped $30k (16%) from the opening price — seller is motivated, your offer sets the floor, not the list.
- Current owner paid $65k; list at $154k implies a 138% gain — meaningful room to come down on a strong offer.
Risks & watch-outs
- Watch-outs: built in 1944 — expect roof / HVAC / electrical / plumbing capex.
- Climate carrying-cost: major wind risk, 27% chance of damaging wind over 30y; extreme-heat days projected 7→16/yr by 2055 (HVAC capex compounding) — expect insurance premiums to compound above CPI over the hold.
Questions for the listing agent
- It's been on market 77 days. Have you received any prior offers? Is the seller open to a 6% concession, seller financing, or rate buy-down credit?
- Built in 1944 — when were the roof, HVAC, electrical panel, plumbing, and water heater last replaced?
- Why hasn't it sold? Are there any deal-killer items the seller is aware of (foundation, flood, title, zoning, code violations)?
- Is there a deadline driving the sale (1031 exchange, divorce, estate, relocation)? That informs how much negotiation room exists.
- What's the average days-on-market for RENTAL listings here right now (not sales)? A rising rental-DOM trend means longer vacancies and softer asking-rent achievability than the comps imply.
- What's the recent tenant-quality profile in this submarket — average credit score on applications, eviction rate, late-payment / NSF rate, and stable-employment percentage? A property-management company in the area should have these aggregated.
- How much new for-sale + rental construction is in the pipeline within 1–3 miles? Heavy new supply typically softens prices + rents 12–24 months out; constrained supply supports both.
Investment metrics
- 1% rule
- 1.02% ✓
- Cap rate
- 7.38%
- Cash-on-cash
- 3.88%
- DSCR
- 1.17
- GRM
- 8.2
CMA / ARV
- ARV (median comp)
- $224,249
- List price
- $154,500
- Delta
- -31.10%
- Verdict
- UNDERPRICED
- Comps
- 20 within 1.0 mi
Show comp detail 12 sales within ~0.75 mi
| Address | Dist | Beds/Ba | Sqft | Sold | Price | $/sf | Match |
|---|---|---|---|---|---|---|---|
| 227 Chappell Rd NW | 0.30mi | 3/1.0 (+1) | 1,097 (-1%) | 1mo | $185,000 | $169 | 78 |
| 1189 Gardenia St NW | 0.33mi | 3/2.0 (+1) | 1,156 (+4%) | 1mo | $340,000 | $294 | 68 |
| 70 Rockmart Dr NW | 0.11mi | 3/1.5 (+1) | 1,204 (+8%) | 9mo | $175,000 | $145 | 66 |
| 1131 Harwell St NW | 0.41mi | 3/2.0 (+1) | 1,136 (+2%) | 3mo | $300,000 | $264 | 66 |
| 142 Holly Dr NW | 0.38mi | 2/1.0 | 1,008 (-9%) | 4mo | $115,000 | $114 | 64 |
| 1165 Fair St SW | 0.65mi | 3/1.0 (+1) | 1,100 (-1%) | 8mo | $165,000 | $150 | 57 |
| 259 Stafford St NW | 0.54mi | 3/1.5 (+1) | 1,027 (-8%) | 9mo | $56,000 | $55 | 48 |
| 56 Gardenia Dr NW | 0.53mi | 3/1.0 (+1) | 1,221 (+10%) | 7mo | $110,000 | $90 | 47 |
| 195 Rosser St SW | 0.67mi | 3/2.0 (+1) | 1,014 (-9%) | 1mo | $250,000 | $247 | 45 |
| 1159 Fair St SW | 0.65mi | 3/3.0 (+1) | 1,023 (-8%) | 5mo | $170,000 | $166 | 40 |
| 1170 SW Fair St | 0.67mi | 3/2.0 (+1) | 1,254 (+13%) | 4mo | $265,000 | $211 | 35 |
| 1400 North Ave NW | 0.73mi | 3/2.0 (+1) | 1,228 (+11%) | 6mo | $270,000 | $220 | 34 |
Match score weights: distance 35% · size 25% · config 20% · recency 20%. Top-matched comps best support the ARV.
Projected returns pro-forma
-3.0% appreciation · 2.53% rent growth · sell at horizon
- IRR
- -10.7%
- Equity multiple
- 0.61×
- Total profit
- $-16,817
- Equity at exit
- $23,036
- IRR
- -2.1%
- Equity multiple
- 0.86×
- Total profit
- $-5,990
- Equity at exit
- $13,358
Cash invested: $43,260 (down + closing). Projections, not guarantees.
Landlord ↔ Tenant lean methodology
- Overall (STATE)
- 90 Strongly Landlord-Friendly
- State Georgia
- 90 Strongly Landlord-Friendly · R+3
- County
- — inherits STATE
- City
- — inherits STATE
ZIP-level market 30314
- Home prices YoY
- -22.9%
- Rents YoY
- 2.5%
- Active inventory
- 293
- Price-to-rent
- 8.2×
Monthly cashflow live
- Estimated rent
- $1,580 high interval (Pro) →
- Mortgage (P&I)
- −$810
- Tax from tax record
- −$233 /mo · $2,800/yr
- Insurance
- −$64
- HOA
- −$0
- Vacancy / Maint / Mgmt
- −$332
- Net cashflow
- $140
Break-even live
UW: 25.0% down · 7.5% · 30yr · 1.5% tax · 5.0% vac · 8.0% maint · 8.0% mgmt
Financing live
Cash to close
- Down payment
- $38,625
- Closing costs
- $4,635
- Reserves months
- —
- Total cash needed
- —
Loan-product check · same deal, 3 products live
Conventional
25% down · 7.5% · 30yr
- Down + closing
- —
- Monthly P&I
- —
- Monthly cashflow
- —
- DSCR
- —
- Eligible?
- —
Personal DTI + credit; lowest rate.
DSCR
20% down · 8.5% · 30yr
- Down + closing
- —
- Monthly P&I
- —
- Monthly cashflow
- —
- DSCR
- —
- Eligible?
- —
No personal income docs; deal must DSCR.
Hard money
10% down · 12.0% · 12mo
- Down + closing
- —
- Monthly P&I
- —
- Monthly cashflow
- —
- DSCR
- —
- Eligible?
- —
Short-term bridge; refi at stabilization.
Rent comps 40 comps
| Address | Beds | Baths | Sqft | Rent | $/sqft | DOM | Units | Dist |
|---|---|---|---|---|---|---|---|---|
| 1346 Eason St NW Atlanta, GA | 1.0 | 1.0 | 1321 | $694 | $0.53 | 24d | 1 | 0.02mi |
| 1332 Akridge St NW Atlanta, GA | 3.0 | 2.0 | 1400 | $1,775 | $1.27 | 24d | 1 | 0.07mi |
| 15 Chappell Rd NW Unit A Atlanta, GA | 1.0 | 1.0 | 700 | $940 | $1.34 | 5d | 1 | 0.13mi |
| 120 Burbank Dr NW Atlanta, GA | 3.0 | 2.0 | 1331 | $1,795 | $1.35 | 24d | 1 | 0.17mi |
| 1338 Sharon St NW Atlanta, GA | 2.0 | 1.0 | 800 | $1,600 | $2.00 | 19d | 1 | 0.18mi |
| 1336 Sharon St NW Atlanta, GA | 2.0 | 1.0 | 800 | $1,450 | $1.81 | 24d | 1 | 0.19mi |
| 10 Rockmart Dr NW Atlanta, GA | 1.0 | 1.0 | 784 | $1,450 | $1.85 | 14d | 1 | 0.20mi |
| 5 Burbank Dr SW Unit B Atlanta, GA | 2.0 | 1.0 | 1000 | $1,300 | $1.30 | 16d | 1 | 0.26mi |
| 15 Burbank Dr SW Unit 3 Atlanta, GA | 2.0 | 1.0 | 900 | $1,350 | $1.50 | 10d | 1 | 0.27mi |
| 10 Rockmart Dr SW Atlanta, GA | 1.0 | 1.0 | 784 | $1,450 | $1.85 | 14d | 1 | 0.28mi |
| 1441 Andrews St NW Unit 2 Atlanta, GA | 1.0 | 1.0 | 950 | $795 | $0.84 | 7d | 1 | 0.30mi |
| 39 Holly Rd NW Atlanta, GA | 1.0 | 1.0 | 1120 | $970 | $0.87 | 7d | 1 | 0.33mi |
| 39 Holly Rd NW Atlanta, GA | 1.0 | 1.0 | 1120 | $775 | $0.69 | 24d | 1 | 0.33mi |
| 1448 Rome Dr NW Unit 1448 Atlanta, GA | 3.0 | 2.5 | 1400 | $2,300 | $1.64 | 12d | 1 | 0.45mi |
| 245 Stafford St NW Unit A Atlanta, GA | 2.0 | 1.0 | 784 | $1,300 | $1.66 | 24d | 1 | 0.53mi |
| 280 Holly Rd NW Unit B Atlanta, GA | 2.0 | 2.0 | 1100 | $1,650 | $1.50 | 24d | 1 | 0.54mi |
| 155 Rosser St SW Atlanta, GA | 3.0 | 2.0 | 1500 | $2,073 | $1.38 | 24d | 1 | 0.62mi |
| 139 Lawton St SW Atlanta, GA | 2.0 | 1.0 | 750 | $995 | $1.33 | 24d | 1 | 0.65mi |
| 399 Holly St NW Unit 6 Atlanta, GA | 2.0 | 1.0 | 775 | $1,500 | $1.94 | 18d | 1 | 0.69mi |
| 195 W Lake Ave NW Unit 1 Atlanta, GA | 3.0 | 2.0 | 1245 | $2,654 | $2.13 | 24d | 1 | 0.69mi |
| 176 Racine St SW Atlanta, GA | 3.0 | 2.0 | 1423 | $2,800 | $1.97 | 24d | 1 | 0.69mi |
| 371 Lanier St NW #1 Atlanta, GA | 2.0 | 1.0 | 700 | $1,250 | $1.79 | 7d | 1 | 0.72mi |
| 1201 Westview Dr SW Atlanta, GA | 3.0 | 2.0 | 1040 | $2,050 | $1.97 | 24d | 1 | 0.72mi |
| 0 W Lake Ave NW Atlanta, GA | 3.0 | 2.5 | 1300 | $1,900 | $1.46 | 1d | 1 | 0.74mi |
| 427 Holly St NW Atlanta, GA | 2.0 | 2.0 | 900 | $2,100 | $2.33 | 24d | 1 | 0.74mi |
| 1770 Springview Rd NW Atlanta, GA | 3.0 | 2.0 | 1262 | $2,000 | $1.58 | 24d | 1 | 0.79mi |
| 1595 Carlisle St NW Unit 1 Atlanta, GA | 2.0 | 1.0 | 900 | $1,200 | $1.33 | 24d | 1 | 0.79mi |
| 2111 Martin Luther King Junior Dr NW Atlanta, GA | 3.0 | 1.0 | 1470 | $1,800 | $1.22 | 24d | 1 | 0.79mi |
| 956 Mayson Turner Rd NW Atlanta, GA | 1.0 | 1.0 | 1300 | $625 | $0.48 | 12d | 1 | 0.79mi |
| 936 Mayson Turner Rd NW Atlanta, GA | 3.0 | 1.0–2.0 | 648 | $1,420 | $2.19 | 1d | 13 | 0.80mi |
| 1097 Westview Dr SW Unit 10 Atlanta, GA | 2.0 | 1.0 | 750 | $1,095 | $1.46 | 24d | 1 | 0.82mi |
| 945 Palmetto Ave SW Atlanta, GA | 3.0 | 2.0 | 1200 | $3,500 | $2.92 | 24d | 1 | 0.85mi |
| 240 Whitaker Cir NW Atlanta, GA | 1.0 | 1.0 | 1414 | $685 | $0.48 | 17d | 1 | 0.85mi |
| 240 Whitaker Cir NW Atlanta, GA | 1.0 | 1.0 | 1414 | $665 | $0.47 | 5d | 1 | 0.85mi |
| 379 Atwood St SW Unit 4 Atlanta, GA | 2.0 | 1.0 | 800 | $1,800 | $2.25 | 24d | 1 | 0.87mi |
| 1824 Tiger Flowers Dr NW Atlanta, GA | 1.0 | 1.0 | 1400 | $925 | $0.66 | 24d | 1 | 0.87mi |
| 390 W Lake Ave NW Unit B9 Atlanta, GA | 2.0 | 1.5 | 1256 | $1,275 | $1.02 | 24d | 1 | 0.87mi |
| 390 W Lake Ave NW Apt A1 Atlanta, GA | 3.0 | 1.5 | 1256 | $1,299 | $1.03 | 24d | 1 | 0.87mi |
| 390 W Lake Ave NW Unit A10 Atlanta, GA | 3.0 | 1.5 | 1256 | $1,275 | $1.02 | 24d | 1 | 0.87mi |
| 870 Mayson Turner Rd NW #1442 Atlanta, GA | 2.0 | 2.0 | 1094 | $2,100 | $1.92 | 24d | 1 | 0.88mi |
Listing history 50 events
-
2026-06-13statusdays on market $154,500 Pending 77 DOM
-
2026-06-13days on market $154,500 Active 154 DOM
-
2026-06-09days on market $154,500 Active 151 DOM
-
2026-06-08days on market $154,500 Active 150 DOM
-
2026-06-07days on market $154,500 Active 149 DOM
-
2026-06-04days on market $154,500 Active 146 DOM
-
2026-06-03days on market $154,500 Active 145 DOM
-
2026-06-02days on market $154,500 Active 144 DOM
-
2026-06-01days on market $154,500 Active 143 DOM
-
2026-05-31days on market $154,500 Active 77 DOM
-
2026-04-28price $169,900 618-char remark
Show marketing remark (618 chars)
Charming brick ranch located just minutes from Mozley Park! This 3-bedroom, 2-bath home offers classic character with comfortable living space and great potential. The property features a traditional ranch layout with spacious bedrooms, ample natural light, and a functional floor plan ideal for both everyday living and entertaining. Enjoy the convenience of being close to downtown Atlanta, local parks, shopping, and dining while still having the feel of an established neighborhood. Whether you're a first-time homebuyer or an investor looking for a solid opportunity, this property offers plenty of possibilities.
-
2026-04-02status Back On Market 184-char remark
Show marketing remark (184 chars)
Fantastic investment opportunity! This remodeled 3 bedroom, 2 bathroom detached home near Mozley Park. Tastefully updated in 2021, this home offers modern comforts and long-term value.
-
2026-03-31historical 184-char remark
Show marketing remark (184 chars)
Fantastic investment opportunity! This remodeled 3 bedroom, 2 bathroom detached home near Mozley Park. Tastefully updated in 2021, this home offers modern comforts and long-term value.
-
2026-03-29price $179,900 618-char remark
Show marketing remark (618 chars)
Charming brick ranch located just minutes from Mozley Park! This 3-bedroom, 2-bath home offers classic character with comfortable living space and great potential. The property features a traditional ranch layout with spacious bedrooms, ample natural light, and a functional floor plan ideal for both everyday living and entertaining. Enjoy the convenience of being close to downtown Atlanta, local parks, shopping, and dining while still having the feel of an established neighborhood. Whether you're a first-time homebuyer or an investor looking for a solid opportunity, this property offers plenty of possibilities.
-
2026-03-15$185,000 Active 618-char remark
Show marketing remark (618 chars)
Charming brick ranch located just minutes from Mozley Park! This 3-bedroom, 2-bath home offers classic character with comfortable living space and great potential. The property features a traditional ranch layout with spacious bedrooms, ample natural light, and a functional floor plan ideal for both everyday living and entertaining. Enjoy the convenience of being close to downtown Atlanta, local parks, shopping, and dining while still having the feel of an established neighborhood. Whether you're a first-time homebuyer or an investor looking for a solid opportunity, this property offers plenty of possibilities.
-
2026-03-01status Active
-
2026-02-28historical
-
2026-02-01status Back On Market 184-char remark
Show marketing remark (184 chars)
Fantastic investment opportunity! This remodeled 3 bedroom, 2 bathroom detached home near Mozley Park. Tastefully updated in 2021, this home offers modern comforts and long-term value.
-
2026-01-31historical 184-char remark
Show marketing remark (184 chars)
Fantastic investment opportunity! This remodeled 3 bedroom, 2 bathroom detached home near Mozley Park. Tastefully updated in 2021, this home offers modern comforts and long-term value.
-
2026-01-16status Active
-
2026-01-16status Pending
-
2026-01-15historical Active Under Contract
-
2026-01-07$185,000 New 184-char remark
Show marketing remark (184 chars)
Fantastic investment opportunity! This remodeled 3 bedroom, 2 bathroom detached home near Mozley Park. Tastefully updated in 2021, this home offers modern comforts and long-term value.
-
2026-01-01status Active
-
2025-12-31historical
-
2025-12-31historical
-
2025-12-01price $185,000
-
2025-10-20$194,000 Active
-
2025-10-20$194,000 New
-
2019-07-11soldstatus $65,000 Closed
-
2019-06-12status Pending
-
2019-05-18status Active
-
2019-05-17historical
-
2019-04-18price $84,900
-
2019-04-11$94,900 Active
-
2016-05-20status Under Contract
-
2015-09-09status Under Contract
-
2015-09-08historical
-
2015-08-31$23,000 New
-
2015-08-27historical
-
2015-05-26$23,000 New
-
2015-05-21historical
-
2015-04-23price $23,000
-
2015-04-03price $25,000
-
2015-04-03price $25,900
-
2015-02-18$29,900 New
-
2006-08-16soldstatus $76,500
-
2005-07-13soldstatus $159,000
-
2003-10-07soldstatus $142,500
-
1976-08-12soldstatus $11,000
ⓘ Source: listings_history table (triggers on properties + properties_extension) + one-shot
backfill from property_details.listing_events for pre-trigger history.
Tax reassessment forecast GA · Resets to sale price
- Current annual tax
- $2,800 · $233/mo
- Projected year-2 tax
- $2,800 · $233/mo
- Expected delta
- $0/yr ($0/mo · 0.0%)
ⓘ Screening estimate from a state-policy table — verify with the county assessor before closing.
Climate risk First Street
- Flood 1/10 Low FEMA zone X (unshaded) · 0% chance over 30 yrs
- Wildfire 1/10 Low
- Heat 5/10 Major 7 d/yr ≥103°F today · 16 d/yr by 30 yrs out
- Wind 6/10 Major 27% chance of damaging wind over 30 yrs
- Air quality 4/10 Moderate 5 unhealthy d/yr today · 7 by 30 yrs out
Nearby sold comps map
Loading sold comps map…
Walkable amenities ~0.75 mi
Loading nearby amenities…
Taxation est. · year 1
- Rental income
- $18,956
- − Mortgage interest
- −$8,654
- − Property taxes
- −$2,800
- − Insurance
- −$772
- − Repairs & maintenance
- −$1,516
- − Management
- −$1,516
- − Depreciation
- −$4,495
- Taxable loss
- −$799
- Est. tax savings @ 24.0%
- +$192
- After-tax cash flow
- $1,871/yr
For passive investors: Depreciation is non-cash, so a rental often shows a tax loss while cash-flowing — sheltering income. Rental losses are passive: they offset passive income freely, and up to $25,000/yr can offset ordinary (W-2) income if you actively participate and your MAGI is under $100k (phasing out to $0 by $150k); unused losses carry forward. On sale, claimed depreciation is recaptured at up to 25%, and gains may owe capital-gains tax (a 1031 exchange can defer both). Figures are a year-1 estimate at your 24.0% rate — not tax advice; consult a CPA.
Schools (NCES district)
- District
- Atlanta Public Schools
- NCES district ID
- 1300120
- Math proficiency
- 28% ▼ -6.00%
- Reading proficiency
- 35% ▼ -2.00%
- Median HH income
- $48,306
- Composite
- 27.27/100
- National rank
- #7006
- State rank
- #80 of 174 in GA
Livability — Atlanta
- Score
- 83/100
- State rank
- #6
- US rank
- #919
Category grades
Schools grade is shown separately in the Schools card above.
Census & demographics
- Census place
- Atlanta, GA
- County
- Fulton County · 1,094,430 people
- City population
- 629,525
- Metro
- Atlanta-Sandy Springs-Alpharetta, GA
- Population (ZIP)
- 23,333
- Household income
- $42,089
- Rent vs Own
- Severe rent burden
- 1293.0
Population outlook (Fulton County) Hauer SSP2
- Today (2025)
- 1,203,707 people
- By 2030
- 1,299,706 · +8.0%
- By 2040
- 1,488,256 · +23.6%
- By 2050
- 1,664,580 · +38.3%
- By 2075
- 2,036,072 · +69.2%
- By 2100
- 2,222,402 · +84.6%
Race, ethnicity, and origin ACS 2023
- Neighborhood character
- Predominantly Black (76%)
- Race & ethnicity
- Black 76% White 11% Hispanic / Latino 7% Asian 4% Two or more races 3%
- Hispanic origin (detail)
- Mexican 4% Dominican 1%
- Common ancestry
- Lithuanian 1%
- Foreign-born
- 6% · Canada, China, South Korea
- Languages at home
- 89% English-only · Spanish 5% Other Indo-European 1% Chinese 1%
Political lean MEDSL · Fulton
- 2024 margin
- Solid D (+44.9) · D 71.9% · R 27.0% · Other 1.1%
- 2008→2024 swing
- +9.8pp toward D · 2008: 35.0pp · 2024: 44.9pp
- All cycles
- 2024: D+44.9 2020: D+46.4 2016: D+42.1 2012: D+29.6 2008: D+35.0
Not yet ingested
- Civics
- —
Market trends
- HPI YoY
- ▼ -95.32%
- Current HPI
- 321.4626
- Rent YoY
- ▲ 2.53%
- Metro
- Atlanta-Sandy Springs-Alpharetta, GA
- State GDP YoY
- ▲ 2.66%
- F500 in state
- 28
Industry mix (Fortune 500 HQ in GA)
| Industry | F500 HQs | Revenue |
|---|---|---|
| Paper / Packaging | 2 | $29B |
|
||
| Retail | 1 | $160B |
|
||
| Transportation / Logistics | 1 | $91B |
|
||
| Airlines | 1 | $62B |
|
||
| Consumer Goods | 1 | $47B |
|
||
| Utilities | 1 | $25B |
|
||
Price history
+1669.8% since first listed41 events — show timeline
- 2026-04-28 Price Changed $169,900 FMLS
- 2026-04-02 Relisted — GAMLS
- 2026-03-31 Listing Removed — GAMLS
- 2026-03-29 Price Changed $179,900 FMLS
- 2026-03-15 Listed $185,000 FMLS
- 2026-03-01 Relisted — FMLS
- 2026-02-28 Listing Removed — FMLS
- 2026-02-01 Relisted — GAMLS
- 2026-01-31 Listing Removed — GAMLS
- 2026-01-16 Relisted — FMLS
- 2026-01-16 Pending — FMLS
- 2026-01-15 Contingent — FMLS
- 2026-01-07 Listed $185,000 GAMLS
- 2026-01-01 Relisted — FMLS
- 2025-12-31 Listing Removed — GAMLS
- 2025-12-31 Listing Removed — FMLS
- 2025-12-01 Price Changed $185,000 FMLS
- 2025-10-20 Listed $194,000 GAMLS
- 2025-10-20 Listed $194,000 FMLS
- 2019-07-11 Sold (MLS) $65,000 FMLS
- 2019-06-12 Pending — FMLS
- 2019-05-18 Relisted — FMLS
- 2019-05-17 Listing Removed — FMLS
- 2019-04-18 Price Changed $84,900 FMLS
- 2019-04-11 Listed $94,900 FMLS
- 2016-05-20 Pending — GAMLS
- 2015-09-09 Pending — GAMLS
- 2015-09-08 Listing Removed — GAMLS
- 2015-08-31 Listed $23,000 GAMLS
- 2015-08-27 Listing Removed — GAMLS
- 2015-05-26 Listed $23,000 GAMLS
- 2015-05-21 Listing Removed — GAMLS
- 2015-04-23 Price Changed $23,000 GAMLS
- 2015-04-03 Price Changed $25,000 GAMLS
- 2015-04-03 Price Changed $25,900 GAMLS
- 2015-02-18 Listed $29,900 GAMLS
- 2006-08-16 Sold (Public Records) $76,500 Public Records
- 2005-07-13 Sold (Public Records) $159,000 Public Records
- 2003-10-07 Sold (Public Records) $142,500 Public Records
- 1976-08-12 Sold (Public Records) $11,000 Public Records
- 1976-07-01 Sold (Public Records) $9,600 Public Records
Property tax history
+5.0%/yrLatest (2024): $2,800 · -0.0% YoY. Source: county tax records.
Cash-flow waterfall
monthlySold comps — $/sqft
last 12 mo · ≤1 miLoading sold comps…