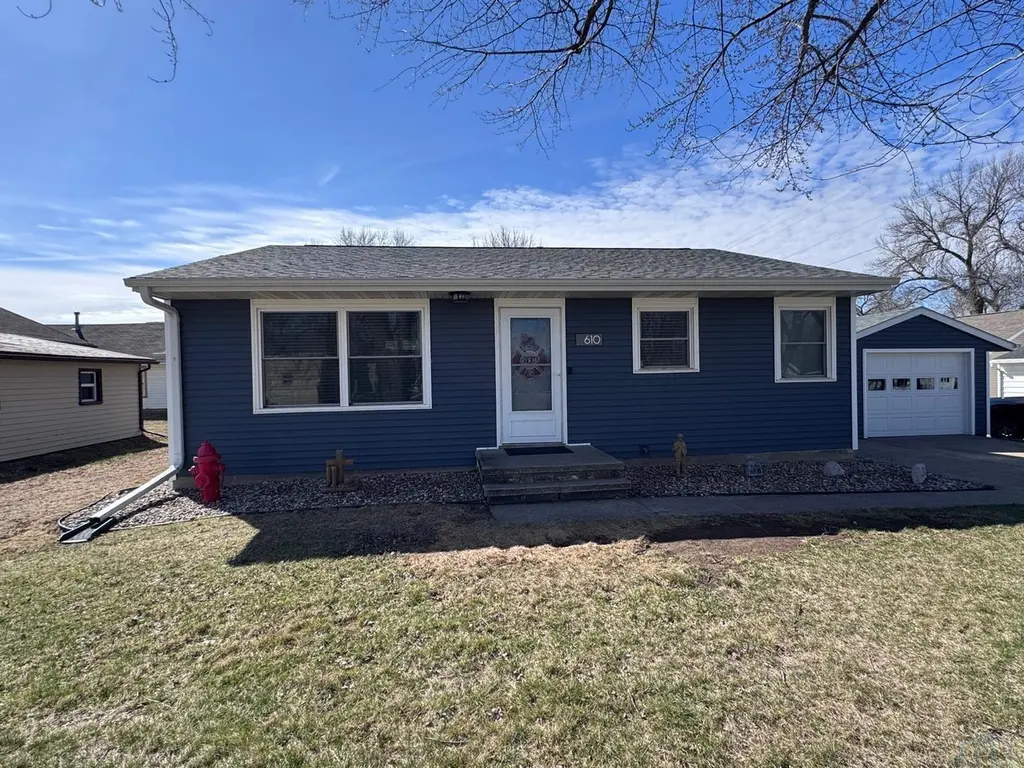
610 4th St St SW · Le Mars, IA
Flood risk 1/10 · Minimal
- FEMA flood zone
- X (unshaded)
- Chance of flooding over 30 yrs
- 0.0%
- Est. flood insurance / yr
- $473 – $860
Fire risk 1/10 · Minimal
- Est. fire insurance / yr
- $902 – $1,676
Heat risk 3/10 · Minor
- Hot days now (above 103°F)
- 7 days/yr
- Hot days in 30 yrs
- 15 days/yr
Wind risk 2/10 · Minimal
- Chance of severe wind over 30 yrs
- —
Air-quality risk 2/10 · Minimal
- Unhealthy air days now
- 1 days/yr
- Unhealthy air days in 30 yrs
- 1 days/yr
Risk factors via First Street. Map © Google.
Why this score? — see what drove the D- grade
The composite is a weighted blend of 9 inputs, each scored 0–100. Each bar is that input's sub-score; the figure is the points it added to the 100-point composite (weight × sub-score).
- Cash flow +12.9/30.0
- Schools +6.2/10.0
- Livability +4.1/5.0
- DSCR +3.9/10.0
- 1% rule +3.0/10.0
- Rent growth +2.5/5.0
- Condition / age +2.5/5.0
- ARV discount +0.0/15.0
- Appreciation +0.0/10.0
$215,000
🖨 Deal sheet (PDF) 📄 Offer letter ✓ Due diligence
Listing remarks
3 bed 1 bath ranch home with detached garage, alley access and off street parking. This home has original wood flooring and all the updates. .. 2018~new roof, siding, windows, gutters with screens~ 2019 new flooring, countertops, backsplash and sink in kitchen. SO MANY UPDATES!!! Ask for the complete list!
Key facts
- New siding
- New flooring
- New gutters
Tags
Neighborhood map
What this means for you Summary
Snapshot
- This is a 3-bed/1.0-bath single-family listed at $215k.
Deal economics
- At list price, monthly cash flow is $-17 ($-198/yr) — negative.
- To cash-flow at today's rent, offer at most $212k (1.4% below list).
- To meet the 1% rule (rent ≥ 1% of price), the offer needs to be $171k (20.3% below list).
- Recommended offer: $171k (20.3% below list) — sets the bar for 1% rule.
- Cap rate 6.2% vs local median 2.7% in Le Mars — top-decile yield for the area; either an underpriced asset or a hidden risk that comps aren't pricing in. Stress-test before assuming the spread holds.
Location & tenants
- Location reads 82/100 on livability (#48 in IA, #1,235 nationally) — a professional / high-income tenant draw. Strengths: crime A+, cost of living A+, housing A+; Watch: amenities F, commute F.
- Le Mars Community School District (town): math 73% / reading 72% proficiency, ranked #96 of 289 in IA (top 33%) — strong family-tenant draw, lease renewals of 3-5y typical.
- Zoned schools: Kluckhohn Elementary School (math 76% / reading 76%, grade A, #123 of 616 statewide, top 20%, 439 students, 35% FRL); Le Mars Middle School (math 71% / reading 71%, grade A, #110 of 246 statewide, top 44%, 488 students, 38% FRL); Le Mars High School (math 73% / reading 75%, grade B+, #103 of 336 statewide, top 32%, 675 students, 30% FRL).
- Market conditions: 59 active listings in the ZIP; 1 comparable units currently listed for rent nearby; 147 units permitted in Plymouth County in 2024 (112 in 5+ unit buildings).
Forward outlook
- Local home prices are declining (-3.0%/yr); year-one equity from $1k of loan paydown is wiped out by about $6k of value loss. Plan a longer hold.
Negotiation context
- Only 7 days on market — expect competitive offers; lowballing is unlikely to land.
- Current owner paid $85k; list at $215k implies a 153% gain — meaningful room to come down on a strong offer.
Questions for the listing agent
- What do current leases actually rent for vs. the listed asking? Can we see a recent rent roll and the last 12 months of T-12 income?
- Built in 1962 — when were the roof, HVAC, electrical panel, plumbing, and water heater last replaced?
- Is there a deadline driving the sale (1031 exchange, divorce, estate, relocation)? That informs how much negotiation room exists.
- Schools are A-rated — typically a magnet for longer-tenancy family renters. What's the average tenant stay here, and is there a school-zone premium baked into asking?
- The area grade is low — what's the realistic commute time and amenity access for the typical tenant pool here? Any planned neighborhood developments (good or bad) we should know about?
- What's the average days-on-market for RENTAL listings here right now (not sales)? A rising rental-DOM trend means longer vacancies and softer asking-rent achievability than the comps imply.
- What's the recent tenant-quality profile in this submarket — average credit score on applications, eviction rate, late-payment / NSF rate, and stable-employment percentage? A property-management company in the area should have these aggregated.
- How much new for-sale + rental construction is in the pipeline within 1–3 miles? Heavy new supply typically softens prices + rents 12–24 months out; constrained supply supports both.
Investment metrics
- 1% rule
- 0.80% ✗
- Cap rate
- 6.20%
- Cash-on-cash
- -0.33%
- DSCR
- 0.99
- GRM
- 10.5
CMA / ARV
- ARV (on-the-fly)
- $165,240
- Comps found
- 3
Show comp detail 3 sales within ~0.75 mi
| Address | Dist | Beds/Ba | Sqft | Sold | Price | $/sf | Match |
|---|---|---|---|---|---|---|---|
| 215 6th Ave. Ave SW | 0.12mi | 2/1.0 (-1) | 1,030 (+1%) | 12mo | $160,000 | $155 | 78 |
| 834 Central Ave. Ave SE | 0.61mi | 2/1.0 (-1) | 1,043 (+2%) | 14mo | $169,000 | $162 | 51 |
| 418 3rd St. St NW | 0.61mi | 2/1.5 (-1) | 1,086 (+6%) | 6mo | $200,000 | $184 | 49 |
Match score weights: distance 35% · size 25% · config 20% · recency 20%. Top-matched comps best support the ARV.
Projected returns pro-forma
-3.0% appreciation · 3.0% rent growth · sell at horizon
- IRR
- -16.9%
- Equity multiple
- 0.40×
- Total profit
- $-35,936
- Equity at exit
- $32,057
- IRR
- -8.8%
- Equity multiple
- 0.45×
- Total profit
- $-32,828
- Equity at exit
- $18,589
Cash invested: $60,200 (down + closing). Projections, not guarantees.
Landlord ↔ Tenant lean methodology
- Overall (STATE)
- 83 Strongly Landlord-Friendly
- State Iowa
- 83 Strongly Landlord-Friendly · R+6
- County
- — inherits STATE
- City
- — inherits STATE
ZIP-level market 51031
- Home prices YoY
- -22.2%
- Active inventory
- 59
- Price-to-rent
- 10.5×
Monthly cashflow live
- Estimated rent
- $1,714 medium interval (Pro) →
- Mortgage (P&I)
- −$1,127
- Tax from tax record
- −$154 /mo · $1,842/yr
- Insurance
- −$90
- HOA
- −$0
- Vacancy / Maint / Mgmt
- −$360
- Net cashflow
- $-17
Break-even live
Sensitivity live
| Price | -10% $105 | -5% $44 | +0% $-17 | +5% $-77 | +10% $-138 |
|---|---|---|---|---|---|
| Rent | -10% $-152 | -5% $-84 | +0% $-17 | +5% $51 | +10% $119 |
| Rate | -1.0pp $92 | -0.5pp $38 | base $-17 | +0.5pp $-72 | +1.0pp $-129 |
UW: 25.0% down · 7.5% · 30yr · 1.5% tax · 5.0% vac · 8.0% maint · 8.0% mgmt
Financing live
Cash to close
- Down payment
- $53,750
- Closing costs
- $6,450
- Reserves months
- —
- Total cash needed
- —
Loan-product check · same deal, 3 products live
Conventional
25% down · 7.5% · 30yr
- Down + closing
- —
- Monthly P&I
- —
- Monthly cashflow
- —
- DSCR
- —
- Eligible?
- —
Personal DTI + credit; lowest rate.
DSCR
20% down · 8.5% · 30yr
- Down + closing
- —
- Monthly P&I
- —
- Monthly cashflow
- —
- DSCR
- —
- Eligible?
- —
No personal income docs; deal must DSCR.
Hard money
10% down · 12.0% · 12mo
- Down + closing
- —
- Monthly P&I
- —
- Monthly cashflow
- —
- DSCR
- —
- Eligible?
- —
Short-term bridge; refi at stabilization.
Rent comps 1 comps
| Address | Beds | Baths | Sqft | Rent | $/sqft | DOM | Units | Dist |
|---|---|---|---|---|---|---|---|---|
| 427 4th St NW Le Mars, IA | 1.0–2.0 | 1.0–2.0 | 1011 | $1,714 | $1.70 | 45d | 32 | 0.71mi |
Listing history 3 events
-
2026-03-27status Pending
-
2026-03-19$215,000 Active
-
2011-09-09soldstatus $85,000
ⓘ Source: listings_history table (triggers on properties + properties_extension) + one-shot
backfill from property_details.listing_events for pre-trigger history.
Tax reassessment forecast IA · Partial reset (capped growth)
- Current annual tax
- $1,842 · $154/mo
- Projected year-2 tax
- $2,609 · $217/mo
- Expected delta
- +$767/yr (+$64/mo · 41.6%)
ⓘ Screening estimate from a state-policy table — verify with the county assessor before closing.
Climate risk First Street
- Flood 1/10 Low FEMA zone X (unshaded) · 0% chance over 30 yrs
- Wildfire 1/10 Low
- Heat 3/10 Moderate 7 d/yr ≥103°F today · 15 d/yr by 30 yrs out
- Wind 2/10 Low
- Air quality 2/10 Low 1 unhealthy d/yr today · 1 by 30 yrs out
Nearby sold comps map
Loading sold comps map…
Walkable amenities ~0.75 mi
Loading nearby amenities…
Taxation est. · year 1
- Rental income
- $20,568
- − Mortgage interest
- −$12,043
- − Property taxes
- −$1,842
- − Insurance
- −$1,075
- − Repairs & maintenance
- −$1,645
- − Management
- −$1,645
- − Depreciation
- −$6,255
- Taxable loss
- −$3,938
- Est. tax savings @ 24.0%
- +$945
- After-tax cash flow
- $747/yr
For passive investors: Depreciation is non-cash, so a rental often shows a tax loss while cash-flowing — sheltering income. Rental losses are passive: they offset passive income freely, and up to $25,000/yr can offset ordinary (W-2) income if you actively participate and your MAGI is under $100k (phasing out to $0 by $150k); unused losses carry forward. On sale, claimed depreciation is recaptured at up to 25%, and gains may owe capital-gains tax (a 1031 exchange can defer both). Figures are a year-1 estimate at your 24.0% rate — not tax advice; consult a CPA.
Schools (NCES district)
- District
- Le Mars Community School District
- NCES district ID
- 1916530
- Math proficiency
- 73% ▼ -5.00%
- Reading proficiency
- 72% ▼ -1.00%
- Median HH income
- $55,414
- Composite
- 61.97/100
- National rank
- #723
- State rank
- #96 of 289 in IA
Livability — Le Mars
- Score
- 82/100
- State rank
- #48
- US rank
- #1235
Category grades
Schools grade is shown separately in the Schools card above.
Census & demographics
- Census place
- Le Mars, IA
- Population (ZIP)
- 12,785
Population outlook (Plymouth County) Hauer SSP2
- Today (2025)
- 25,214 people
- By 2030
- 25,257 · +0.2%
- By 2040
- 25,304 · +0.4%
- By 2050
- 25,421 · +0.8%
- By 2075
- 26,820 · +6.4%
- By 2100
- 27,604 · +9.5%
Race, ethnicity, and origin ACS 2023
- Neighborhood character
- Predominantly White (85%)
- Race & ethnicity
- White 85% Hispanic / Latino 9% Black 4% Two or more races 4%
- Hispanic origin (detail)
- Mexican 6%
- Common ancestry
- Iranian 6% Portuguese 3% Ukrainian 2%
- Foreign-born
- 6% · Canada
- Languages at home
- 88% English-only · Spanish 7% German/W. Germanic 1%
Political lean MEDSL · Plymouth
- 2024 margin
- Solid R (+54.2) · D 22.3% · R 76.5% · Other 1.2%
- 2008→2024 swing
- -29.2pp toward R · 2008: -25.1pp · 2024: -54.2pp
- All cycles
- 2024: R+54.2 2020: R+49.3 2016: R+51.9 2012: R+34.3 2008: R+25.1
Not yet ingested
- Civics
- —
Market trends
- HPI YoY
- ▼ -81.02%
- Current HPI
- 283.6093
- Rent YoY
- —
- Metro
- —
- State GDP YoY
- ▲ 2.48%
- F500 in state
- 4
Industry mix (Fortune 500 HQ in IA)
| Industry | F500 HQs | Revenue |
|---|---|---|
| Financial Services | 1 | $16B |
|
||
| Retail / Convenience | 1 | $15B |
|
||
Price history
+152.9% since first listed3 events — show timeline
- 2026-03-27 Pending — NWIA
- 2026-03-19 Listed $215,000 NWIA
- 2011-09-09 Sold (Public Records) $85,000 Public Records
Property tax history
+3.9%/yrLatest (2025): $1,842 · +9.3% YoY. Source: county tax records.
Cash-flow waterfall
monthlySold comps — $/sqft
last 12 mo · ≤1 miLoading sold comps…