250 N Jay Rd · North Troy, VT
Flood risk 1/10 · Minimal
- FEMA flood zone
- X
- Chance of flooding over 30 yrs
- 0.0%
- Est. flood insurance / yr
- $507 – $1,088
Fire risk 3/10 · Minor
- Est. fire insurance / yr
- $480 – $892
Heat risk 2/10 · Minimal
- Hot days now (above 89°F)
- 7 days/yr
- Hot days in 30 yrs
- 16 days/yr
Wind risk 2/10 · Minimal
- Chance of severe wind over 30 yrs
- 3.0%
Air-quality risk 2/10 · Minimal
- Unhealthy air days now
- 1 days/yr
- Unhealthy air days in 30 yrs
- 1 days/yr
Risk factors via First Street. Map © Google.
Why this score? — see what drove the C grade
The composite is a weighted blend of 9 inputs, each scored 0–100. Each bar is that input's sub-score; the figure is the points it added to the 100-point composite (weight × sub-score).
- Cash flow +18.8/30.0
- Appreciation +10.0/10.0
- ARV discount +7.5/15.0
- DSCR +5.9/10.0
- Schools +5.0/10.0
- 1% rule +4.2/10.0
- Livability +3.0/5.0
- Rent growth +2.5/5.0
- Condition / age +2.5/5.0
$125,000
🖨 Deal sheet 📄 Offer letter ✓ Due diligence
Listing remarks MLS
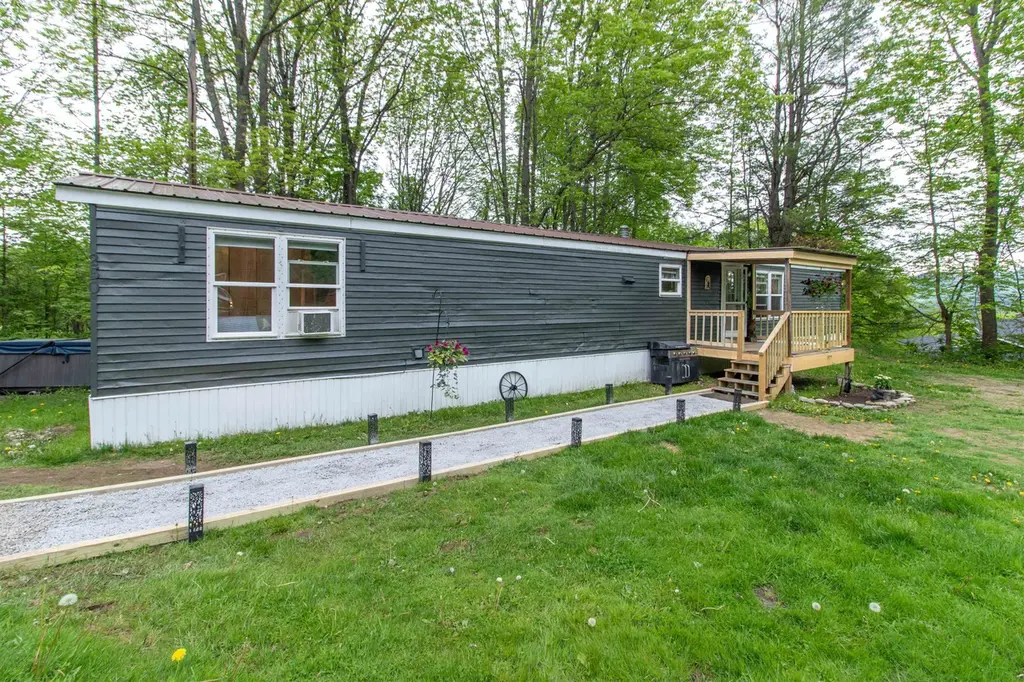
Freshly renovated mobile home situated on 0.49 acres in a quiet country setting. Recent updates include interior paint, flooring and storm doors. Also featuring efficient double-pane vinyl windows throughout and a weatherization performed by NETO in 2019. Offering a slab foundation, primary bedroom with attached half-bath, aluminum siding, and a corrugated metal roof ensuring longevity and minimal upkeep. Serviced by a propane-fired wall furnace, with public water and sewer. Outside, a detached single-bay garage with electricity - likewise on a slab foundation - provides additional parking/storage. Located just a short distance from town amenities, within close proximity to the VAST trail system, and just 12 minutes from Jay Peak Resort. This mobile home is priced to sell and is an excellent opportunity for Buyers seeking an affordable primary residence or a reliable rental/investment property.
Key facts
- Paved road
- Babbling brook
- Town sewer
Tags
Property features AI
Finance
- Other: Deed and property disclosure available
Exterior
- Parking: 1-car garage
- Utilities: Public water; Public sewer; 200 amp electric service; Vermont Electric Co-op; Propane fuel (Fred's Energy); Cable available; Telephone available; High-speed internet available
- Home design: Manufactured home (Mobile/Manuf); Dark blue exterior; Corrugated metal roof; Existing construction; One story
- Construction: Metal siding; Built in 1985; Manufactured home structure
- Exterior features: Country setting; Open lot; Near snowmobile trails; Gravel driveway
Interior
- Kitchen: Dishwasher; Electric range with exhaust hood; Refrigerator
- Flooring: Carpet; Laminate
- Bathrooms: One full bathroom; One half bathroom
- Heating & cooling: Propane heating; Hot air heating
- Interior features: Seven total rooms; Carpet and laminate flooring
- Laundry & utility: Washer; Dryer; Water heater
Neighborhood map
What this means for you Summary
Snapshot
- This is a 2-bed/1.5-bath manufactured listed at $125k.
Deal economics
- At list price, monthly cash flow is $125 ($2k/yr) — positive.
- The deal already cash-flows at list — no discount required.
- To meet the 1% rule (rent ≥ 1% of price), the offer needs to be $115k (8.2% below list).
- Recommended offer: $115k (8.2% below list) — sets the bar for 1% rule.
Location & tenants
- Location reads 60/100 on livability (#91 in VT) — a middle-class / working-renter tenant base. Strengths: cost of living A+, housing A+; Watch: crime C-, employment D, schools F.
- Market conditions: 32 active listings in the ZIP; 157 units permitted in Orleans County in 2024 (107 in 5+ unit buildings).
Forward outlook
- In year one you build about $13k of equity ($864 loan paydown + $12k appreciation (10.0% local appreciation)).
- Orleans County population projected at -19% by 2050 — secular population decline; favor cash flow + early exit over multi-decade hold.
- At projected returns (10.0% appreciation + 3.0% rent growth), your $35k cash investment doubles in ~3 years — after that, you're playing with house money.
- By year 3, paydown + projected appreciation supports a ~$34k cash-out refi (75% LTV) — recoverable capital for the next deal without selling this one.
Negotiation context
- Only 1 days on market — expect competitive offers; lowballing is unlikely to land.
- 2 sale attempts with the ask held roughly flat each time — persistent listings suggest the price (not the market) is what's stuck; bring a comps-based counter.
- Current owner paid $98k; 28% above their basis — modest negotiation headroom, anchor on the comps not their cost.
Questions for the listing agent
- Is there a deadline driving the sale (1031 exchange, divorce, estate, relocation)? That informs how much negotiation room exists.
- Schools are F-rated, which usually means shorter tenancies and higher turnover. Who's the typical renter profile here, and what's been the actual vacancy rate?
- What's the average days-on-market for RENTAL listings here right now (not sales)? A rising rental-DOM trend means longer vacancies and softer asking-rent achievability than the comps imply.
- What's the recent tenant-quality profile in this submarket — average credit score on applications, eviction rate, late-payment / NSF rate, and stable-employment percentage? A property-management company in the area should have these aggregated.
- How much new for-sale + rental construction is in the pipeline within 1–3 miles? Heavy new supply typically softens prices + rents 12–24 months out; constrained supply supports both.
Investment metrics
- 1% rule
- 0.92% ✗
- Cap rate
- 7.50%
- Cash-on-cash
- 4.30%
- DSCR
- 1.19
- GRM
- 9.1
CMA / ARV
No comps found within radius.
Projected returns pro-forma
10.0% appreciation · 3.0% rent growth · sell at horizon
- IRR
- 27.4%
- Equity multiple
- 3.17×
- Total profit
- $76,029
- Equity at exit
- $112,610
- IRR
- 23.9%
- Equity multiple
- 7.22×
- Total profit
- $217,547
- Equity at exit
- $242,848
Cash invested: $35,000 (down + closing). Projections, not guarantees.
Landlord ↔ Tenant lean methodology
- Overall (STATE)
- 41 Moderately Tenant-Leaning
- State Vermont
- 41 Moderately Tenant-Leaning · D+15
- County
- — inherits STATE
- City
- — inherits STATE
ZIP-level market 05859
- Home prices YoY
- 18.0%
- Active inventory
- 32
- Price-to-rent
- 9.1×
Monthly cashflow live
- Estimated rent
- $1,148 medium interval (Pro) →
- Mortgage (P&I)
- −$656
- Tax from tax record
- −$74 /mo · $885/yr
- Insurance
- −$52
- HOA
- −$0
- Vacancy / Maint / Mgmt
- −$241
- Net cashflow
- $125
Break-even live
UW: 25.0% down · 7.5% · 30yr · 1.5% tax · 5.0% vac · 8.0% maint · 8.0% mgmt
Financing live
Cash to close
- Down payment
- $31,250
- Closing costs
- $3,750
- Reserves months
- —
- Total cash needed
- —
Loan-product check · same deal, 3 products live
Conventional
25% down · 7.5% · 30yr
- Down + closing
- —
- Monthly P&I
- —
- Monthly cashflow
- —
- DSCR
- —
- Eligible?
- —
Personal DTI + credit; lowest rate.
DSCR
20% down · 8.5% · 30yr
- Down + closing
- —
- Monthly P&I
- —
- Monthly cashflow
- —
- DSCR
- —
- Eligible?
- —
No personal income docs; deal must DSCR.
Hard money
10% down · 12.0% · 12mo
- Down + closing
- —
- Monthly P&I
- —
- Monthly cashflow
- —
- DSCR
- —
- Eligible?
- —
Short-term bridge; refi at stabilization.
Listing history 3 events
-
2026-06-02status $125,000 Pending 1 DOM
-
2026-06-02remarks 632-char remark
-
2026-06-02$125,000 Active 1 DOM
ⓘ Source: listings_history table (triggers on properties + properties_extension) + one-shot
backfill from property_details.listing_events for pre-trigger history.
Tax reassessment forecast VT · Partial reset (capped growth)
- Current annual tax
- $885 · $74/mo
- Projected year-2 tax
- $1,630 · $136/mo
- Expected delta
- +$745/yr (+$62/mo · 84.2%)
ⓘ Screening estimate from a state-policy table — verify with the county assessor before closing.
Climate risk First Street
- Flood 1/10 Low FEMA zone X · 0% chance over 30 yrs
- Wildfire 3/10 Moderate
- Heat 2/10 Low 7 d/yr ≥89°F today · 16 d/yr by 30 yrs out
- Wind 2/10 Low 3% chance of damaging wind over 30 yrs
- Air quality 2/10 Low 1 unhealthy d/yr today · 1 by 30 yrs out
Nearby sold comps map
Loading sold comps map…
Walkable amenities ~0.75 mi
Loading nearby amenities…
Taxation est. · year 1
- Rental income
- $13,773
- − Mortgage interest
- −$7,002
- − Property taxes
- −$885
- − Insurance
- −$625
- − Repairs & maintenance
- −$1,102
- − Management
- −$1,102
- − Depreciation
- −$3,636
- Taxable loss
- −$579
- Est. tax savings @ 24.0%
- +$139
- After-tax cash flow
- $1,643/yr
For passive investors: Depreciation is non-cash, so a rental often shows a tax loss while cash-flowing — sheltering income. Rental losses are passive: they offset passive income freely, and up to $25,000/yr can offset ordinary (W-2) income if you actively participate and your MAGI is under $100k (phasing out to $0 by $150k); unused losses carry forward. On sale, claimed depreciation is recaptured at up to 25%, and gains may owe capital-gains tax (a 1031 exchange can defer both). Figures are a year-1 estimate at your 24.0% rate — not tax advice; consult a CPA.
Schools (NCES district)
No district data.
Livability — North Troy
- Score
- 60/100
- State rank
- #91
- US rank
- #19333
Category grades
Schools grade is shown separately in the Schools card above.
Census & demographics
- Census place
- North Troy, VT
- Population (ZIP)
- 2,217
Population outlook (Orleans County) Hauer SSP2
- Today (2025)
- 26,222 people
- By 2030
- 25,399 · -3.1%
- By 2040
- 23,350 · -11.0%
- By 2050
- 21,232 · -19.0%
- By 2075
- 16,543 · -36.9%
- By 2100
- 11,566 · -55.9%
Race, ethnicity, and origin ACS 2023
- Neighborhood character
- Predominantly White (93%)
- Race & ethnicity
- White 93% Two or more races 3% Hispanic / Latino 2%
- Common ancestry
- Lithuanian 10% Romanian 5% Slovak 2%
- Foreign-born
- 3% · Canada
- Languages at home
- 91% English-only · French/Haitian/Cajun 7% Tagalog/Filipino 1%
Political lean MEDSL · Orleans
- 2024 margin
- Toss-up / Even · D 47.8% · R 49.4% · Other 2.8%
- 2008→2024 swing
- -29.1pp toward R · 2008: 27.5pp · 2024: -1.6pp
- All cycles
- 2024: R+1.6 2020: D+4.5 2016: D+0.2 2012: D+24.2 2008: D+27.5
Not yet ingested
- Civics
- —
Market trends
- HPI YoY
- ▲ 35.91%
- Current HPI
- 235.7598
- Rent YoY
- —
- Metro
- —
- State GDP YoY
- —
- F500 in state
- 0
Price history
+26.9% since first listed5 events — show timeline
- 2026-06-01 Listed $125,000 PrimeMLS
- 2025-11-17 Sold (Public Records) $98,000 Public Records
- 2025-11-05 Sold (MLS) $98,000 PrimeMLS
- 2025-10-08 Pending — PrimeMLS
- 2025-09-27 Listed $98,500 PrimeMLS
Property tax history
+24.4%/yrLatest (2024): $885 · +20.2% YoY. Source: county tax records.
Cash-flow waterfall
monthlySold comps — $/sqft
last 12 mo · ≤1 miLoading sold comps…