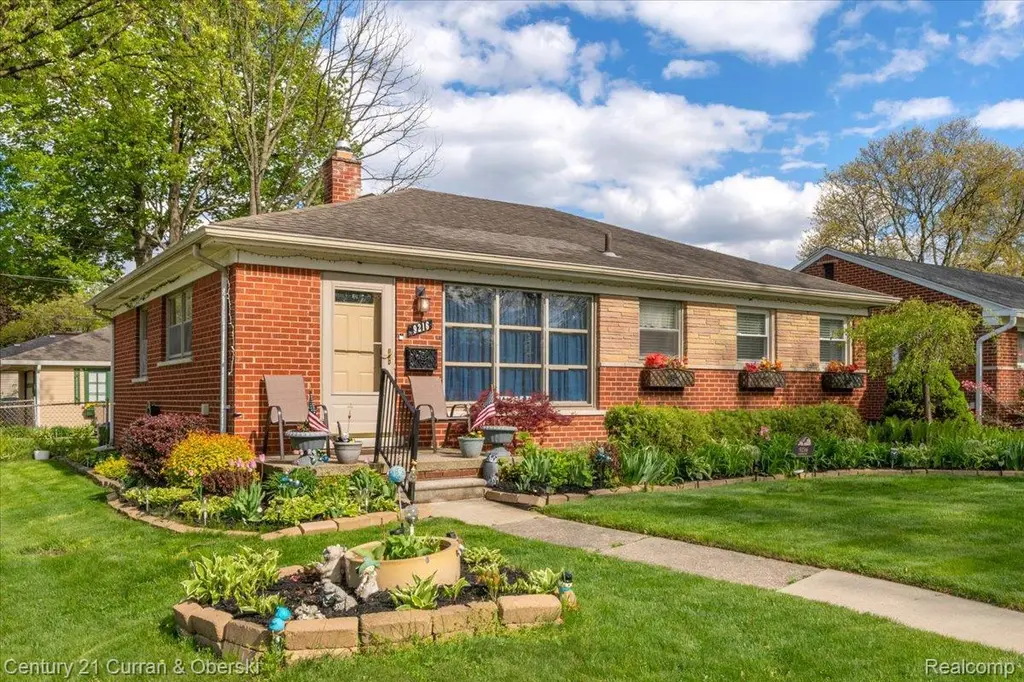
9216 Nathaline · Dearborn Heights, MI
Flood risk 5/10 · Moderate
- FEMA flood zone
- X (unshaded)
- Chance of flooding over 30 yrs
- 0.66%
- Est. flood insurance / yr
- $473 – $860
Fire risk 1/10 · Minimal
- Est. fire insurance / yr
- $784 – $1,456
Heat risk 3/10 · Minor
- Hot days now (above 98°F)
- 7 days/yr
- Hot days in 30 yrs
- 15 days/yr
Wind risk 2/10 · Minimal
- Chance of severe wind over 30 yrs
- —
Air-quality risk 3/10 · Minor
- Unhealthy air days now
- 2 days/yr
- Unhealthy air days in 30 yrs
- 3 days/yr
Risk factors via First Street. Map © Google.
Why this score? — see what drove the D grade
The composite is a weighted blend of 9 inputs, each scored 0–100. Each bar is that input's sub-score; the figure is the points it added to the 100-point composite (weight × sub-score).
- Cash flow +14.7/30.0
- ARV discount +5.3/15.0
- DSCR +4.5/10.0
- 1% rule +4.0/10.0
- Livability +4.0/5.0
- Rent growth +3.3/5.0
- Condition / age +2.5/5.0
- Schools +1.8/10.0
- Appreciation +0.0/10.0
$196,600
🖨 Deal sheet 📄 Offer letter ✓ Due diligence
Listing remarks MLS
This charming 3-bedroom, 1,000 + -square-foot ranch offers newer flooring throughout and has been impeccably maintained. Situated on a beautifully landscaped, fenced-in corner lot, it features a 2-car garage and extra space. The finished basement boasts extra-high ceilings. This well-cared-for home is ready for its next owner. Please note: a handful of flowers will be removed at the time of sale.
Key facts
- 6,970 sq ft lot
- 2 garage spots
- Built 1954
Property features AI
Exterior
- Parking: Detached 2-car garage
- Utilities: Public water; Public sewer
- Home design: Single-family residence; One level; Ground-level entry with steps; Brick exterior
- Construction: Block foundation; Has home warranty
- Exterior features: Paved road access; Lot approximately 0.16 acres (55 x 126.69)
Interior
- Bathrooms: 2 full bathrooms
- Heating & cooling: Forced air heating (natural gas); No central cooling
- Interior features: Finished basement
Neighborhood map
What this means for you Summary
Snapshot
- This is a 3-bed/2.0-bath single-family listed at $197k.
Deal economics
- At list price, monthly cash flow is $50 ($598/yr) — positive.
- The deal already cash-flows at list — no discount required.
- To meet the 1% rule (rent ≥ 1% of price), the offer needs to be $178k (9.7% below list).
- Recommended offer: $178k (9.7% below list) — sets the bar for 1% rule.
Location & tenants
- Location reads 79/100 on livability (#82 in MI, #1,885 nationally) — a middle-class / working-renter tenant base. Strengths: commute A+, cost of living A+, housing A+; Watch: schools C-, crime D+, employment D+.
- South Redford School District (suburban): math 11% / reading 29% proficiency, ranked #455 of 540 in MI (top 84%) — low school quality limits family demand, transient renter base, plan for 1-2y turnover.
- Market conditions: Rents rising (+3.2%/yr); 188 active listings in the ZIP; 7 comparable units currently listed for rent nearby; rentals leasing fast (median 4d on market — plan ~1-2 weeks tenant-placement turnaround); 2,639 units permitted in Wayne County in 2024 (1,216 in 5+ unit buildings).
Forward outlook
- Local home prices are declining (-3.0%/yr); year-one equity from $1k of loan paydown is wiped out by about $6k of value loss. Plan a longer hold.
- Wayne County population projected at -17% by 2050 — secular population decline; favor cash flow + early exit over multi-decade hold.
Negotiation context
- Only 6 days on market — expect competitive offers; lowballing is unlikely to land.
- 11 sale attempts since 23y ago with the ask held roughly flat each time — persistent listings suggest the price (not the market) is what's stuck; bring a comps-based counter.
Risks & watch-outs
- Watch-outs: built in 1954 — expect roof / HVAC / electrical / plumbing capex.
- Climate carrying-cost: moderate flood risk — expect insurance premiums to compound above CPI over the hold.
Questions for the listing agent
- Built in 1954 — when were the roof, HVAC, electrical panel, plumbing, and water heater last replaced?
- Is there a deadline driving the sale (1031 exchange, divorce, estate, relocation)? That informs how much negotiation room exists.
- Crime grade is D in this area — have there been break-ins, vandalism, or insurance claims at this property in the last 3 years? What carrier currently insures it and at what premium?
- The area grade is low — what's the realistic commute time and amenity access for the typical tenant pool here? Any planned neighborhood developments (good or bad) we should know about?
- What's the average days-on-market for RENTAL listings here right now (not sales)? A rising rental-DOM trend means longer vacancies and softer asking-rent achievability than the comps imply.
- What's the recent tenant-quality profile in this submarket — average credit score on applications, eviction rate, late-payment / NSF rate, and stable-employment percentage? A property-management company in the area should have these aggregated.
- How much new for-sale + rental construction is in the pipeline within 1–3 miles? Heavy new supply typically softens prices + rents 12–24 months out; constrained supply supports both.
Investment metrics
- 1% rule
- 0.90% ✗
- Cap rate
- 6.60%
- Cash-on-cash
- 1.09%
- DSCR
- 1.05
- GRM
- 9.2
CMA / ARV
- ARV (median comp)
- $187,378
- List price
- $196,600
- Delta
- 4.92%
- Verdict
- FAIR
- Comps
- 20 within 1.0 mi
Show comp detail 12 sales within ~0.75 mi
| Address | Dist | Beds/Ba | Sqft | Sold | Price | $/sf | Match |
|---|---|---|---|---|---|---|---|
| 9010 Leverne | 0.27mi | 3/1.0 | 1,020 (-4%) | 2mo | $220,000 | $216 | 75 |
| 9624 Nathaline | 0.26mi | 3/1.0 | 1,019 (-4%) | 3mo | $209,000 | $205 | 74 |
| 9983 Hemingway | 0.41mi | 3/1.0 | 1,059 (-0%) | 3mo | $149,000 | $141 | 74 |
| 9560 Nathaline | 0.20mi | 4/1.5 (+1) | 1,125 (+6%) | 1mo | $142,500 | $127 | 73 |
| 9656 Sioux | 0.31mi | 4/1.0 (+1) | 1,116 (+5%) | 2mo | $147,500 | $132 | 67 |
| 9130 Kinloch | 0.40mi | 3/1.5 | 1,144 (+8%) | 3mo | $123,000 | $108 | 64 |
| 9370 Gillman St | 0.74mi | 3/1.5 | 1,058 (-1%) | 2mo | $210,000 | $198 | 61 |
| 9636 Centralia | 0.62mi | 3/1.0 | 1,043 (-2%) | 4mo | $135,000 | $129 | 61 |
| 9964 Norborne | 0.62mi | 3/1.0 | 1,033 (-3%) | 5mo | $125,900 | $122 | 58 |
| 9960 Rockland | 0.48mi | 3/2.0 | 937 (-12%) | 2mo | $150,000 | $160 | 56 |
| 26388 Ann Arbor Trl | 0.62mi | 3/1.5 | 1,194 (+12%) | 1mo | $270,000 | $226 | 48 |
| 28070 W Chicago St | 0.73mi | 4/2.0 (+1) | 974 (-8%) | 2mo | $295,000 | $303 | 46 |
Match score weights: distance 35% · size 25% · config 20% · recency 20%. Top-matched comps best support the ARV.
Projected returns pro-forma
-3.0% appreciation · 3.25% rent growth · sell at horizon
- IRR
- -14.3%
- Equity multiple
- 0.49×
- Total profit
- $-28,211
- Equity at exit
- $29,314
- IRR
- -5.1%
- Equity multiple
- 0.66×
- Total profit
- $-18,535
- Equity at exit
- $16,998
Cash invested: $55,048 (down + closing). Projections, not guarantees.
Landlord ↔ Tenant lean methodology
- Overall (STATE)
- 62 Landlord-Friendly
- State Michigan
- 62 Landlord-Friendly · EVEN
- County
- — inherits STATE
- City
- — inherits STATE
ZIP-level market 48239
- Rents YoY
- 3.2%
- Active inventory
- 188
- Price-to-rent
- 9.2×
Monthly cashflow live
- Estimated rent
- $1,776 high interval (Pro) →
- Mortgage (P&I)
- −$1,031
- Tax from tax record
- −$240 /mo · $2,882/yr
- Insurance
- −$82
- HOA
- −$0
- Vacancy / Maint / Mgmt
- −$373
- Net cashflow
- $50
Break-even live
UW: 25.0% down · 7.5% · 30yr · 1.5% tax · 5.0% vac · 8.0% maint · 8.0% mgmt
Financing live
Cash to close
- Down payment
- $49,150
- Closing costs
- $5,898
- Reserves months
- —
- Total cash needed
- —
Loan-product check · same deal, 3 products live
Conventional
25% down · 7.5% · 30yr
- Down + closing
- —
- Monthly P&I
- —
- Monthly cashflow
- —
- DSCR
- —
- Eligible?
- —
Personal DTI + credit; lowest rate.
DSCR
20% down · 8.5% · 30yr
- Down + closing
- —
- Monthly P&I
- —
- Monthly cashflow
- —
- DSCR
- —
- Eligible?
- —
No personal income docs; deal must DSCR.
Hard money
10% down · 12.0% · 12mo
- Down + closing
- —
- Monthly P&I
- —
- Monthly cashflow
- —
- DSCR
- —
- Eligible?
- —
Short-term bridge; refi at stabilization.
Rent comps 7 comps
| Address | Beds | Baths | Sqft | Rent | $/sqft | DOM | Units | Dist |
|---|---|---|---|---|---|---|---|---|
| 27201 Canfield St W Dearborn Heights, MI | 1.0–2.0 | 1.0–2.0 | 852 | $1,499 | $1.76 | 1d | 22 | 0.65mi |
| 11726 Deering St Livonia, MI | 4.0 | 1.5 | 1248 | $2,125 | $1.70 | 1d | 1 | 0.94mi |
| 12097 Cavell St Livonia, MI | 3.0 | 1.0 | 985 | $1,200 | $1.22 | 1d | 1 | 1.00mi |
| 12107 Centralia Redford, MI | 3.0 | 1.0 | 912 | $1,800 | $1.97 | 43d | 1 | 1.06mi |
| 8455 Robindale Ave Dearborn Heights, MI | 3.0 | 1.0 | 1100 | $1,750 | $1.59 | 4d | 1 | 1.16mi |
| 8402 Robindale Ave Dearborn Heights, MI | 3.0 | 1.0 | 1190 | $1,600 | $1.34 | 14d | 1 | 1.21mi |
| 11141 Karen St Livonia, MI | 3.0 | 1.0 | 1322 | $1,950 | $1.48 | 10d | 1 | 1.39mi |
Listing history 25 events
-
2026-05-13status Pending 399-char remark
Show marketing remark (399 chars)
This charming 3-bedroom, 1,000 + -square-foot ranch offers newer flooring throughout and has been impeccably maintained. Situated on a beautifully landscaped, fenced-in corner lot, it features a 2-car garage and extra space. The finished basement boasts extra-high ceilings. This well-cared-for home is ready for its next owner. Please note: a handful of flowers will be removed at the time of sale.
-
2026-05-08$196,600 Active 399-char remark
Show marketing remark (399 chars)
This charming 3-bedroom, 1,000 + -square-foot ranch offers newer flooring throughout and has been impeccably maintained. Situated on a beautifully landscaped, fenced-in corner lot, it features a 2-car garage and extra space. The finished basement boasts extra-high ceilings. This well-cared-for home is ready for its next owner. Please note: a handful of flowers will be removed at the time of sale.
-
2026-05-04historical $196,600 399-char remark
Show marketing remark (399 chars)
This charming 3-bedroom, 1,000 + -square-foot ranch offers newer flooring throughout and has been impeccably maintained. Situated on a beautifully landscaped, fenced-in corner lot, it features a 2-car garage and extra space. The finished basement boasts extra-high ceilings. This well-cared-for home is ready for its next owner. Please note: a handful of flowers will be removed at the time of sale.
-
2014-07-25soldstatus $87,000
Show marketing remark (324 chars)
PROPERTY ELIGIBLE FREDDIE MAC FIRST LOOK THROUGH 02/13/14. SELLER IS OFFERING OWNER OCCUPIED UP TO $500 TOWARDS BUYERS PURCHASE OF A HOME WARRANTY OF CHOICE. CONTRACTS SUBJECT TO BANK ADDEN. AS IS SALE. THREE BEDROOM RANCH BRICK EXTERIOR WITH FINISHED BASEMENT, 2 FULL BATHROOM, WELL MAINTAINED, UPDATED APPLIANCES INCLUDED.
-
2014-01-24$89,900
Show marketing remark (324 chars)
PROPERTY ELIGIBLE FREDDIE MAC FIRST LOOK THROUGH 02/13/14. SELLER IS OFFERING OWNER OCCUPIED UP TO $500 TOWARDS BUYERS PURCHASE OF A HOME WARRANTY OF CHOICE. CONTRACTS SUBJECT TO BANK ADDEN. AS IS SALE. THREE BEDROOM RANCH BRICK EXTERIOR WITH FINISHED BASEMENT, 2 FULL BATHROOM, WELL MAINTAINED, UPDATED APPLIANCES INCLUDED.
-
2013-09-19historical
-
2013-09-19historical
-
2013-05-04$62,900
-
2013-05-04$62,900
-
2013-04-11historical
-
2013-04-11historical
-
2013-04-11historical
-
2012-10-03$49,900
-
2012-10-02$49,900
-
2012-08-04$54,900
-
2007-05-29soldstatus $142,500
-
2007-05-02soldstatus $142,500
-
2006-08-03$144,900
-
2003-11-14soldstatus $134,000
-
2003-09-15soldstatus $134,000
-
2003-06-23$134,900
ⓘ Source: listings_history table (triggers on properties + properties_extension) + one-shot
backfill from property_details.listing_events for pre-trigger history.
Tax reassessment forecast MI · Partial reset (capped growth)
- Current annual tax
- $2,882 · $240/mo
- Projected year-2 tax
- $2,955 · $246/mo
- Expected delta
- +$73/yr (+$6/mo · 2.5%)
ⓘ Screening estimate from a state-policy table — verify with the county assessor before closing.
Climate risk First Street
- Flood 5/10 Major FEMA zone X (unshaded) · 66% chance over 30 yrs
- Wildfire 1/10 Low
- Heat 3/10 Moderate 7 d/yr ≥98°F today · 15 d/yr by 30 yrs out
- Wind 2/10 Low
- Air quality 3/10 Moderate 2 unhealthy d/yr today · 3 by 30 yrs out
Nearby sold comps map
Loading sold comps map…
Walkable amenities ~0.75 mi
Loading nearby amenities…
Taxation est. · year 1
- Rental income
- $21,310
- − Mortgage interest
- −$11,013
- − Property taxes
- −$2,882
- − Insurance
- −$983
- − Repairs & maintenance
- −$1,705
- − Management
- −$1,705
- − Depreciation
- −$5,719
- Taxable loss
- −$2,696
- Est. tax savings @ 24.0%
- +$647
- After-tax cash flow
- $1,245/yr
For passive investors: Depreciation is non-cash, so a rental often shows a tax loss while cash-flowing — sheltering income. Rental losses are passive: they offset passive income freely, and up to $25,000/yr can offset ordinary (W-2) income if you actively participate and your MAGI is under $100k (phasing out to $0 by $150k); unused losses carry forward. On sale, claimed depreciation is recaptured at up to 25%, and gains may owe capital-gains tax (a 1031 exchange can defer both). Figures are a year-1 estimate at your 24.0% rate — not tax advice; consult a CPA.
Schools (NCES district)
- District
- South Redford School District
- NCES district ID
- 2632280
- Math proficiency
- 11% ▼ -9.00%
- Reading proficiency
- 29% ▼ -7.00%
- Median HH income
- $52,775
- Composite
- 18.1/100
- National rank
- #8972
- State rank
- #455 of 540 in MI
Livability — Dearborn Heights
- Score
- 79/100
- State rank
- #82
- US rank
- #1885
Category grades
Schools grade is shown separately in the Schools card above.
Census & demographics
- County
- Wayne County · 1,562,939 people
- City population
- 36,976
- Metro
- Detroit-Warren-Dearborn, MI
- Population (ZIP)
- 36,976
- Household income
- $71,151
- Rent vs Own
- Severe rent burden
- 1052.0
Population outlook (Wayne County) Hauer SSP2
- Today (2025)
- 1,675,273 people
- By 2030
- 1,620,300 · -3.3%
- By 2040
- 1,502,341 · -10.3%
- By 2050
- 1,384,039 · -17.4%
- By 2075
- 1,124,592 · -32.9%
- By 2100
- 881,193 · -47.4%
Race, ethnicity, and origin ACS 2023
- Neighborhood character
- Majority Black (58%)
- Race & ethnicity
- Black 58% White 34% Hispanic / Latino 4% Two or more races 4%
- Common ancestry
- Romanian 7% Slovak 2% Lithuanian 2%
- Foreign-born
- 2% · Canada
- Languages at home
- 96% English-only · Spanish 1% Other Indo-European 1% Arabic 1%
Political lean MEDSL · Wayne
- 2024 margin
- Strong D (+29.0) · D 62.7% · R 33.7% · Other 3.6%
- 2008→2024 swing
- -20.5pp toward R · 2008: 49.5pp · 2024: 29.0pp
- All cycles
- 2024: D+29.0 2020: D+38.1 2016: D+37.3 2012: D+46.9 2008: D+49.5
Not yet ingested
- Civics
- —
Market trends
- HPI YoY
- ▼ -202.97%
- Current HPI
- 236.1136
- Rent YoY
- ▲ 3.25%
- Metro
- Detroit-Warren-Dearborn, MI
- State GDP YoY
- ▲ 1.37%
- F500 in state
- 28
Industry mix (Fortune 500 HQ in MI)
| Industry | F500 HQs | Revenue |
|---|---|---|
| Automotive Parts | 3 | $48B |
|
||
| Automotive | 2 | $372B |
|
||
| Chemicals | 1 | $45B |
|
||
| Automotive Retail | 1 | $29B |
|
||
| Healthcare / Medical Devices | 1 | $23B |
|
||
| Automotive Technology | 1 | $20B |
|
||
Price history
+59.4% since first listed28 events — show timeline
- 2026-06-15 Sold (MLS) $215,000 REALCOMP
- 2026-06-15 Sold (MLS) $215,000 MiRealSource-MiMLS
- 2026-05-13 Pending — MiRealSource-MiMLS
- 2026-05-13 Pending — REALCOMP
- 2026-05-12 Listing Removed — REALCOMP
- 2026-05-08 Listed $196,600 MiRealSource-MiMLS
- 2026-05-08 Listed $196,600 REALCOMP
- 2026-05-04 Coming Soon $196,600 MiRealSource-MiMLS
- 2014-07-25 Sold (MLS) $87,000 REALCOMP
- 2014-07-25 Sold (MLS) $87,000 MiRealSource-MiMLS
- 2014-01-24 Listed $89,900 REALCOMP
- 2014-01-24 Listed $89,900 MiRealSource-MiMLS
- 2013-09-19 Listing Removed — MiRealSource-MiMLS
- 2013-09-19 Listing Removed — REALCOMP
- 2013-05-04 Listed $62,900 MiRealSource-MiMLS
- 2013-05-04 Listed $62,900 REALCOMP
- 2013-04-11 Listing Removed — REALCOMP
- 2013-04-11 Listing Removed — MiRealSource-MiMLS
- 2013-04-11 Listing Removed — REALCOMP
- 2012-10-03 Listed $49,900 MiRealSource-MiMLS
- 2012-10-02 Listed $49,900 REALCOMP
- 2012-08-04 Listed $54,900 REALCOMP
- 2007-05-29 Sold (Public Records) $142,500 Public Records
- 2007-05-02 Sold (MLS) $142,500 REALCOMP
- 2006-08-03 Listed $144,900 REALCOMP
- 2003-11-14 Sold (Public Records) $134,000 Public Records
- 2003-09-15 Sold (MLS) $134,000 REALCOMP
- 2003-06-23 Listed $134,900 REALCOMP
Property tax history
+3.1%/yrLatest (2025): $2,882 · +2.6% YoY. Source: county tax records.
Cash-flow waterfall
monthlySold comps — $/sqft
last 12 mo · ≤1 miLoading sold comps…