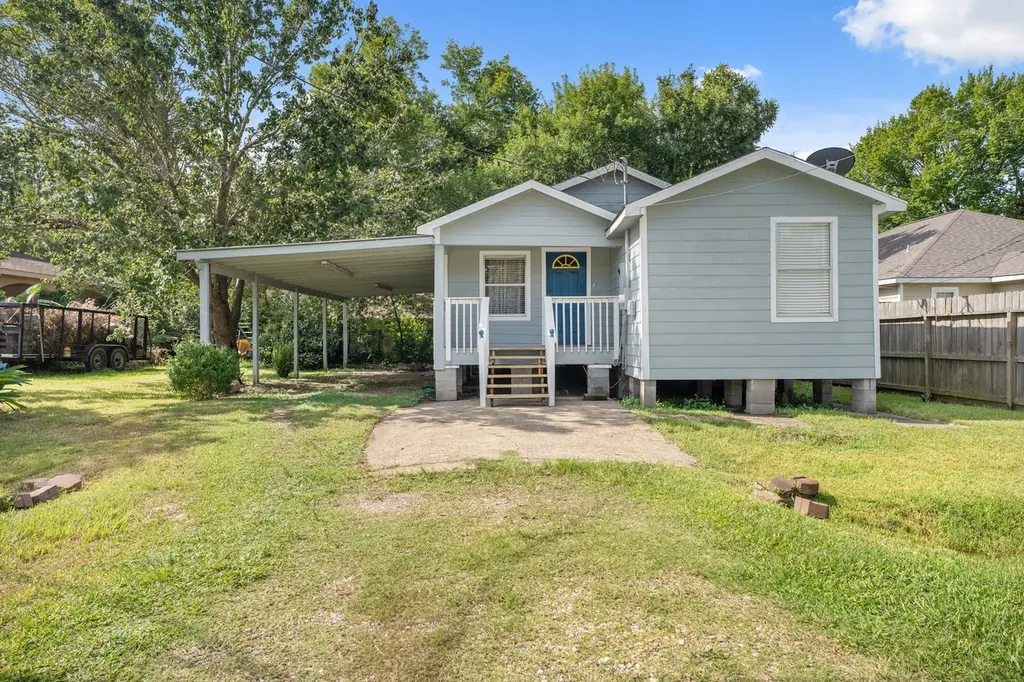
4514 E 24th St E · Dickinson, TX
Flood risk 7/10 · Major
- FEMA flood zone
- X (shaded)
- Chance of flooding over 30 yrs
- 0.75%
- Est. flood insurance / yr
- $507 – $1,088
Fire risk 1/10 · Minimal
- Est. fire insurance / yr
- $1,222 – $2,270
Heat risk 10/10 · Severe
- Hot days now (above 110°F)
- 7 days/yr
- Hot days in 30 yrs
- 25 days/yr
Wind risk 9/10 · Severe
- Chance of severe wind over 30 yrs
- 99.0%
Air-quality risk 2/10 · Minimal
- Unhealthy air days now
- 1 days/yr
- Unhealthy air days in 30 yrs
- 1 days/yr
Risk factors via First Street. Map © Google.
Why this score? — see what drove the B grade
The composite is a weighted blend of 9 inputs, each scored 0–100. Each bar is that input's sub-score; the figure is the points it added to the 100-point composite (weight × sub-score).
- Cash flow +29.4/30.0
- ARV discount +15.0/15.0
- DSCR +10.0/10.0
- 1% rule +8.4/10.0
- Schools +3.5/10.0
- Livability +3.4/5.0
- Rent growth +2.5/5.0
- Condition / age +2.5/5.0
- Appreciation +0.0/10.0
$130,000
🖨 Deal sheet 📄 Offer letter ✓ Due diligence
Listing remarks
Charming home perfect for starting out or downsizing, featuring low maintenance and ample space. Abundant natural light fills the rooms, especially the spacious kitchen. Convenient utility room offers plenty of storage. Appliances like the fridge and washer/dryer are included. Centrally located for shopping, with easy access to Galveston, Clear Lake, and Houston. Ideal for those seeking a cozy, manageable living space. Don't miss out on this opportunity, schedule your viewing today!
Key facts
- Utility room
- Spacious kitchen
- Centrally located
Tags
Property features AI
Finance
- Financial info: Lease not considered
Exterior
- Parking: Attached carport; 2-space carport
- Security: Smoke detector(s)
- Utilities: Public water; Public sewer
- Home design: Residential property; Built in 2005; Pillar/post/pier foundation
- Construction: Cement siding; Wood siding; Composition roof
- Exterior features: Porch; Subdivision setting; Side yard
Interior
- Kitchen: Electric range; Free-standing range; Gas oven; Oven; Microwave; Refrigerator; Disposal
- Bedrooms: Primary bedroom (First level); Bedroom (First level); Bedroom (First level)
- Flooring: Carpet; Plank; Tile; Vinyl
- Bathrooms: 1 full bathroom
- Heating & cooling: Central heating (electric); Central air (electric)
- Interior features: Window treatments and coverings; Ceiling fan(s); Kitchen/dining combo; Programmable thermostat; Smoke detector(s)
- Laundry & utility: Washer included; Washer hookup; Electric dryer hookup; Gas dryer hookup; Utility room (First level)
Neighborhood map
What this means for you Summary
Snapshot
- This is a 3-bed/1.0-bath single-family listed at $130k.
Deal economics
- At list price, monthly cash flow is $395 ($5k/yr) — positive.
- The deal already cash-flows at list — no discount required.
- Meets the 1% rule at list price ($2k rent vs $130k).
- Recommended offer: $126k (3.0% below list) — sets the bar for market timing.
- Cap rate 10.5% vs local median 2.4% in Dickinson — top-decile yield for the area; either an underpriced asset or a hidden risk that comps aren't pricing in. Stress-test before assuming the spread holds.
Location & tenants
- Location reads 67/100 on livability (#533 in TX) — a middle-class / working-renter tenant base. Strengths: cost of living A+, housing A+, employment A-; Watch: amenities F, commute F, health & safety F.
- Dickinson ISD (suburban): math 39% / reading 40% proficiency, ranked #366 of 826 in TX (top 44%) — families likely to look elsewhere, expect single-tenant / working-renter base with shorter leases; 60% free/reduced lunch — lower-income household profile, screen leases tightly.
- Zoned schools: Jake Silbernagel El (math 36% / reading 33%, grade F, #1,995 of 4,322 statewide, top 50%, 640 students, 86% FRL); Dunbar Middle (math 25% / reading 20%, grade F, #1,341 of 1,662 statewide, top 82%, 654 students, 78% FRL); Dickinson H S (math 30% / reading 46%, grade F, #880 of 1,632 statewide, top 54%, 3,619 students, 64% FRL) — zoned schools average 76% FRL vs 60% district-wide (16 pts higher); higher-poverty schools than district average — tighter screening recommended.
- Market conditions: Rents soft (-0.1%/yr); 664 active listings in the ZIP; 15 comparable units currently listed for rent nearby; rentals at typical pace (median 18d on market — plan ~3-4 weeks tenant-placement turnaround); solid renter incomes; 3,258 units permitted in Galveston County in 2024 (0 in 5+ unit buildings).
Forward outlook
- Local home prices are declining (-3.0%/yr); year-one equity from $899 of loan paydown is wiped out by about $4k of value loss. Plan a longer hold.
- Galveston County population projected at +43% by 2050 — long-run rental-demand tailwind backs the buy-and-hold thesis.
Negotiation context
- It's been on market 43 days — a 3% lower offer ($126k) is reasonable based on typical stale-listing flexibility.
- 4 sale attempts since 6y ago with the ask held roughly flat each time — persistent listings suggest the price (not the market) is what's stuck; bring a comps-based counter.
Risks & watch-outs
- Watch-outs: flood insurance adds $66/mo.
- Climate carrying-cost: major flood risk; severe wind risk, 99% chance of damaging wind over 30y; extreme-heat days projected 7→25/yr by 2055 (HVAC capex compounding) — expect insurance premiums to compound above CPI over the hold.
Questions for the listing agent
- It's been on market 43 days. Have you received any prior offers? Is the seller open to a 3% concession, seller financing, or rate buy-down credit?
- What's the actual annual flood-insurance premium (NFIP or private), and is the property in a SFHA with mandatory coverage?
- Is there a deadline driving the sale (1031 exchange, divorce, estate, relocation)? That informs how much negotiation room exists.
- Schools are D-rated, which usually means shorter tenancies and higher turnover. Who's the typical renter profile here, and what's been the actual vacancy rate?
- What's the average days-on-market for RENTAL listings here right now (not sales)? A rising rental-DOM trend means longer vacancies and softer asking-rent achievability than the comps imply.
- What's the recent tenant-quality profile in this submarket — average credit score on applications, eviction rate, late-payment / NSF rate, and stable-employment percentage? A property-management company in the area should have these aggregated.
- How much new for-sale + rental construction is in the pipeline within 1–3 miles? Heavy new supply typically softens prices + rents 12–24 months out; constrained supply supports both.
Investment metrics
- 1% rule
- 1.34% ✓
- Cap rate
- 10.55%
- Cash-on-cash
- 15.20%
- DSCR
- 1.68
- GRM
- 6.2
CMA / ARV
- ARV (median comp)
- $194,865
- List price
- $130,000
- Delta
- -33.29%
- Verdict
- UNDERPRICED
- Comps
- 20 within 1.0 mi
Show comp detail 8 sales within ~0.75 mi
| Address | Dist | Beds/Ba | Sqft | Sold | Price | $/sf | Match |
|---|---|---|---|---|---|---|---|
| 4519 E 24th St | 0.05mi | 3/2.5 | 1,268 (+15%) | 7mo | $145,000 | $114 | 61 |
| 5027 Hauna Ln | 0.44mi | 3/2.0 | 1,231 (+12%) | 4mo | $209,900 | $171 | 53 |
| 5007 Abbie Ln | 0.39mi | 2/2.0 (-1) | 1,130 (+2%) | 20mo | $212,500 | $188 | 53 |
| 2901 Arkansas Ave | 0.60mi | 3/1.0 | 1,132 (+2%) | 21mo | $199,900 | $177 | 50 |
| 4715 29th St | 0.34mi | 3/2.0 | 1,216 (+10%) | 18mo | $219,900 | $181 | 49 |
| 4906 30th St | 0.48mi | 3/2.0 | 1,208 (+9%) | 13mo | $200,000 | $166 | 47 |
| 3217 Edgewood Dr | 0.62mi | 2/1.0 (-1) | 972 (-12%) | 11mo | $140,000 | $144 | 37 |
| 4416 33rd St | 0.56mi | 4/2.0 (+1) | 1,248 (+13%) | 11mo | $225,000 | $180 | 34 |
Match score weights: distance 35% · size 25% · config 20% · recency 20%. Top-matched comps best support the ARV.
Projected returns pro-forma
-3.0% appreciation · 0.0% rent growth · sell at horizon
- IRR
- -0.7%
- Equity multiple
- 0.97×
- Total profit
- $-963
- Equity at exit
- $19,383
- IRR
- 5.3%
- Equity multiple
- 1.33×
- Total profit
- $12,104
- Equity at exit
- $11,240
Cash invested: $36,400 (down + closing). Projections, not guarantees.
Landlord ↔ Tenant lean methodology
- Overall (STATE)
- 87 Strongly Landlord-Friendly
- State Texas
- 87 Strongly Landlord-Friendly · R+5
- County
- — inherits STATE
- City
- — inherits STATE
ZIP-level market 77539
- Home prices YoY
- -29.8%
- Rents YoY
- -0.1%
- Active inventory
- 664
- Price-to-rent
- 6.2×
Monthly cashflow live
- Estimated rent
- $1,742 high interval (Pro) →
- Mortgage (P&I)
- −$682
- Tax from tax record
- −$179 /mo · $2,153/yr
- Insurance
- −$54
- Flood insurance flood zone
- −$66 /mo · $798/yr
- HOA
- −$0
- Vacancy / Maint / Mgmt
- −$366
- Net cashflow
- $395
Break-even live
UW: 25.0% down · 7.5% · 30yr · 1.5% tax · 5.0% vac · 8.0% maint · 8.0% mgmt
Financing live
Cash to close
- Down payment
- $32,500
- Closing costs
- $3,900
- Reserves months
- —
- Total cash needed
- —
Loan-product check · same deal, 3 products live
Conventional
25% down · 7.5% · 30yr
- Down + closing
- —
- Monthly P&I
- —
- Monthly cashflow
- —
- DSCR
- —
- Eligible?
- —
Personal DTI + credit; lowest rate.
DSCR
20% down · 8.5% · 30yr
- Down + closing
- —
- Monthly P&I
- —
- Monthly cashflow
- —
- DSCR
- —
- Eligible?
- —
No personal income docs; deal must DSCR.
Hard money
10% down · 12.0% · 12mo
- Down + closing
- —
- Monthly P&I
- —
- Monthly cashflow
- —
- DSCR
- —
- Eligible?
- —
Short-term bridge; refi at stabilization.
Rent comps 15 comps
| Address | Beds | Baths | Sqft | Rent | $/sqft | DOM | Units | Dist |
|---|---|---|---|---|---|---|---|---|
| 5008 Asia Ln Dickinson, TX | 3.0 | 2.0 | 1475 | $1,739 | $1.18 | 12d | 1 | 0.38mi |
| 5015 Akumal Calle Dickinson, TX | 2.0 | 2.5 | 1132 | $1,650 | $1.46 | 43d | 1 | 0.42mi |
| 2147 Aruba Calle Dickinson, TX | 2.0 | 2.0 | 1069 | $1,550 | $1.45 | 17d | 1 | 0.42mi |
| 2130 Saint Lucia Calle Dickinson, TX | 2.0 | 2.5 | 1272 | $1,550 | $1.22 | 17d | 1 | 0.47mi |
| 2106 Saint Lucia Calle Dickinson, TX | 2.0 | 2.5 | 1272 | $1,550 | $1.22 | 3d | 1 | 0.48mi |
| 3206 Teakwood Cir Dickinson, TX | 3.0 | 2.0 | 1323 | $1,915 | $1.45 | 22d | 1 | 0.49mi |
| 5049 Hauna Ln Dickinson, TX | 3.0 | 2.0 | 1272 | $1,795 | $1.41 | 3d | 1 | 0.52mi |
| 5101 Coba Calle Dickinson, TX | 3.0 | 2.0 | 1140 | $1,500 | $1.32 | 43d | 1 | 0.58mi |
| 5098 Akumal Calle Dickinson, TX | 2.0 | 2.5 | 1272 | $1,700 | $1.34 | 4d | 1 | 0.63mi |
| 5102 Akumal Calle Dickinson, TX | 2.0 | 2.5 | 1132 | $1,450 | $1.28 | 43d | 1 | 0.64mi |
| 5139 Martinique Calle Dickinson, TX | 3.0 | 2.0 | 1140 | $1,750 | $1.54 | 4d | 1 | 0.70mi |
| 3011 FM 517 Rd E Dickinson, TX | 2.0 | 1.0 | 1050 | $1,300 | $1.24 | 43d | 1 | 1.21mi |
| 3011 FM 517 Rd E Unit 3015 Dickinson, TX | 2.0 | 1.0 | 1050 | $1,300 | $1.24 | 43d | 1 | 1.21mi |
| 5419 FM 517 Rd E Dickinson, TX | 1.0–2.0 | 1.0–2.5 | 957 | $1,500 | $1.57 | 20d | 8 | 1.33mi |
| 5601 FM 517 Rd E Dickinson, TX | 1.0–3.0 | 1.0–2.0 | 922 | $1,459 | $1.58 | 2d | 4 | 1.41mi |
Listing history 33 events
-
2026-06-18days on market $130,000 Active 43 DOM
-
2026-06-17days on market $130,000 Active 42 DOM
-
2026-06-16days on market $130,000 Active 41 DOM
-
2026-06-15days on market $130,000 Active 40 DOM
-
2026-06-13days on market $130,000 Active 38 DOM
-
2026-06-09days on market $130,000 Active 34 DOM
-
2026-06-08days on market $130,000 Active 33 DOM
-
2026-06-07days on market $130,000 Active 32 DOM
-
2026-06-04days on market $130,000 Active 29 DOM
-
2026-06-03days on market $130,000 Active 28 DOM
-
2026-06-02days on market $130,000 Active 27 DOM
-
2026-06-01days on market $130,000 Active 26 DOM
-
2026-05-31days on market $130,000 Active 25 DOM
-
2026-05-06$130,000 Active 487-char remark
-
2026-04-30status Pending
-
2026-04-25status Pending
-
2026-04-18status Pending
-
2026-04-10status Pending
-
2026-04-10historical
-
2026-03-16price $139,000
-
2026-02-09price $149,000
-
2026-02-04$154,500 Active
-
2026-02-04historical
-
2026-01-08price $157,000
-
2025-12-08price $165,000
-
2025-10-30price $172,000
-
2025-10-01price $179,000
-
2025-09-05$189,000 Active
-
2020-03-04soldstatus
-
2020-02-27soldstatus Sold
-
2020-02-06status Pending
-
2020-01-29status Option Pending
-
2020-01-17$104,000 Active
ⓘ Source: listings_history table (triggers on properties + properties_extension) + one-shot
backfill from property_details.listing_events for pre-trigger history.
Tax reassessment forecast TX · Resets to sale price
- Current annual tax
- $2,153 · $179/mo
- Projected year-2 tax
- $2,379 · $198/mo
- Expected delta
- +$226/yr (+$19/mo · 10.5%)
ⓘ Screening estimate from a state-policy table — verify with the county assessor before closing.
Climate risk First Street
- Flood 7/10 Severe FEMA zone X (shaded) · 75% chance over 30 yrs
- Wildfire 1/10 Low
- Heat 10/10 Extreme 7 d/yr ≥110°F today · 25 d/yr by 30 yrs out
- Wind 9/10 Extreme 99% chance of damaging wind over 30 yrs
- Air quality 2/10 Low 1 unhealthy d/yr today · 1 by 30 yrs out
Nearby sold comps map
Loading sold comps map…
Walkable amenities ~0.75 mi
Loading nearby amenities…
Taxation est. · year 1
- Rental income
- $20,906
- − Mortgage interest
- −$7,282
- − Property taxes
- −$2,153
- − Insurance
- −$1,448
- − Repairs & maintenance
- −$1,673
- − Management
- −$1,673
- − Depreciation
- −$3,782
- Taxable income
- $2,897
- Est. tax owed @ 24.0%
- −$695
- After-tax cash flow
- $4,040/yr
For passive investors: Depreciation is non-cash, so a rental often shows a tax loss while cash-flowing — sheltering income. Rental losses are passive: they offset passive income freely, and up to $25,000/yr can offset ordinary (W-2) income if you actively participate and your MAGI is under $100k (phasing out to $0 by $150k); unused losses carry forward. On sale, claimed depreciation is recaptured at up to 25%, and gains may owe capital-gains tax (a 1031 exchange can defer both). Figures are a year-1 estimate at your 24.0% rate — not tax advice; consult a CPA.
Schools (NCES district)
- District
- Dickinson ISD
- NCES district ID
- 4817070
- Math proficiency
- 39% ▼ -11.00%
- Reading proficiency
- 40% ▼ -2.00%
- Median HH income
- $61,318
- Composite
- 35.16/100
- National rank
- #5005
- State rank
- #366 of 826 in TX
Livability — Dickinson
- Score
- 67/100
- State rank
- #533
- US rank
- #10431
Category grades
Schools grade is shown separately in the Schools card above.
Census & demographics
- County
- Galveston County · 357,330 people
- City population
- 49,375
- Metro
- Houston-The Woodlands-Sugar Land, TX
- Population (ZIP)
- 49,375
- Household income
- $89,111
- Rent vs Own
- Severe rent burden
- 869.0
Population outlook (Galveston County) Hauer SSP2
- Today (2025)
- 390,640 people
- By 2030
- 425,226 · +8.9%
- By 2040
- 493,765 · +26.4%
- By 2050
- 559,698 · +43.3%
- By 2075
- 719,260 · +84.1%
- By 2100
- 819,628 · +109.8%
Race, ethnicity, and origin ACS 2023
- Neighborhood character
- Diverse neighborhood (Simpson 0.64)
- Race & ethnicity
- White 47% Hispanic / Latino 37% Two or more races 19% Black 10% Asian 3%
- Hispanic origin (detail)
- Mexican 29% Puerto Rican 2%
- Common ancestry
- Italian 3% Romanian 2% Lithuanian 1%
- Foreign-born
- 13% · Canada, Vietnam
- Languages at home
- 73% English-only · Spanish 24% Vietnamese 1% Other Indo-European 1%
Political lean MEDSL · Galveston
- 2024 margin
- Strong R (+27.4) · D 35.7% · R 63.1% · Other 1.2%
- 2008→2024 swing
- -7.9pp toward R · 2008: -19.5pp · 2024: -27.4pp
- All cycles
- 2024: R+27.4 2020: R+22.6 2016: R+22.6 2012: R+26.9 2008: R+19.5
Not yet ingested
- Civics
- —
Market trends
- HPI YoY
- ▼ -109.46%
- Current HPI
- 258.0104
- Rent YoY
- ▼ -0.12%
- Metro
- Houston-The Woodlands-Sugar Land, TX
- State GDP YoY
- ▲ 3.95%
- F500 in state
- 110
Industry mix (Fortune 500 HQ in TX)
| Industry | F500 HQs | Revenue |
|---|---|---|
| Energy | 16 | $1,198B |
|
||
| Technology | 5 | $198B |
|
||
| Engineering / Construction | 4 | $72B |
|
||
| Energy Services | 3 | $60B |
|
||
| Utilities | 3 | $41B |
|
||
| Healthcare | 2 | $330B |
|
||
Price history
+25.0% since first listed20 events — show timeline
- 2026-05-06 Listed $130,000 HARMLS
- 2026-04-30 Pending — HARMLS
- 2026-04-25 Pending — HARMLS
- 2026-04-18 Pending — HARMLS
- 2026-04-10 Pending — HARMLS
- 2026-04-10 Listing Removed — HARMLS
- 2026-03-16 Price Changed $139,000 HARMLS
- 2026-02-09 Price Changed $149,000 HARMLS
- 2026-02-04 Listing Removed — HARMLS
- 2026-02-04 Listed $154,500 HARMLS
- 2026-01-08 Price Changed $157,000 HARMLS
- 2025-12-08 Price Changed $165,000 HARMLS
- 2025-10-30 Price Changed $172,000 HARMLS
- 2025-10-01 Price Changed $179,000 HARMLS
- 2025-09-05 Listed $189,000 HARMLS
- 2020-03-04 Sold (Public Records) — Public Records
- 2020-02-27 Sold (MLS) — HARMLS
- 2020-02-06 Pending — HARMLS
- 2020-01-29 Pending — HARMLS
- 2020-01-17 Listed $104,000 HARMLS
Property tax history
+7.3%/yrLatest (2025): $2,153 · -0.8% YoY. Source: county tax records.
Cash-flow waterfall
monthlySold comps — $/sqft
last 12 mo · ≤1 miLoading sold comps…