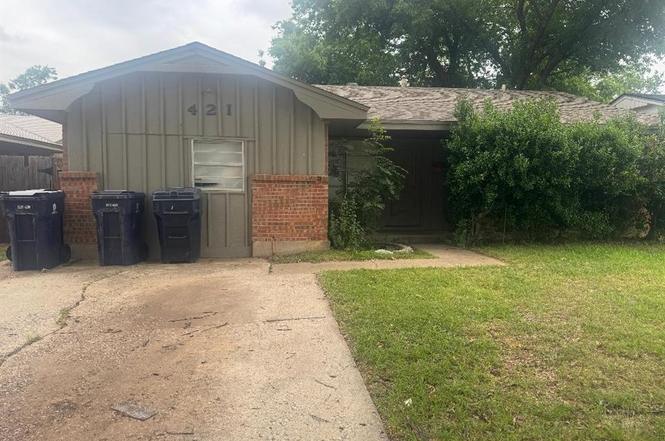
421 NW 81st St · Oklahoma City, OK
Flood risk 1/10 · Minimal
- FEMA flood zone
- X (unshaded)
- Chance of flooding over 30 yrs
- 0.0%
- Est. flood insurance / yr
- $507 – $1,088
Fire risk 3/10 · Minor
- Est. fire insurance / yr
- $2,463 – $4,575
Heat risk 6/10 · Moderate
- Hot days now (above 107°F)
- 7 days/yr
- Hot days in 30 yrs
- 19 days/yr
Wind risk 2/10 · Minimal
- Chance of severe wind over 30 yrs
- 3.0%
Air-quality risk 2/10 · Minimal
- Unhealthy air days now
- 2 days/yr
- Unhealthy air days in 30 yrs
- 2 days/yr
Risk factors via First Street. Map © Google.
Why this score? — see what drove the C+ grade
The composite is a weighted blend of 9 inputs, each scored 0–100. Each bar is that input's sub-score; the figure is the points it added to the 100-point composite (weight × sub-score).
- Cash flow +25.1/30.0
- ARV discount +14.4/15.0
- DSCR +8.2/10.0
- 1% rule +5.6/10.0
- Livability +4.0/5.0
- Rent growth +3.4/5.0
- Condition / age +2.5/5.0
- Schools +0.7/10.0
- Appreciation +0.0/10.0
$115,000
🖨 Deal sheet 📄 Offer letter ✓ Due diligence
Listing remarks MLS
New Price! A great bargain and a great investor property. Square footage breakdown: Converted garage, 336 sf, House, 912 sf, 'as is' condition.
Key facts
- Garage conversion
- Fenced yard
- Covered patio
Tags
Property features AI
Finance
- HOA & community: No mandatory association dues
Exterior
- Parking: Concrete parking
- Utilities: Electricity available; Natural gas available; Public water/sewer
- Home design: Single family residence; One level; South-facing
- Construction: Brick and frame construction; Composition roof; Slab foundation; Existing property
- Exterior features: Covered patio; Chain link fence; Interior lot
Interior
- Kitchen: Dishwasher; Refrigerator; Electric freestanding range/oven
- Bedrooms: 3 bedrooms
- Flooring: Carpet; Vinyl
- Bathrooms: 1 full bathroom; 1 half bathroom
- Interior features: Two living areas; Inside utility; Eating space off the kitchen; No fireplace
- Laundry & utility: Inside utility
Neighborhood map
What this means for you Summary
Snapshot
- This is a 3-bed/2.0-bath single-family listed at $115k.
Deal economics
- At list price, monthly cash flow is $255 ($3k/yr) — positive.
- The deal already cash-flows at list — no discount required.
- Meets the 1% rule at list price ($1k rent vs $115k).
- Cap rate 8.9% vs local median 3.7% in Oklahoma City — top-decile yield for the area; either an underpriced asset or a hidden risk that comps aren't pricing in. Stress-test before assuming the spread holds.
Location & tenants
- Location reads 80/100 on livability (#3 in OK, #1,635 nationally) — a professional / high-income tenant draw. Strengths: amenities A+, commute A+, cost of living A+; Watch: crime F.
- Oklahoma City (urban): math 7% / reading 10% proficiency, ranked #254 of 270 in OK (top 94%) — low school quality limits family demand, transient renter base, plan for 1-2y turnover; 82% free/reduced lunch — lower-income household profile, screen leases tightly.
- Zoned schools: Nichols Hills Es (math 17% / reading 17%, grade F, #540 of 845 statewide, top 68%, 494 students, 0% FRL); John Marshall Hs (math 2% / reading 8%, grade F, #430 of 447 statewide, top 99%, 829 students, 0% FRL) — zoned schools average 0% FRL vs 82% district-wide (82 pts lower); this property's tenant base skews higher-income than the district average.
- Market conditions: Rents rising (+3.5%/yr); 145 active listings in the ZIP; 19 comparable units currently listed for rent nearby; rentals at typical pace (median 20d on market — plan ~3-4 weeks tenant-placement turnaround); 5,365 units permitted in Oklahoma County in 2024 (569 in 5+ unit buildings).
Forward outlook
- Local home prices are declining (-3.0%/yr); year-one equity from $795 of loan paydown is wiped out by about $3k of value loss. Plan a longer hold.
- Oklahoma County population projected at +41% by 2050 — long-run rental-demand tailwind backs the buy-and-hold thesis.
Negotiation context
- Only 1 days on market — expect competitive offers; lowballing is unlikely to land.
- 3 sale attempts since 21y ago with the ask held roughly flat each time — persistent listings suggest the price (not the market) is what's stuck; bring a comps-based counter.
- Current owner paid $40k; list at $115k implies a 191% gain — meaningful room to come down on a strong offer.
Risks & watch-outs
- Climate carrying-cost: extreme-heat days projected 7→19/yr by 2055 (HVAC capex compounding) — expect insurance premiums to compound above CPI over the hold.
Questions for the listing agent
- Built in 1963 — when were the roof, HVAC, electrical panel, plumbing, and water heater last replaced?
- Is there a deadline driving the sale (1031 exchange, divorce, estate, relocation)? That informs how much negotiation room exists.
- Schools are F-rated, which usually means shorter tenancies and higher turnover. Who's the typical renter profile here, and what's been the actual vacancy rate?
- Crime grade is F in this area — have there been break-ins, vandalism, or insurance claims at this property in the last 3 years? What carrier currently insures it and at what premium?
- What's the average days-on-market for RENTAL listings here right now (not sales)? A rising rental-DOM trend means longer vacancies and softer asking-rent achievability than the comps imply.
- What's the recent tenant-quality profile in this submarket — average credit score on applications, eviction rate, late-payment / NSF rate, and stable-employment percentage? A property-management company in the area should have these aggregated.
- How much new for-sale + rental construction is in the pipeline within 1–3 miles? Heavy new supply typically softens prices + rents 12–24 months out; constrained supply supports both.
Investment metrics
- 1% rule
- 1.06% ✓
- Cap rate
- 8.95%
- Cash-on-cash
- 9.49%
- DSCR
- 1.42
- GRM
- 7.8
CMA / ARV
- ARV (on-the-fly)
- $135,888
- Comps found
- 12
Show comp detail 12 sales within ~0.75 mi
| Address | Dist | Beds/Ba | Sqft | Sold | Price | $/sf | Match |
|---|---|---|---|---|---|---|---|
| 416 NW 81st St | 0.03mi | 3/1.5 | 951 (+4%) | 10mo | $120,000 | $126 | 81 |
| 305 NW 82nd St | 0.16mi | 3/1.5 | 928 (+2%) | 18mo | $137,500 | $148 | 73 |
| 728 NW 87th St | 0.44mi | 2/1.0 (-1) | 894 (-2%) | 0mo | $135,000 | $151 | 67 |
| 321 NW 79th St | 0.17mi | 3/1.5 | 940 (+3%) | 23mo | $139,900 | $149 | 65 |
| 112 NW 82nd St | 0.39mi | 2/1.0 (-1) | 933 (+2%) | 9mo | $134,000 | $144 | 61 |
| 740 NW 87th St | 0.46mi | 2/2.0 (-1) | 974 (+7%) | 2mo | $160,000 | $164 | 60 |
| 317 NW 85th St | 0.29mi | 3/1.5 | 1,038 (+14%) | 11mo | $160,000 | $154 | 52 |
| 904 Westchester Dr | 0.73mi | 3/1.0 | 980 (+8%) | 1mo | $155,000 | $158 | 48 |
| 217 NW 88th St | 0.53mi | 3/2.0 | 1,043 (+14%) | 9mo | $139,500 | $134 | 44 |
| 606 NW 91st St | 0.63mi | 3/1.0 | 960 (+5%) | 23mo | $132,000 | $138 | 38 |
| 741 NW 90th St | 0.65mi | 2/1.0 (-1) | 976 (+7%) | 21mo | $98,000 | $100 | 31 |
| 708 NW 91st St | 0.66mi | 2/1.0 (-1) | 1,042 (+14%) | 22mo | $159,900 | $153 | 18 |
Match score weights: distance 35% · size 25% · config 20% · recency 20%. Top-matched comps best support the ARV.
Projected returns pro-forma
-3.0% appreciation · 3.47% rent growth · sell at horizon
- IRR
- -1.5%
- Equity multiple
- 0.94×
- Total profit
- $-1,875
- Equity at exit
- $17,147
- IRR
- 8.6%
- Equity multiple
- 1.67×
- Total profit
- $21,516
- Equity at exit
- $9,943
Cash invested: $32,200 (down + closing). Projections, not guarantees.
Landlord ↔ Tenant lean methodology
- Overall (STATE)
- 83 Strongly Landlord-Friendly
- State Oklahoma
- 83 Strongly Landlord-Friendly · R+20
- County
- — inherits STATE
- City
- — inherits STATE
ZIP-level market 73114
- Home prices YoY
- -12.5%
- Rents YoY
- 3.5%
- Active inventory
- 145
- Price-to-rent
- 7.8×
Monthly cashflow live
- Estimated rent
- $1,223 high interval (Pro) →
- Mortgage (P&I)
- −$603
- Tax from tax record
- −$60 /mo · $723/yr
- Insurance
- −$48
- HOA
- −$0
- Vacancy / Maint / Mgmt
- −$257
- Net cashflow
- $255
Break-even live
UW: 25.0% down · 7.5% · 30yr · 1.5% tax · 5.0% vac · 8.0% maint · 8.0% mgmt
Financing live
Cash to close
- Down payment
- $28,750
- Closing costs
- $3,450
- Reserves months
- —
- Total cash needed
- —
Loan-product check · same deal, 3 products live
Conventional
25% down · 7.5% · 30yr
- Down + closing
- —
- Monthly P&I
- —
- Monthly cashflow
- —
- DSCR
- —
- Eligible?
- —
Personal DTI + credit; lowest rate.
DSCR
20% down · 8.5% · 30yr
- Down + closing
- —
- Monthly P&I
- —
- Monthly cashflow
- —
- DSCR
- —
- Eligible?
- —
No personal income docs; deal must DSCR.
Hard money
10% down · 12.0% · 12mo
- Down + closing
- —
- Monthly P&I
- —
- Monthly cashflow
- —
- DSCR
- —
- Eligible?
- —
Short-term bridge; refi at stabilization.
Rent comps 19 comps
| Address | Beds | Baths | Sqft | Rent | $/sqft | DOM | Units | Dist |
|---|---|---|---|---|---|---|---|---|
| 1025 NW 86th St Oklahoma City, OK | 2.0 | 1.5 | 1100 | $1,000 | $0.91 | 43d | 1 | 0.55mi |
| 745 NW 89th St Oklahoma City, OK | 3.0 | 1.0 | 1000 | $1,275 | $1.27 | 1d | 1 | 0.60mi |
| 333 NW 90th St Oklahoma City, OK | 3.0 | 1.5 | 1053 | $1,350 | $1.28 | 43d | 1 | 0.63mi |
| 9111 N Walker Ave Oklahoma City, OK | 3.0 | 1.5 | 1092 | $1,195 | $1.09 | 1d | 1 | 0.63mi |
| 1133 NW 84th St Oklahoma City, OK | 3.0 | 1.0 | 884 | $1,150 | $1.30 | 23d | 1 | 0.65mi |
| 1214 NW 81st St Oklahoma City, OK | 3.0 | 1.0 | 1100 | $1,350 | $1.23 | 1d | 1 | 0.74mi |
| 8500 N Oklahoma Ave Oklahoma City, OK | 3.0 | 1.0–2.0 | 954 | $2,503 | $2.62 | 1d | 23 | 0.74mi |
| 413 W Britton Rd Oklahoma City, OK | 2.0 | 1.0 | 912 | $840 | $0.92 | 20d | 1 | 0.87mi |
| 413 W Britton Rd Oklahoma City, OK | 2.0 | 1.0 | 912 | $840 | $0.92 | 23d | 1 | 0.87mi |
| 1016 NW 67th St Oklahoma City, OK | 2.0 | 1.0–2.0 | 708 | $2,395 | $3.38 | 1d | 6 | 1.03mi |
| 701 E Wilshire Blvd Oklahoma City, OK | 1.0–3.0 | 1.0 | 850 | $1,029 | $1.21 | 2d | 3 | 1.15mi |
| 1435 NW 91st St Oklahoma City, OK | 2.0 | 1.5 | 1090 | $1,000 | $0.92 | 43d | 1 | 1.18mi |
| 1434 NW 92nd St Unit 3 Oklahoma City, OK | 2.0 | 1.5 | 950 | $915 | $0.96 | 43d | 1 | 1.20mi |
| 911 NW 98th St Oklahoma City, OK | 3.0 | 1.0 | 1122 | $1,100 | $0.98 | 1d | 1 | 1.23mi |
| 1441 NW 92nd St Oklahoma City, OK | 1.0–2.0 | 1.0 | 725 | $850 | $1.17 | 43d | 1 | 1.23mi |
| 1425 NW 94th St Oklahoma City, OK | 2.0 | 1.0 | 816 | $795 | $0.97 | 21d | 1 | 1.31mi |
| 1417 NW 95th St Oklahoma City, OK | 2.0 | 1.0 | 916 | $1,085 | $1.18 | 23d | 1 | 1.34mi |
| 1025 Hoyt Ave Oklahoma City, OK | 4.0 | 1.0 | 884 | $1,150 | $1.30 | 11d | 1 | 1.39mi |
| 910 NW 101st St Oklahoma City, OK | 3.0 | 1.0 | 1100 | $1,400 | $1.27 | 1d | 1 | 1.41mi |
Listing history 2 events
-
2026-06-19remarks 208-char remark
-
2026-06-19$115,000 Active 1 DOM
ⓘ Source: listings_history table (triggers on properties + properties_extension) + one-shot
backfill from property_details.listing_events for pre-trigger history.
Tax reassessment forecast OK · Resets to sale price
- Current annual tax
- $723 · $60/mo
- Projected year-2 tax
- $1,035 · $86/mo
- Expected delta
- +$312/yr (+$26/mo · 43.1%)
ⓘ Screening estimate from a state-policy table — verify with the county assessor before closing.
Climate risk First Street
- Flood 1/10 Low FEMA zone X (unshaded) · 0% chance over 30 yrs
- Wildfire 3/10 Moderate
- Heat 6/10 Major 7 d/yr ≥107°F today · 19 d/yr by 30 yrs out
- Wind 2/10 Low 3% chance of damaging wind over 30 yrs
- Air quality 2/10 Low 2 unhealthy d/yr today · 2 by 30 yrs out
Nearby sold comps map
Loading sold comps map…
Walkable amenities ~0.75 mi
Loading nearby amenities…
Taxation est. · year 1
- Rental income
- $14,671
- − Mortgage interest
- −$6,442
- − Property taxes
- −$723
- − Insurance
- −$575
- − Repairs & maintenance
- −$1,174
- − Management
- −$1,174
- − Depreciation
- −$3,345
- Taxable income
- $1,238
- Est. tax owed @ 24.0%
- −$297
- After-tax cash flow
- $2,757/yr
For passive investors: Depreciation is non-cash, so a rental often shows a tax loss while cash-flowing — sheltering income. Rental losses are passive: they offset passive income freely, and up to $25,000/yr can offset ordinary (W-2) income if you actively participate and your MAGI is under $100k (phasing out to $0 by $150k); unused losses carry forward. On sale, claimed depreciation is recaptured at up to 25%, and gains may owe capital-gains tax (a 1031 exchange can defer both). Figures are a year-1 estimate at your 24.0% rate — not tax advice; consult a CPA.
Schools (NCES district)
- District
- Oklahoma City
- NCES district ID
- 4022770
- Math proficiency
- 7% ▼ -5.00%
- Reading proficiency
- 10% ▼ -6.00%
- Median HH income
- $35,606
- Composite
- 7.0/100
- National rank
- #9970
- State rank
- #254 of 270 in OK
Livability — Oklahoma City
- Score
- 80/100
- State rank
- #3
- US rank
- #1635
Category grades
Schools grade is shown separately in the Schools card above.
Census & demographics
- Census place
- Oklahoma City, OK
- County
- Oklahoma County · 771,644 people
- City population
- 498,656
- Metro
- Oklahoma City, OK
- Population (ZIP)
- 17,656
- Household income
- $54,936
- Rent vs Own
- Severe rent burden
- 1035.0
Population outlook (Oklahoma County) Hauer SSP2
- Today (2025)
- 911,875 people
- By 2030
- 982,413 · +7.7%
- By 2040
- 1,130,468 · +24.0%
- By 2050
- 1,288,422 · +41.3%
- By 2075
- 1,711,482 · +87.7%
- By 2100
- 2,088,448 · +129.0%
Race, ethnicity, and origin ACS 2023
- Neighborhood character
- Highly diverse neighborhood (Simpson 0.71)
- Race & ethnicity
- Black 41% White 29% Hispanic / Latino 20% Two or more races 12% Native American 3%
- Hispanic origin (detail)
- Mexican 16% Puerto Rican 1%
- Common ancestry
- Russian 1% Slovak 1% Italian 1%
- Foreign-born
- 12% · Canada, Jamaica
- Languages at home
- 78% English-only · Spanish 18%
Political lean MEDSL · Oklahoma
- 2024 margin
- Toss-up / Even · D 48.0% · R 49.7% · Other 2.3%
- 2008→2024 swing
- +15.1pp toward D · 2008: -16.8pp · 2024: -1.7pp
- All cycles
- 2024: R+1.7 2020: R+1.1 2016: R+10.5 2012: R+16.7 2008: R+16.8
Not yet ingested
- Civics
- —
Market trends
- HPI YoY
- ▼ -44.26%
- Current HPI
- 310.4705
- Rent YoY
- ▲ 3.47%
- Metro
- Oklahoma City, OK
- State GDP YoY
- ▲ 1.55%
- F500 in state
- 6
Industry mix (Fortune 500 HQ in OK)
| Industry | F500 HQs | Revenue |
|---|---|---|
| Energy | 3 | $48B |
|
||
Price history
+144.7% since first listed9 events — show timeline
- 2026-06-13 Listed $115,000 MLSOK
- 2011-02-12 Listing Removed — MLSOK
- 2010-02-11 Listed $42,500 MLSOK
- 2005-09-12 Sold (MLS) $39,500 MLSOK
- 2005-06-24 Listed $41,500 MLSOK
- 2001-02-05 Sold (Public Records) $46,000 Public Records
- 2001-02-05 Sold (Public Records) $46,000 Public Records
- 1992-10-02 Sold (Public Records) $14,700 Public Records
- 1992-04-13 Sold (Public Records) $47,000 Public Records
Property tax history
+4.3%/yrLatest (2025): $723 · +4.2% YoY. Source: county tax records.
Cash-flow waterfall
monthlySold comps — $/sqft
last 12 mo · ≤1 miLoading sold comps…