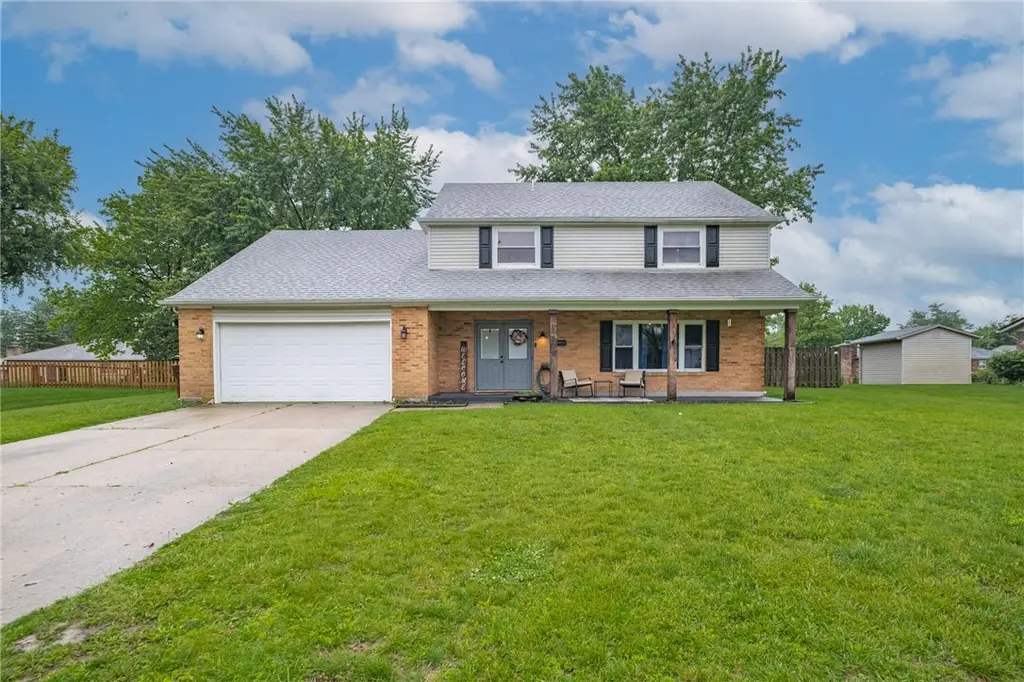
4608 Cutlass Dr · Englewood, OH
Flood risk 1/10 · Minimal
- FEMA flood zone
- X (unshaded)
- Chance of flooding over 30 yrs
- 0.0%
- Est. flood insurance / yr
- $507 – $1,088
Fire risk 1/10 · Minimal
- Est. fire insurance / yr
- $713 – $1,323
Heat risk 3/10 · Minor
- Hot days now (above 101°F)
- 7 days/yr
- Hot days in 30 yrs
- 18 days/yr
Wind risk 2/10 · Minimal
- Chance of severe wind over 30 yrs
- —
Air-quality risk 3/10 · Minor
- Unhealthy air days now
- 3 days/yr
- Unhealthy air days in 30 yrs
- 4 days/yr
Risk factors via First Street. Map © Google.
Why this score? — see what drove the C- grade
The composite is a weighted blend of 9 inputs, each scored 0–100. Each bar is that input's sub-score; the figure is the points it added to the 100-point composite (weight × sub-score).
- Cash flow +18.1/30.0
- ARV discount +8.9/15.0
- DSCR +5.7/10.0
- 1% rule +5.0/10.0
- Schools +5.0/10.0
- Livability +3.5/5.0
- Condition / age +2.5/5.0
- Rent growth +2.4/5.0
- Appreciation +0.0/10.0
$269,900
🖨 Deal sheet 📄 Offer letter ✓ Due diligence
Listing remarks
Welcome to 4608 Cutlass Drive in Englewood! This spacious two-story home offers 2,176 square feet of comfortable living space with a functional layout designed for both everyday living and entertaining. Featuring 5 bedrooms, 2 full bathrooms, and 1 half bath, this home provides plenty of room to spread out and enjoy. The updated kitchen is a standout with stylish butcher block countertops, ample cabinet space, and a warm, inviting feel perfect for gathering with family and friends. Multiple living spaces include both a formal living room and a cozy family room, giving you flexibility for entertaining or relaxing. Major updates include a new HVAC system installed in 2025, offering peace of m
Key facts
- Covered patio
- Updated kitchen
- Fenced backyard
Tags
Property features AI
Finance
- Financial info: Offered for sale
Exterior
- Parking: Attached two-car garage with garage door opener
- Security: Smoke detectors
- Utilities: Public water; Public sewer; Cable available
- Home design: Two-story house; Brick and vinyl siding exterior
- Construction: Slab foundation
- Exterior features: Fenced yard; Front porch; Patio
Interior
- Kitchen: Butcher block counters (kitchen)
- Bathrooms: Two full bathrooms; One half bathroom; One main-level bathroom
- Heating & cooling: Heat pump heating; Electric heating; Heat pump cooling (central)
- Interior features: Butcher block counters; High-speed internet available; Recently remodeled; Vinyl window frames; Electric fireplace insert
- Laundry & utility: Electric water heater
Neighborhood map
What this means for you Summary
Snapshot
- This is a 5-bed/2.5-bath single-family listed at $270k.
Deal economics
- At list price, monthly cash flow is $238 ($3k/yr) — positive.
- The deal already cash-flows at list — no discount required.
- Meets the 1% rule at list price ($3k rent vs $270k).
- Cap rate 7.4% vs local median 5.3% in Englewood — top-decile yield for the area; either an underpriced asset or a hidden risk that comps aren't pricing in. Stress-test before assuming the spread holds.
Location & tenants
- Location reads 69/100 on livability (#517 in OH) — a middle-class / working-renter tenant base. Strengths: cost of living A+, housing A+, schools A; Watch: employment C-, amenities F, commute F.
- Northmont City (suburban): math 52% / reading 62% proficiency, ranked #318 of 656 in OH (top 48%) — acceptable for families but not a draw, mixed tenant base, ~2y average lease.
- Market conditions: Rents soft (-0.5%/yr); 88 active listings in the ZIP; 3 comparable units currently listed for rent nearby; rentals at typical pace (median 19d on market — plan ~3-4 weeks tenant-placement turnaround); solid renter incomes; 907 units permitted in Montgomery County in 2024 (416 in 5+ unit buildings).
- This rent runs 43% of the median local income ($75k/yr) — at the standard rent-burdened threshold; future hikes will face affordability resistance.
Forward outlook
- Local home prices are declining (-3.0%/yr); year-one equity from $2k of loan paydown is wiped out by about $8k of value loss. Plan a longer hold.
- Montgomery County population projected at -10% by 2050 — secular population decline; favor cash flow + early exit over multi-decade hold.
Negotiation context
- Only 1 days on market — expect competitive offers; lowballing is unlikely to land.
Questions for the listing agent
- Built in 1973 — when were the roof, HVAC, electrical panel, plumbing, and water heater last replaced?
- Is there a deadline driving the sale (1031 exchange, divorce, estate, relocation)? That informs how much negotiation room exists.
- Schools are A-rated — typically a magnet for longer-tenancy family renters. What's the average tenant stay here, and is there a school-zone premium baked into asking?
- What's the average days-on-market for RENTAL listings here right now (not sales)? A rising rental-DOM trend means longer vacancies and softer asking-rent achievability than the comps imply.
- What's the recent tenant-quality profile in this submarket — average credit score on applications, eviction rate, late-payment / NSF rate, and stable-employment percentage? A property-management company in the area should have these aggregated.
- How much new for-sale + rental construction is in the pipeline within 1–3 miles? Heavy new supply typically softens prices + rents 12–24 months out; constrained supply supports both.
Investment metrics
- 1% rule
- 1.00% ✓
- Cap rate
- 7.35%
- Cash-on-cash
- 3.79%
- DSCR
- 1.17
- GRM
- 8.3
CMA / ARV
- ARV (on-the-fly)
- $278,528
- Comps found
- 12
Show comp detail 12 sales within ~0.75 mi
| Address | Dist | Beds/Ba | Sqft | Sold | Price | $/sf | Match |
|---|---|---|---|---|---|---|---|
| 4020 Caprice Rd | 0.22mi | 4/2.5 (-1) | 2,098 (-4%) | 2mo | $269,900 | $129 | 77 |
| 4230 Pleasanton Rd | 0.29mi | 4/2.5 (-1) | 2,074 (-5%) | 1mo | $306,000 | $148 | 73 |
| 4023 Loop Dr | 0.24mi | 5/2.5 | 2,385 (+10%) | 1mo | $289,900 | $122 | 72 |
| 4030 Gateway Dr | 0.23mi | 4/2.5 (-1) | 2,053 (-6%) | 4mo | $263,000 | $128 | 72 |
| 4243 Glenayre Dr | 0.46mi | 4/2.5 (-1) | 2,142 (-2%) | 1mo | $260,000 | $121 | 70 |
| 7000 Kinsey Rd | 0.27mi | 4/2.5 (-1) | 2,361 (+8%) | 7mo | $289,000 | $122 | 62 |
| 4172 Gorman Ave | 0.55mi | 4/2.5 (-1) | 2,105 (-3%) | 2mo | $300,000 | $143 | 62 |
| 7012 Stillmore Dr | 0.54mi | 4/2.5 (-1) | 2,278 (+5%) | 3mo | $269,900 | $118 | 59 |
| 7106 Cranlyn Dr | 0.19mi | 4/2.5 (-1) | 1,854 (-15%) | 3mo | $257,500 | $139 | 59 |
| 6811 Kinsey Rd | 0.30mi | 4/2.5 (-1) | 1,950 (-10%) | 9mo | $249,000 | $128 | 56 |
| 1024 Meadow Thrush Dr | 0.49mi | 4/3.0 (-1) | 2,405 (+10%) | 6mo | $304,900 | $127 | 47 |
| 7013 Woodcroft Dr | 0.57mi | 4/2.5 (-1) | 1,868 (-14%) | 0mo | $265,000 | $142 | 44 |
Match score weights: distance 35% · size 25% · config 20% · recency 20%. Top-matched comps best support the ARV.
Projected returns pro-forma
-3.0% appreciation · 0.0% rent growth · sell at horizon
- IRR
- -13.8%
- Equity multiple
- 0.52×
- Total profit
- $-36,412
- Equity at exit
- $40,243
- IRR
- -10.8%
- Equity multiple
- 0.44×
- Total profit
- $-42,531
- Equity at exit
- $23,336
Cash invested: $75,572 (down + closing). Projections, not guarantees.
Landlord ↔ Tenant lean methodology
- Overall (STATE)
- 73 Landlord-Friendly
- State Ohio
- 73 Landlord-Friendly · R+6
- County
- — inherits STATE
- City
- — inherits STATE
ZIP-level market 45322
- Rents YoY
- -0.5%
- Active inventory
- 88
- Price-to-rent
- 8.3×
Monthly cashflow live
- Estimated rent
- $2,704 medium interval (Pro) →
- Mortgage (P&I)
- −$1,415
- Tax from tax record
- −$370 /mo · $4,441/yr
- Insurance
- −$112
- HOA
- −$0
- Vacancy / Maint / Mgmt
- −$568
- Net cashflow
- $238
Break-even live
UW: 25.0% down · 7.5% · 30yr · 1.5% tax · 5.0% vac · 8.0% maint · 8.0% mgmt
Financing live
Cash to close
- Down payment
- $67,475
- Closing costs
- $8,097
- Reserves months
- —
- Total cash needed
- —
Loan-product check · same deal, 3 products live
Conventional
25% down · 7.5% · 30yr
- Down + closing
- —
- Monthly P&I
- —
- Monthly cashflow
- —
- DSCR
- —
- Eligible?
- —
Personal DTI + credit; lowest rate.
DSCR
20% down · 8.5% · 30yr
- Down + closing
- —
- Monthly P&I
- —
- Monthly cashflow
- —
- DSCR
- —
- Eligible?
- —
No personal income docs; deal must DSCR.
Hard money
10% down · 12.0% · 12mo
- Down + closing
- —
- Monthly P&I
- —
- Monthly cashflow
- —
- DSCR
- —
- Eligible?
- —
Short-term bridge; refi at stabilization.
Rent comps 3 comps
| Address | Beds | Baths | Sqft | Rent | $/sqft | DOM | Units | Dist |
|---|---|---|---|---|---|---|---|---|
| 6701 Whitaker St Dayton, OH | 4.0 | 2.5 | 2487 | $2,800 | $1.13 | 43d | 1 | 0.99mi |
| 5900 Macduff Dr Dayton, OH | 1.0–4.0 | 1.0–2.0 | 1104 | $1,695 | $1.54 | 2d | 17 | 1.28mi |
| 4220 Willow Creek Dr Dayton, OH | 5.0 | 3.0 | 2598 | $3,000 | $1.15 | 19d | 1 | 1.45mi |
Listing history 1 events
-
2026-05-23$269,900 Active
ⓘ Source: listings_history table (triggers on properties + properties_extension) + one-shot
backfill from property_details.listing_events for pre-trigger history.
Tax reassessment forecast OH · Partial reset (capped growth)
- Current annual tax
- $4,441 · $370/mo
- Projected year-2 tax
- $4,441 · $370/mo
- Expected delta
- $0/yr ($0/mo · 0.0%)
ⓘ Screening estimate from a state-policy table — verify with the county assessor before closing.
Climate risk First Street
- Flood 1/10 Low FEMA zone X (unshaded) · 0% chance over 30 yrs
- Wildfire 1/10 Low
- Heat 3/10 Moderate 7 d/yr ≥101°F today · 18 d/yr by 30 yrs out
- Wind 2/10 Low
- Air quality 3/10 Moderate 3 unhealthy d/yr today · 4 by 30 yrs out
Nearby sold comps map
Loading sold comps map…
Walkable amenities ~0.75 mi
Loading nearby amenities…
Taxation est. · year 1
- Rental income
- $32,452
- − Mortgage interest
- −$15,119
- − Property taxes
- −$4,441
- − Insurance
- −$1,350
- − Repairs & maintenance
- −$2,596
- − Management
- −$2,596
- − Depreciation
- −$7,852
- Taxable loss
- −$1,502
- Est. tax savings @ 24.0%
- +$360
- After-tax cash flow
- $3,222/yr
For passive investors: Depreciation is non-cash, so a rental often shows a tax loss while cash-flowing — sheltering income. Rental losses are passive: they offset passive income freely, and up to $25,000/yr can offset ordinary (W-2) income if you actively participate and your MAGI is under $100k (phasing out to $0 by $150k); unused losses carry forward. On sale, claimed depreciation is recaptured at up to 25%, and gains may owe capital-gains tax (a 1031 exchange can defer both). Figures are a year-1 estimate at your 24.0% rate — not tax advice; consult a CPA.
Schools (NCES district)
- District
- Northmont City
- NCES district ID
- 3904872
- Math proficiency
- 52% ▼ -15.00%
- Reading proficiency
- 62% ▼ -8.00%
- Median HH income
- $60,230
- Composite
- 49.53/100
- National rank
- #1995
- State rank
- #318 of 656 in OH
Livability — Englewood
- Score
- 69/100
- State rank
- #517
- US rank
- #8768
Category grades
Schools grade is shown separately in the Schools card above.
Census & demographics
- Census place
- Englewood, OH
- County
- Montgomery County · 459,541 people
- City population
- 20,884
- Metro
- Dayton-Kettering, OH
- Population (ZIP)
- 20,884
- Household income
- $75,349
- Rent vs Own
- Severe rent burden
- 357.0
Population outlook (Montgomery County) Hauer SSP2
- Today (2025)
- 523,241 people
- By 2030
- 514,948 · -1.6%
- By 2040
- 493,378 · -5.7%
- By 2050
- 469,639 · -10.2%
- By 2075
- 418,360 · -20.0%
- By 2100
- 353,315 · -32.5%
Race, ethnicity, and origin ACS 2023
- Neighborhood character
- Predominantly White (80%)
- Race & ethnicity
- White 80% Black 11% Two or more races 6% Hispanic / Latino 3% Asian 1%
- Common ancestry
- Lithuanian 2% Slovak 2% Romanian 1%
- Foreign-born
- 3% · China, Canada
- Languages at home
- 96% English-only · Spanish 2%
Political lean MEDSL · Montgomery
- 2024 margin
- Toss-up / Even · D 49.8% · R 49.3%
- 2008→2024 swing
- -5.8pp toward R · 2008: 6.2pp · 2024: 0.5pp
- All cycles
- 2024: D+0.5 2020: D+2.2 2016: R+1.2 2012: D+3.1 2008: D+6.2
Not yet ingested
- Civics
- —
Market trends
- HPI YoY
- ▼ -176.42%
- Current HPI
- 218.5409
- Rent YoY
- ▼ -0.45%
- Metro
- Dayton-Kettering, OH
- State GDP YoY
- ▲ 1.98%
- F500 in state
- 48
Industry mix (Fortune 500 HQ in OH)
| Industry | F500 HQs | Revenue |
|---|---|---|
| Insurance | 3 | $145B |
|
||
| Industrial Machinery | 3 | $49B |
|
||
| Financial Services | 3 | $24B |
|
||
| Consumer Goods | 2 | $93B |
|
||
| Aerospace / Defense | 2 | $47B |
|
||
| Utilities | 2 | $33B |
|
||
Price history
1 event — show timeline
- 2026-05-23 Listed $269,900 Dayton MLS
Property tax history
+4.9%/yrLatest (2025): $4,441 · +25.5% YoY. Source: county tax records.
Cash-flow waterfall
monthlySold comps — $/sqft
last 12 mo · ≤1 miLoading sold comps…