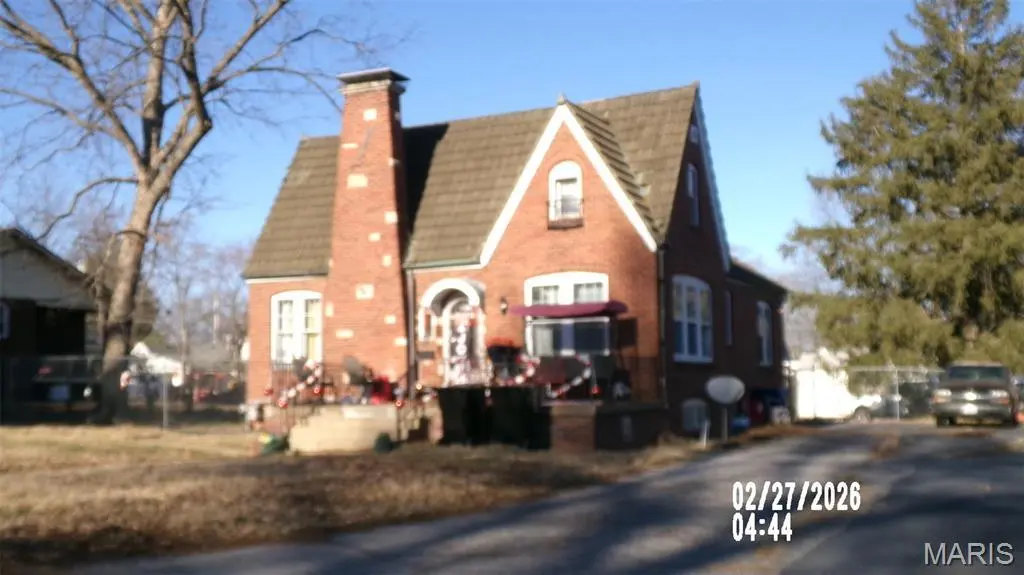
807 Gass Ave · Belleville, IL
Flood risk 1/10 · Minimal
- FEMA flood zone
- X
- Chance of flooding over 30 yrs
- 0.0%
- Est. flood insurance / yr
- $507 – $1,088
Fire risk 1/10 · Minimal
- Est. fire insurance / yr
- $804 – $1,492
Heat risk 5/10 · Moderate
- Hot days now (above 107°F)
- 7 days/yr
- Hot days in 30 yrs
- 21 days/yr
Wind risk 2/10 · Minimal
- Chance of severe wind over 30 yrs
- 1.0%
Air-quality risk 4/10 · Minor
- Unhealthy air days now
- 3 days/yr
- Unhealthy air days in 30 yrs
- 6 days/yr
Risk factors via First Street. Map © Google.
Why this score? — see what drove the D grade
The composite is a weighted blend of 9 inputs, each scored 0–100. Each bar is that input's sub-score; the figure is the points it added to the 100-point composite (weight × sub-score).
- Cash flow +13.2/30.0
- Appreciation +9.8/10.0
- 1% rule +5.6/10.0
- DSCR +4.0/10.0
- Livability +3.9/5.0
- Rent growth +2.5/5.0
- Condition / age +2.5/5.0
- Schools +2.2/10.0
- ARV discount +0.0/15.0
$125,000
🖨 Deal sheet 📄 Offer letter ✓ Due diligence
Listing remarks MLS
HOME OWNED BY THE SECRETARY OF VETERANS AFFAIRS-3 BEDROOM BRICK BUNGALOW WITH FULL BASEMENT AND FENCED BACK AND SIDE YARD-QUIET DEAD END STREET-THIS WOULD BE A GREAT INVESTMENT TO MOVE IN OR TO RENT OUT-"PROPERTY WAS BUILT PRIOR TO 1978 AND LEAD BASED PAINT POTENTIALLY EXISTS". SELLER DOES NOT PAY CUSTOMARY CLOSING COSTS:INCLUDING TITLE POLICY, ESCROW FEES, SURVEY OR TRANSFER FEES.PROOF OF FUNDS REQUIRED ON CASH TRANSACTIONS;LENDER PRE-APPROVAL LETTER FOR FINANCED OFFERS DATED WITHIN LAST 30 DAYS. BEING SOLD AS-IS
Key facts
- 6,534 sq ft lot
- Built 1928
- Listed 92 days
Property features AI
Finance
- Other: Living area 2,397 (owner source); Above-grade finished area 1,497 (public records); Below-grade finished area 900 (owner reported)
- Financial info: Lease not considered
Exterior
- Utilities: Public water; Public sewer; Electricity connected (single phase); Natural gas connected
- Home design: Single family residence; One-and-one-half story; Residential property
- Construction: Brick construction
- Exterior features: Front porch; Back yard fencing; Front yard
Interior
- Bedrooms: 3 bedrooms total (2 on the main level, 1 on the upper level)
- Bathrooms: 1 full bathroom
- Heating & cooling: Forced air heating; Central air conditioning
- Interior features: Partially finished basement; Living room fireplace
Neighborhood map
What this means for you Summary
Snapshot
- This is a 3-bed/2.0-bath single-family listed at $125k.
Deal economics
- At list price, monthly cash flow is $-1 ($-17/yr) — negative.
- To cash-flow at today's rent, offer at most $125k (0.2% below list).
- Meets the 1% rule at list price ($1k rent vs $125k).
- Recommended offer: $114k (9.0% below list) — sets the bar for market timing.
Location & tenants
- Location reads 78/100 on livability (#142 in IL, #2,604 nationally) — a middle-class / working-renter tenant base. Strengths: commute A+, cost of living A+, housing A+; Watch: crime F, amenities D-.
- Belleville Twp Hsd 201 (suburban): math 21% / reading 28% proficiency, ranked #308 of 620 in IL (top 50%) — low school quality limits family demand, transient renter base, plan for 1-2y turnover.
- Zoned schools: Belleville High School-West (math 19% / reading 26%, grade F, #317 of 693 statewide, top 46%, 2,234 students, 0% FRL).
- Market conditions: 103 active listings in the ZIP; 5 comparable units currently listed for rent nearby; rentals at typical pace (median 24d on market — plan ~3-4 weeks tenant-placement turnaround); 783 units permitted in St. Clair County in 2024 (378 in 5+ unit buildings).
Forward outlook
- In year one you build about $13k of equity ($864 loan paydown + $12k appreciation (9.5% local appreciation)).
- St. Clair County population projected at -23% by 2050 — secular population decline; favor cash flow + early exit over multi-decade hold.
- At projected returns (9.5% appreciation + 3.0% rent growth), your $35k cash investment doubles in ~3 years — after that, you're playing with house money.
- By year 3, paydown + projected appreciation supports a ~$32k cash-out refi (75% LTV) — recoverable capital for the next deal without selling this one.
Negotiation context
- It's been on market 92 days — a 9% lower offer ($114k) is reasonable based on typical stale-listing flexibility.
- 2 sale attempts since 13y ago with the ask held roughly flat each time — persistent listings suggest the price (not the market) is what's stuck; bring a comps-based counter.
- Current owner paid $28k; list at $125k implies a 355% gain — meaningful room to come down on a strong offer.
Risks & watch-outs
- Watch-outs: property tax is 3.3% of price; built in 1928 — expect roof / HVAC / electrical / plumbing capex.
- Climate carrying-cost: extreme-heat days projected 7→21/yr by 2055 (HVAC capex compounding) — expect insurance premiums to compound above CPI over the hold.
Questions for the listing agent
- What do current leases actually rent for vs. the listed asking? Can we see a recent rent roll and the last 12 months of T-12 income?
- It's been on market 92 days. Have you received any prior offers? Is the seller open to a 9% concession, seller financing, or rate buy-down credit?
- Built in 1928 — when were the roof, HVAC, electrical panel, plumbing, and water heater last replaced?
- Property tax is high relative to price — has the assessment been appealed recently, and will the sale trigger a re-assessment?
- Why hasn't it sold? Are there any deal-killer items the seller is aware of (foundation, flood, title, zoning, code violations)?
- Is there a deadline driving the sale (1031 exchange, divorce, estate, relocation)? That informs how much negotiation room exists.
- Crime grade is F in this area — have there been break-ins, vandalism, or insurance claims at this property in the last 3 years? What carrier currently insures it and at what premium?
- The area grade is low — what's the realistic commute time and amenity access for the typical tenant pool here? Any planned neighborhood developments (good or bad) we should know about?
- What's the average days-on-market for RENTAL listings here right now (not sales)? A rising rental-DOM trend means longer vacancies and softer asking-rent achievability than the comps imply.
- What's the recent tenant-quality profile in this submarket — average credit score on applications, eviction rate, late-payment / NSF rate, and stable-employment percentage? A property-management company in the area should have these aggregated.
- How much new for-sale + rental construction is in the pipeline within 1–3 miles? Heavy new supply typically softens prices + rents 12–24 months out; constrained supply supports both.
Investment metrics
- 1% rule
- 1.06% ✓
- Cap rate
- 6.28%
- Cash-on-cash
- -0.05%
- DSCR
- 1.00
- GRM
- 7.9
CMA / ARV
- ARV (on-the-fly)
- $106,711
- Comps found
- 12
Show comp detail 12 sales within ~0.75 mi
| Address | Dist | Beds/Ba | Sqft | Sold | Price | $/sf | Match |
|---|---|---|---|---|---|---|---|
| 1412 4th Ave | 0.45mi | 3/2.0 | 1,176 (-2%) | 1mo | $169,900 | $144 | 75 |
| 318 State St | 0.41mi | 2/1.0 (-1) | 1,202 (+0%) | 3mo | $40,000 | $33 | 69 |
| 731 State St | 0.15mi | 2/1.5 (-1) | 1,104 (-8%) | 5mo | $155,000 | $140 | 68 |
| 503 S 16th St | 0.49mi | 2/1.0 (-1) | 1,198 (-0%) | 4mo | $112,500 | $94 | 65 |
| 1309 Veile Dr | 0.52mi | 3/1.5 | 1,150 (-4%) | 3mo | $139,900 | $122 | 64 |
| 516 S 16th St | 0.47mi | 2/1.0 (-1) | 1,182 (-1%) | 4mo | $1,000 | $1 | 63 |
| 14 N 15th St | 0.54mi | 2/1.0 (-1) | 1,225 (+2%) | 0mo | $84,900 | $69 | 62 |
| 419 S 8th St | 0.14mi | 2/1.0 (-1) | 1,028 (-14%) | 2mo | $109,000 | $106 | 59 |
| 408 S 15th St | 0.38mi | 2/1.0 (-1) | 1,073 (-10%) | 3mo | $58,000 | $54 | 53 |
| 403 W Van Buren St | 0.71mi | 3/1.0 | 1,293 (+8%) | 1mo | $114,500 | $89 | 49 |
| 404 S 16th St | 0.43mi | 2/1.5 (-1) | 1,370 (+14%) | 5mo | $120,000 | $88 | 45 |
| 1801 Roosevelt Ave | 0.66mi | 3/1.0 | 1,357 (+13%) | 2mo | $45,000 | $33 | 42 |
Match score weights: distance 35% · size 25% · config 20% · recency 20%. Top-matched comps best support the ARV.
Projected returns pro-forma
9.5% appreciation · 3.0% rent growth · sell at horizon
- IRR
- 23.2%
- Equity multiple
- 2.82×
- Total profit
- $63,858
- Equity at exit
- $108,076
- IRR
- 20.8%
- Equity multiple
- 6.35×
- Total profit
- $187,366
- Equity at exit
- $228,408
Cash invested: $35,000 (down + closing). Projections, not guarantees.
Landlord ↔ Tenant lean methodology
- Overall (STATE)
- 43 Moderately Tenant-Leaning
- State Illinois
- 43 Moderately Tenant-Leaning · D+7
- County
- — inherits STATE
- City
- — inherits STATE
ZIP-level market 62223
- Home prices YoY
- 3.8%
- Active inventory
- 103
- Price-to-rent
- 7.9×
Monthly cashflow live
- Estimated rent
- $1,324 high interval (Pro) →
- Mortgage (P&I)
- −$656
- Tax from tax record
- −$340 /mo · $4,078/yr
- Insurance
- −$52
- HOA
- −$0
- Vacancy / Maint / Mgmt
- −$278
- Net cashflow
- $-1
Break-even live
UW: 25.0% down · 7.5% · 30yr · 1.5% tax · 5.0% vac · 8.0% maint · 8.0% mgmt
Financing live
Cash to close
- Down payment
- $31,250
- Closing costs
- $3,750
- Reserves months
- —
- Total cash needed
- —
Loan-product check · same deal, 3 products live
Conventional
25% down · 7.5% · 30yr
- Down + closing
- —
- Monthly P&I
- —
- Monthly cashflow
- —
- DSCR
- —
- Eligible?
- —
Personal DTI + credit; lowest rate.
DSCR
20% down · 8.5% · 30yr
- Down + closing
- —
- Monthly P&I
- —
- Monthly cashflow
- —
- DSCR
- —
- Eligible?
- —
No personal income docs; deal must DSCR.
Hard money
10% down · 12.0% · 12mo
- Down + closing
- —
- Monthly P&I
- —
- Monthly cashflow
- —
- DSCR
- —
- Eligible?
- —
Short-term bridge; refi at stabilization.
Rent comps 5 comps
| Address | Beds | Baths | Sqft | Rent | $/sqft | DOM | Units | Dist |
|---|---|---|---|---|---|---|---|---|
| 618 W Monroe St Belleville, IL | 3.0 | 1.0 | 1500 | $1,050 | $0.70 | 23d | 1 | 0.35mi |
| 310 N 10th St Belleville, IL | 2.0 | 1.0 | 1270 | $1,300 | $1.02 | 2d | 1 | 0.67mi |
| 721 S Church St Belleville, IL | 4.0 | 2.0 | 1216 | $2,000 | $1.64 | 23d | 1 | 1.14mi |
| 1308 Caseyville Ave Swansea, IL | 2.0 | 1.0 | 890 | $1,200 | $1.35 | 4d | 1 | 1.28mi |
| 31 S 27th St Belleville, IL | 2.0 | 1.0 | 1000 | $915 | $0.92 | 23d | 1 | 1.29mi |
Listing history 19 events
-
2026-06-18days on market $125,000 Active 92 DOM
-
2026-06-17days on market $125,000 Active 91 DOM
-
2026-06-16days on market $125,000 Active 90 DOM
-
2026-06-15days on market $125,000 Active 89 DOM
-
2026-06-13days on market $125,000 Active 87 DOM
-
2026-06-09days on market $125,000 Active 83 DOM
-
2026-06-08days on market $125,000 Active 82 DOM
-
2026-06-07days on market $125,000 Active 81 DOM
-
2026-06-03days on market $125,000 Active 77 DOM
-
2026-06-02days on market $125,000 Active 76 DOM
-
2026-06-01days on market $125,000 Active 75 DOM
-
2026-05-31days on market $125,000 Active 74 DOM
-
2026-03-18$125,000 Active
-
2026-03-18historical $125,000
-
2014-02-10soldstatus $27,500
-
2014-02-07soldstatus 530-char remark
Show marketing remark (530 chars)
HOME OWNED BY THE SECRETARY OF VETERANS AFFAIRS-3 BEDROOM BRICK BUNGALOW WITH FULL BASEMENT AND FENCED BACK AND SIDE YARD-QUIET DEAD END STREET-THIS WOULD BE A GREAT INVESTMENT TO MOVE IN OR TO RENT OUT-"PROPERTY WAS BUILT PRIOR TO 1978 AND LEAD BASED PAINT POTENTIALLY EXISTS". SELLER DOES NOT PAY CUSTOMARY CLOSING COSTS:INCLUDING TITLE POLICY, ESCROW FEES, SURVEY OR TRANSFER FEES.PROOF OF FUNDS REQUIRED ON CASH TRANSACTIONS;LENDER PRE-APPROVAL LETTER FOR FINANCED OFFERS DATED WITHIN LAST 30 DAYS. BEING SOLD AS-IS
-
2013-09-25$28,900 530-char remark
Show marketing remark (530 chars)
HOME OWNED BY THE SECRETARY OF VETERANS AFFAIRS-3 BEDROOM BRICK BUNGALOW WITH FULL BASEMENT AND FENCED BACK AND SIDE YARD-QUIET DEAD END STREET-THIS WOULD BE A GREAT INVESTMENT TO MOVE IN OR TO RENT OUT-"PROPERTY WAS BUILT PRIOR TO 1978 AND LEAD BASED PAINT POTENTIALLY EXISTS". SELLER DOES NOT PAY CUSTOMARY CLOSING COSTS:INCLUDING TITLE POLICY, ESCROW FEES, SURVEY OR TRANSFER FEES.PROOF OF FUNDS REQUIRED ON CASH TRANSACTIONS;LENDER PRE-APPROVAL LETTER FOR FINANCED OFFERS DATED WITHIN LAST 30 DAYS. BEING SOLD AS-IS
-
1995-09-25soldstatus $73,000
-
1995-09-25soldstatus $73,000
ⓘ Source: listings_history table (triggers on properties + properties_extension) + one-shot
backfill from property_details.listing_events for pre-trigger history.
Tax reassessment forecast IL · Partial reset (capped growth)
- Current annual tax
- $4,078 · $340/mo
- Projected year-2 tax
- $4,078 · $340/mo
- Expected delta
- $0/yr ($0/mo · -0.0%)
ⓘ Screening estimate from a state-policy table — verify with the county assessor before closing.
Climate risk First Street
- Flood 1/10 Low FEMA zone X · 0% chance over 30 yrs
- Wildfire 1/10 Low
- Heat 5/10 Major 7 d/yr ≥107°F today · 21 d/yr by 30 yrs out
- Wind 2/10 Low 100% chance of damaging wind over 30 yrs
- Air quality 4/10 Moderate 3 unhealthy d/yr today · 6 by 30 yrs out
Nearby sold comps map
Loading sold comps map…
Walkable amenities ~0.75 mi
Loading nearby amenities…
Taxation est. · year 1
- Rental income
- $15,888
- − Mortgage interest
- −$7,002
- − Property taxes
- −$4,078
- − Insurance
- −$625
- − Repairs & maintenance
- −$1,271
- − Management
- −$1,271
- − Depreciation
- −$3,636
- Taxable loss
- −$1,995
- Est. tax savings @ 24.0%
- +$479
- After-tax cash flow
- $462/yr
For passive investors: Depreciation is non-cash, so a rental often shows a tax loss while cash-flowing — sheltering income. Rental losses are passive: they offset passive income freely, and up to $25,000/yr can offset ordinary (W-2) income if you actively participate and your MAGI is under $100k (phasing out to $0 by $150k); unused losses carry forward. On sale, claimed depreciation is recaptured at up to 25%, and gains may owe capital-gains tax (a 1031 exchange can defer both). Figures are a year-1 estimate at your 24.0% rate — not tax advice; consult a CPA.
Schools (NCES district)
- District
- Belleville Twp Hsd 201
- NCES district ID
- 1705640
- Math proficiency
- 21% ▼ -8.00%
- Reading proficiency
- 28% ▼ -3.00%
- Median HH income
- $58,064
- Composite
- 22.39/100
- National rank
- #8115
- State rank
- #308 of 620 in IL
Livability — Belleville
- Score
- 78/100
- State rank
- #142
- US rank
- #2604
Category grades
Schools grade is shown separately in the Schools card above.
Census & demographics
- Census place
- Belleville, IL
- County
- Saint Clair County · 169,691 people
- City population
- 47,407
- Metro
- St. Louis, MO-IL
- Population (ZIP)
- 16,269
- Household income
- $73,700
- Rent vs Own
- Severe rent burden
- 656.0
Population outlook (St. Clair County) Hauer SSP2
- Today (2025)
- 250,366 people
- By 2030
- 240,511 · -3.9%
- By 2040
- 217,391 · -13.2%
- By 2050
- 192,699 · -23.0%
- By 2075
- 140,637 · -43.8%
- By 2100
- 100,499 · -59.9%
Race, ethnicity, and origin ACS 2023
- Neighborhood character
- Majority White (62%)
- Race & ethnicity
- White 62% Black 27% Two or more races 9% Hispanic / Latino 4%
- Common ancestry
- Romanian 3% Lithuanian 3% Slovak 2%
- Foreign-born
- 2% · Canada, Guatemala
- Languages at home
- 96% English-only · Spanish 2%
Political lean MEDSL · St. Clair
- 2024 margin
- Lean D (+7.9) · D 53.0% · R 45.1% · Other 1.8%
- 2008→2024 swing
- -14.6pp toward R · 2008: 22.4pp · 2024: 7.9pp
- All cycles
- 2024: D+7.9 2020: D+8.7 2016: D+5.6 2012: D+14.5 2008: D+22.4
Not yet ingested
- Civics
- —
Market trends
- HPI YoY
- ▲ 9.50%
- Current HPI
- 259.15
- Rent YoY
- —
- Metro
- St. Louis, MO-IL
- State GDP YoY
- ▲ 1.59%
- F500 in state
- 60
Industry mix (Fortune 500 HQ in IL)
| Industry | F500 HQs | Revenue |
|---|---|---|
| Insurance | 4 | $201B |
|
||
| Consumer Goods | 4 | $87B |
|
||
| Industrial Machinery | 3 | $64B |
|
||
| Healthcare | 2 | $55B |
|
||
| Retail / Pharmacy | 1 | $148B |
|
||
| Agriculture / Food | 1 | $86B |
|
||
Price history
+71.2% since first listed7 events — show timeline
- 2026-03-18 Listed $125,000 MARIS as Distributed by MLS Grid
- 2026-03-18 Coming Soon $125,000 MARIS as Distributed by MLS Grid
- 2014-02-10 Sold (Public Records) $27,500 Public Records
- 2014-02-07 Sold (MLS) — MARIS as Distributed by MLS Grid
- 2013-09-25 Listed $28,900 MARIS as Distributed by MLS Grid
- 1995-09-25 Sold (Public Records) $73,000 Public Records
- 1995-09-25 Sold (Public Records) $73,000 Public Records
Property tax history
+4.8%/yrLatest (2024): $4,078 · +5.7% YoY. Source: county tax records.
Cash-flow waterfall
monthlySold comps — $/sqft
last 12 mo · ≤1 miLoading sold comps…