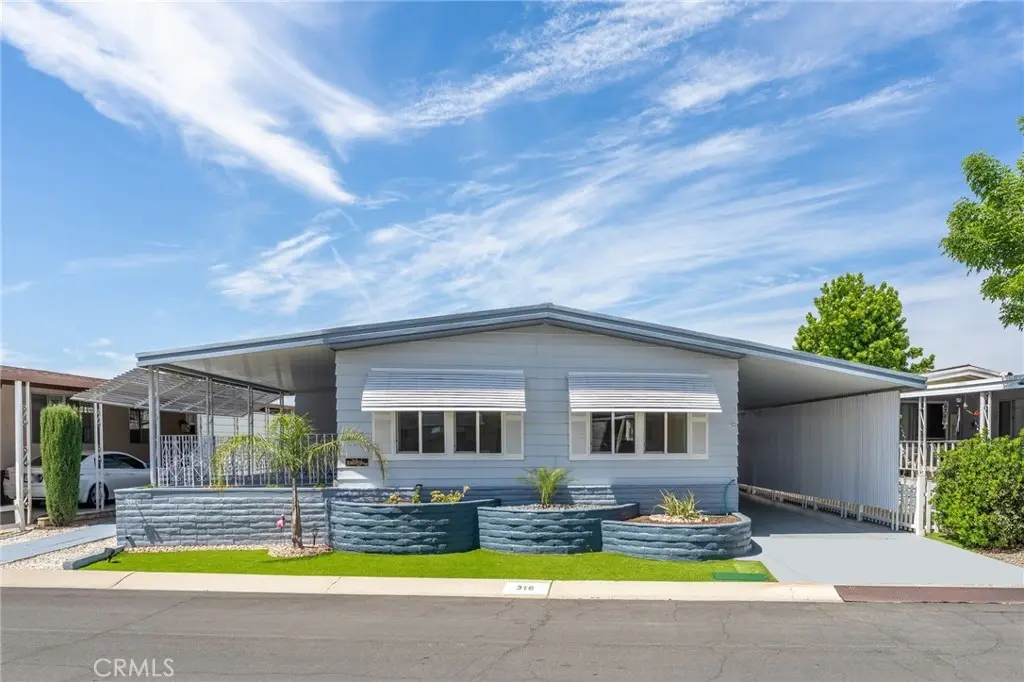
27601 Sun City Blvd #316 · Menifee, CA
Flood risk 1/10 · Minimal
- FEMA flood zone
- X (unshaded)
- Chance of flooding over 30 yrs
- 0.0%
- Est. flood insurance / yr
- $507 – $1,088
Fire risk 7/10 · Major
- Est. fire insurance / yr
- $659 – $1,223
Heat risk 7/10 · Major
- Hot days now (above 105°F)
- 5 days/yr
- Hot days in 30 yrs
- 14 days/yr
Wind risk 1/10 · Minimal
- Chance of severe wind over 30 yrs
- —
Air-quality risk 5/10 · Moderate
- Unhealthy air days now
- 9 days/yr
- Unhealthy air days in 30 yrs
- 11 days/yr
Risk factors via First Street. Map © Google.
Why this score? — see what drove the B- grade
The composite is a weighted blend of 9 inputs, each scored 0–100. Each bar is that input's sub-score; the figure is the points it added to the 100-point composite (weight × sub-score).
- Cash flow +28.5/30.0
- DSCR +10.0/10.0
- 1% rule +7.9/10.0
- ARV discount +7.5/15.0
- Schools +4.5/10.0
- Rent growth +4.0/5.0
- Condition / age +4.0/5.0
- Livability +3.2/5.0
- Appreciation +0.0/10.0
$199,900
🖨 Deal sheet 📄 Offer letter ✓ Due diligence
Listing remarks
Meticulously restored to near-mint original condition, this classic vintage mobile home in the gated Sun City Mobile Home Estates offers exceptional preservation and detail throughout. The front yard features pristine turf with a rock garden border, radius slump stone planters, shuttered windows, and a raised deck with original wrought iron railing under a covered patio. The front entry opens to a spacious living room with a wall of windows, textured walls, and a vaulted ceiling, along with an adjacent dining area with its own window. The large family room connects directly to the kitchen, which includes a radius breakfast bar, well-maintained original cabinetry, a newer dishwasher, GE doub
Key facts
- Gated community
- Rock garden border
- Wrought iron railing
Tags
Property features AI
Finance
- Other: Body type: triple (multi-unit designation)
- Financial info: Land lease: $701 monthly (seller provided)
- HOA & community: Senior community; Sun City Mobile Home Estates park; Dog park; Street lighting; Manager approval required; Pets allowed — contact for details
Exterior
- Parking: Driveway parking; Three carport/parking spaces
- Utilities: Public sewer; District/public water
- Home design: Manufactured/mobile home (34' x 68') — mobile home remains; Turnkey, updated/remodeled condition; Single-story; Entry at level 1
- Construction: Raised foundation; Composition/asphalt roof; Year built per public records
- Exterior features: Covered patio; Community pool; Wood skirt; Front yard; Sprinkler system; One shed
Interior
- Kitchen: Kitchen open to family room; Walk-in pantry; Gas cooktop; Double oven; Range/stove hood; Dishwasher; Garbage disposal; Water line to refrigerator
- Bedrooms: Main floor primary bedroom; Main floor bedroom; Walk-in closet
- Flooring: Laminate flooring
- Bathrooms: Two full bathrooms; Main floor full bath; Walk-in shower; Double sinks in master bath
- Heating & cooling: Central heating (furnace); Central cooling
- Interior features: Track lighting; Ceiling fan; One-level living; Community spa
- Laundry & utility: Laundry inside in a separate room
Neighborhood map
What this means for you Summary
Snapshot
- This is a 2-bed/2.0-bath manufactured listed at $200k. Condition is rated good.
Deal economics
- At list price, monthly cash flow is $653 ($8k/yr) — positive.
- The deal already cash-flows at list — no discount required.
- Meets the 1% rule at list price ($3k rent vs $200k).
- Recommended offer: $194k (3.0% below list) — sets the bar for market timing.
- Cap rate 10.2% vs local median 3.6% in Menifee — top-decile yield for the area; either an underpriced asset or a hidden risk that comps aren't pricing in. Stress-test before assuming the spread holds.
Location & tenants
- Location reads 64/100 on livability (#407 in CA) — a middle-class / working-renter tenant base. Strengths: housing A+, crime A, employment A-; Watch: health & safety D+, amenities D, commute F.
- Menifee Union Elementary (suburban): math 43% / reading 56% proficiency, ranked #434 of 1,400 in CA (top 31%) — families likely to look elsewhere, expect single-tenant / working-renter base with shorter leases.
- Zoned schools: Ridgemoor Elementary (math 24% / reading 24%, grade F, #973 of 1,571 statewide, top 73%, 719 students, 65% FRL) — zoned schools average 65% FRL vs 32% district-wide (33 pts higher); higher-poverty schools than district average — tighter screening recommended.
- Zoned-school proficiency averages 24% at this address vs 50% district-wide (-25 pts) — the specific schools serving this property underperform the Menifee Union Elementary average; the district grade overstates school quality for this exact location.
- Market conditions: Rents rising fast (+6.1%/yr); 197 active listings in the ZIP; 21 comparable units currently listed for rent nearby; rentals leasing fast (median 2d on market — plan ~1-2 weeks tenant-placement turnaround); 9,195 units permitted in Riverside County in 2024 (1,512 in 5+ unit buildings).
- At $2,575/mo this rent would consume 54% of the median local household income ($58k/yr) (locally 1163% of renters already pay >50% of income on rent) — very limited rent-growth headroom before tenants either downsize or default.
Forward outlook
- Local home prices are declining (-3.0%/yr); year-one equity from $1k of loan paydown is wiped out by about $6k of value loss. Plan a longer hold.
- Riverside County population projected at +22% by 2050 — long-run rental-demand tailwind backs the buy-and-hold thesis.
- At projected returns (-3.0% appreciation + 6.1% rent growth), your $56k cash investment doubles in ~7 years — after that, you're playing with house money.
Negotiation context
- It's been on market 56 days — a 3% lower offer ($194k) is reasonable based on typical stale-listing flexibility.
Risks & watch-outs
- Climate carrying-cost: major wildfire risk; extreme-heat days projected 5→14/yr by 2055 (HVAC capex compounding) — expect insurance premiums to compound above CPI over the hold.
Questions for the listing agent
- It's been on market 56 days. Have you received any prior offers? Is the seller open to a 3% concession, seller financing, or rate buy-down credit?
- Built in 1977 — when were the roof, HVAC, electrical panel, plumbing, and water heater last replaced?
- Is there a deadline driving the sale (1031 exchange, divorce, estate, relocation)? That informs how much negotiation room exists.
- Schools are D-rated, which usually means shorter tenancies and higher turnover. Who's the typical renter profile here, and what's been the actual vacancy rate?
- What's the average days-on-market for RENTAL listings here right now (not sales)? A rising rental-DOM trend means longer vacancies and softer asking-rent achievability than the comps imply.
- What's the recent tenant-quality profile in this submarket — average credit score on applications, eviction rate, late-payment / NSF rate, and stable-employment percentage? A property-management company in the area should have these aggregated.
- How much new for-sale + rental construction is in the pipeline within 1–3 miles? Heavy new supply typically softens prices + rents 12–24 months out; constrained supply supports both.
Investment metrics
- 1% rule
- 1.29% ✓
- Cap rate
- 10.21%
- Cash-on-cash
- 14.00%
- DSCR
- 1.62
- GRM
- 6.5
CMA / ARV
- ARV (median comp)
- $126,058
- List price
- $199,900
- Delta
- 58.58%
- Verdict
- OVERPRICED
- Comps
- 20 within 1.0 mi
Show comp detail 9 sales within ~0.75 mi
| Address | Dist | Beds/Ba | Sqft | Sold | Price | $/sf | Match |
|---|---|---|---|---|---|---|---|
| 27601 Sun City Blvd Sp 127 | 0.10mi | 2/2.0 | 1,704 (-3%) | 12mo | $85,000 | $50 | 80 |
| 27601 Sun City Blvd #312 | 0.20mi | 2/2.0 | 1,636 (-7%) | 11mo | $180,000 | $110 | 70 |
| 27601 Sun City #292 | 0.26mi | 2/2.0 | 1,632 (-7%) | 12mo | $110,000 | $67 | 66 |
| 27601 Sun City Blvd 315 | 0.11mi | 2/2.0 | 1,620 (-8%) | 21mo | $160,000 | $99 | 64 |
| 27601 Sun City Blvd #21 | 0.17mi | 3/2.0 (+1) | 1,512 (-14%) | 22mo | $205,000 | $136 | 45 |
| 27250 Murrieta #126 | 0.69mi | 3/2.0 (+1) | 1,568 (-11%) | 0mo | $225,000 | $143 | 45 |
| 27150 Shadel #49 | 0.40mi | 2/2.0 | 1,536 (-13%) | 20mo | $105,000 | $68 | 44 |
| 27250 Murrieta Rd #241 | 0.59mi | 3/2.0 (+1) | 1,547 (-12%) | 8mo | $216,800 | $140 | 40 |
| 27250 Murrieta Rd #220 | 0.63mi | 3/2.0 (+1) | 1,568 (-11%) | 14mo | $209,000 | $133 | 36 |
Match score weights: distance 35% · size 25% · config 20% · recency 20%. Top-matched comps best support the ARV.
Projected returns pro-forma
-3.0% appreciation · 6.1% rent growth · sell at horizon
- IRR
- 7.7%
- Equity multiple
- 1.31×
- Total profit
- $17,530
- Equity at exit
- $29,806
- IRR
- 19.5%
- Equity multiple
- 2.88×
- Total profit
- $105,213
- Equity at exit
- $17,284
Cash invested: $55,972 (down + closing). Projections, not guarantees.
Landlord ↔ Tenant lean methodology
- Overall (STATE)
- 18 Strongly Tenant-Friendly
- State California
- 18 Strongly Tenant-Friendly · D+13
- County
- — inherits STATE
- City
- — inherits STATE
ZIP-level market 92586
- Home prices YoY
- -19.1%
- Rents YoY
- 6.1%
- Active inventory
- 197
- Price-to-rent
- 6.5×
Monthly cashflow live
- Estimated rent
- $2,575 high interval (Pro) →
- Mortgage (P&I)
- −$1,048
- Tax est. 1.5%
- −$250 /mo · $2,998/yr
- Insurance
- −$83
- HOA
- −$0
- Vacancy / Maint / Mgmt
- −$541
- Net cashflow
- $653
Break-even live
UW: 25.0% down · 7.5% · 30yr · 1.5% tax · 5.0% vac · 8.0% maint · 8.0% mgmt
Financing live
Cash to close
- Down payment
- $49,975
- Closing costs
- $5,997
- Reserves months
- —
- Total cash needed
- —
Loan-product check · same deal, 3 products live
Conventional
25% down · 7.5% · 30yr
- Down + closing
- —
- Monthly P&I
- —
- Monthly cashflow
- —
- DSCR
- —
- Eligible?
- —
Personal DTI + credit; lowest rate.
DSCR
20% down · 8.5% · 30yr
- Down + closing
- —
- Monthly P&I
- —
- Monthly cashflow
- —
- DSCR
- —
- Eligible?
- —
No personal income docs; deal must DSCR.
Hard money
10% down · 12.0% · 12mo
- Down + closing
- —
- Monthly P&I
- —
- Monthly cashflow
- —
- DSCR
- —
- Eligible?
- —
Short-term bridge; refi at stabilization.
Rent comps 21 comps
| Address | Beds | Baths | Sqft | Rent | $/sqft | DOM | Units | Dist |
|---|---|---|---|---|---|---|---|---|
| 27218 Pennywhistle Way Menifee, CA | 3.0 | 2.0 | 2000 | $3,700 | $1.85 | 1d | 1 | 0.47mi |
| 27055 Fan Ln Menifee, CA | 2.0 | 2.0 | 1800 | $2,950 | $1.64 | 1d | 1 | 0.59mi |
| 29196 Crestone Dr Sun City, CA | 2.0 | 2.0 | 1393 | $1,995 | $1.43 | 19d | 1 | 0.70mi |
| 28055 Grosse Point Dr Menifee, CA | 1.0 | 1.0 | 1767 | $1,495 | $0.85 | 1d | 1 | 0.75mi |
| 27709 Camino Donaire Menifee, CA | 3.0 | 2.0 | 1317 | $3,000 | $2.28 | 1d | 1 | 0.76mi |
| 26460 Spaniel Ln Menifee, CA | 3.0 | 2.0 | 2000 | $2,995 | $1.50 | 1d | 1 | 0.81mi |
| 26805 China Dr Menifee, CA | 3.0 | 2.5 | 1773 | $3,000 | $1.69 | 24d | 1 | 0.87mi |
| 26838 Wildrose Ct Menifee, CA | 1.0 | 1.0 | 2500 | $750 | $0.30 | 24d | 1 | 0.92mi |
| 26156 Birkdale Rd Menifee, CA | 2.0 | 2.0 | 1285 | $2,000 | $1.56 | 1d | 1 | 0.93mi |
| 28375 Paseo Grande Dr Menifee, CA | 2.0 | 2.0 | 1285 | $2,395 | $1.86 | 1d | 1 | 0.94mi |
| 26542 Sun City Blvd Menifee, CA | 2.0 | 2.0 | 1530 | $2,295 | $1.50 | 10d | 1 | 0.99mi |
| 25861 McCall Blvd Menifee, CA | 2.0 | 2.0 | 1378 | $2,350 | $1.71 | 1d | 1 | 1.11mi |
| 27757 Aspel Rd Menifee, CA | 1.0–2.0 | 1.0–2.0 | 1026 | $2,869 | $2.80 | 1d | 15 | 1.15mi |
| 28033 Radford Dr Menifee, CA | 2.0 | 2.0 | 1520 | $2,400 | $1.58 | 10d | 1 | 1.22mi |
| 26772 Maris Ct Menifee, CA | 3.0 | 2.0 | 1715 | $2,800 | $1.63 | 1d | 1 | 1.23mi |
| 27305 Uppercrest Ct Menifee, CA | 3.0 | 2.0 | 1318 | $2,353 | $1.79 | 22d | 1 | 1.27mi |
| 27450 Tyrrhenian Dr Menifee, CA | 3.0 | 2.0 | 1557 | $3,000 | $1.93 | 5d | 1 | 1.34mi |
| 25650 Hartwick Rd Menifee, CA | 3.0 | 2.0 | 1603 | $2,650 | $1.65 | 22d | 1 | 1.38mi |
| 25615 Union Hill Dr Menifee, CA | 3.0 | 2.0 | 1350 | $2,550 | $1.89 | 15d | 1 | 1.40mi |
| 28880 Amersfoot Way Menifee, CA | 2.0 | 2.0 | 1386 | $2,400 | $1.73 | 1d | 1 | 1.42mi |
| 27077 El Rancho Dr Menifee, CA | 3.0 | 2.0 | 1364 | $2,600 | $1.91 | 1d | 1 | 1.47mi |
Listing history 14 events
-
2026-06-18days on market $199,900 Active 56 DOM
-
2026-06-17days on market $199,900 Active 55 DOM
-
2026-06-16days on market $199,900 Active 54 DOM
-
2026-06-15pricedays on market $199,900 Active 53 DOM
-
2026-06-13days on market $210,000 Active 51 DOM
-
2026-06-09days on market $210,000 Active 47 DOM
-
2026-06-08days on market $210,000 Active 46 DOM
-
2026-06-07days on market $210,000 Active 45 DOM
-
2026-06-04days on market $210,000 Active 42 DOM
-
2026-06-03days on market $210,000 Active 41 DOM
-
2026-06-02days on market $210,000 Active 40 DOM
-
2026-06-01days on market $210,000 Active 39 DOM
-
2026-05-31days on market $210,000 Active 38 DOM
-
2026-04-23$210,000 Active 2136-char remark
ⓘ Source: listings_history table (triggers on properties + properties_extension) + one-shot
backfill from property_details.listing_events for pre-trigger history.
Climate risk First Street
- Flood 1/10 Low FEMA zone X (unshaded) · 0% chance over 30 yrs
- Wildfire 7/10 Severe
- Heat 7/10 Severe 5 d/yr ≥105°F today · 14 d/yr by 30 yrs out
- Wind 1/10 Low
- Air quality 5/10 Major 9 unhealthy d/yr today · 11 by 30 yrs out
Nearby sold comps map
Loading sold comps map…
Walkable amenities ~0.75 mi
Loading nearby amenities…
Taxation est. · year 1
- Rental income
- $30,906
- − Mortgage interest
- −$11,198
- − Property taxes
- −$2,998
- − Insurance
- −$1,000
- − Repairs & maintenance
- −$2,472
- − Management
- −$2,472
- − Depreciation
- −$5,815
- Taxable income
- $4,950
- Est. tax owed @ 24.0%
- −$1,188
- After-tax cash flow
- $6,650/yr
For passive investors: Depreciation is non-cash, so a rental often shows a tax loss while cash-flowing — sheltering income. Rental losses are passive: they offset passive income freely, and up to $25,000/yr can offset ordinary (W-2) income if you actively participate and your MAGI is under $100k (phasing out to $0 by $150k); unused losses carry forward. On sale, claimed depreciation is recaptured at up to 25%, and gains may owe capital-gains tax (a 1031 exchange can defer both). Figures are a year-1 estimate at your 24.0% rate — not tax advice; consult a CPA.
Condition & rehab AI · 12 photos
This meticulously restored mobile home in Sun City Mobile Home Estates is in excellent condition with good curb appeal and interior finishes. It offers a great opportunity for a potential buyer or investor looking for a move-in-ready property.
Value-add opportunities
- Both Paint exterior siding — Enhances curb appeal and value
- Both Replace kitchen appliances — Modernizes kitchen and improves functionality
- Both Install new windows — Improves energy efficiency and aesthetics
Renovation cost estimate screening
Value-add ROI direction
- Both Paint exterior siding — Enhances curb appeal and value ↑
- Both Replace kitchen appliances — Modernizes kitchen and improves functionality ↑
- Both Install new windows — Improves energy efficiency and aesthetics ↑
ⓘ Cost ranges are severity-bucket heuristics (US national rule-of-thumb). Get contractor quotes + a written scope before underwriting a rehab budget.
Schools (NCES district)
- District
- Menifee Union Elementary
- NCES district ID
- 0624540
- Math proficiency
- 43% ▬ 0.00%
- Reading proficiency
- 56% ▲ 3.00%
- Median HH income
- $58,228
- Composite
- 45.17/100
- National rank
- #5790
- State rank
- #434 of 1400 in CA
Livability — Menifee
- Score
- 64/100
- State rank
- #407
- US rank
- #13882
Category grades
Schools grade is shown separately in the Schools card above.
Census & demographics
- Census place
- Menifee, CA
- County
- Riverside County · 2,287,001 people
- City population
- 111,667
- Metro
- Riverside-San Bernardino-Ontario, CA
- Population (ZIP)
- 20,767
- Household income
- $57,708
- Rent vs Own
- Severe rent burden
- 1163.0
Population outlook (Riverside County) Hauer SSP2
- Today (2025)
- 2,664,475 people
- By 2030
- 2,802,692 · +5.2%
- By 2040
- 3,050,904 · +14.5%
- By 2050
- 3,256,783 · +22.2%
- By 2075
- 3,655,058 · +37.2%
- By 2100
- 3,766,594 · +41.4%
Race, ethnicity, and origin ACS 2023
- Neighborhood character
- Diverse neighborhood (Simpson 0.59)
- Race & ethnicity
- White 55% Hispanic / Latino 31% Two or more races 17% Black 6% Asian 3%
- Hispanic origin (detail)
- Mexican 25% Puerto Rican 1%
- Common ancestry
- Lithuanian 3% Italian 2% Romanian 1%
- Foreign-born
- 15% · Canada, Vietnam, China
- Languages at home
- 77% English-only · Spanish 18% Other Asian/Pacific 1% Other Indo-European 1%
Political lean MEDSL · Riverside
- 2024 margin
- Toss-up / Even · D 48.0% · R 49.3% · Other 2.6%
- 2008→2024 swing
- -3.6pp toward R · 2008: 2.3pp · 2024: -1.3pp
- All cycles
- 2024: R+1.3 2020: D+8.0 2016: D+4.3 2012: R+0.4 2008: D+2.3
Not yet ingested
- Civics
- —
Market trends
- HPI YoY
- ▼ -86.18%
- Current HPI
- 364.9577
- Rent YoY
- ▲ 6.10%
- Metro
- Riverside-San Bernardino-Ontario, CA
- State GDP YoY
- ▲ 3.21%
- F500 in state
- 116
Industry mix (Fortune 500 HQ in CA)
| Industry | F500 HQs | Revenue |
|---|---|---|
| Technology | 27 | $1,492B |
|
||
| Financial Services | 3 | $174B |
|
||
| Retail | 3 | $44B |
|
||
| Insurance | 3 | $26B |
|
||
| Media / Entertainment | 2 | $115B |
|
||
| Pharmaceuticals / Biotech | 2 | $62B |
|
||
Price history
-4.8% since first listed2 events — show timeline
- 2026-06-13 Price Changed $199,900 CRMLS
- 2026-04-23 Listed $210,000 CRMLS
Cash-flow waterfall
monthlySold comps — $/sqft
last 12 mo · ≤1 miLoading sold comps…