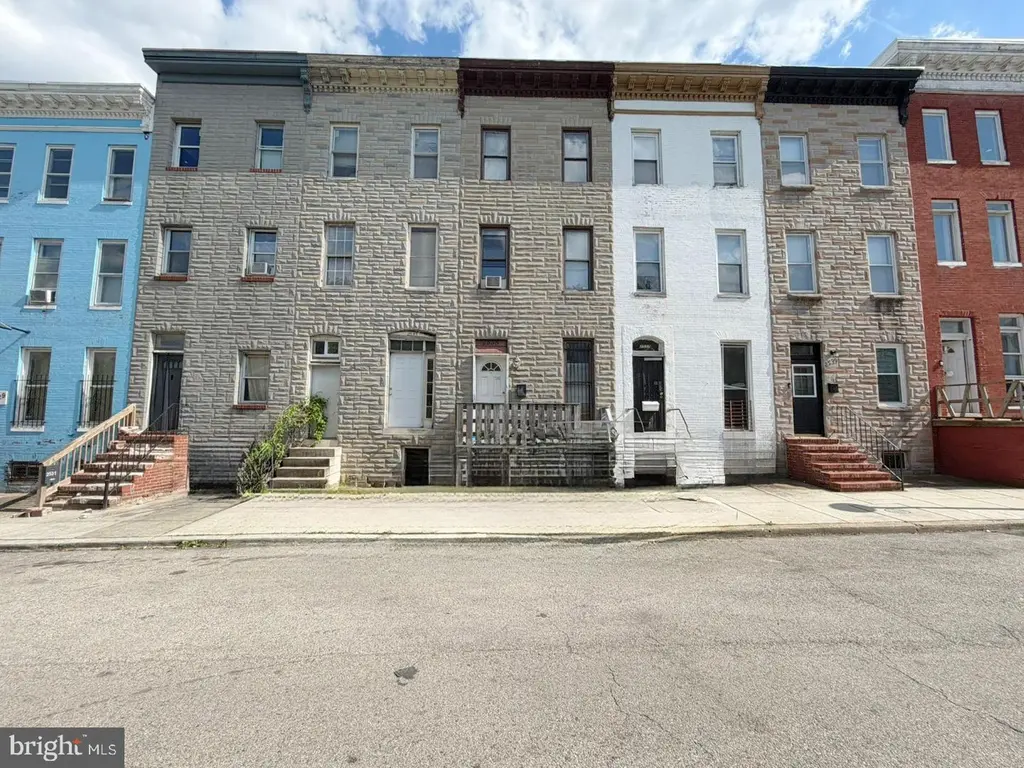
2535 Ashton St · Baltimore, MD
Flood risk 1/10 · Minimal
- FEMA flood zone
- X (unshaded)
- Chance of flooding over 30 yrs
- 0.0%
- Est. flood insurance / yr
- $473 – $860
Fire risk 1/10 · Minimal
- Est. fire insurance / yr
- $755 – $1,403
Heat risk 7/10 · Major
- Hot days now (above 103°F)
- 7 days/yr
- Hot days in 30 yrs
- 15 days/yr
Wind risk 6/10 · Moderate
- Chance of severe wind over 30 yrs
- 27.0%
Air-quality risk 3/10 · Minor
- Unhealthy air days now
- 3 days/yr
- Unhealthy air days in 30 yrs
- 4 days/yr
Risk factors via First Street. Map © Google.
Why this score? — see what drove the B- grade
The composite is a weighted blend of 9 inputs, each scored 0–100. Each bar is that input's sub-score; the figure is the points it added to the 100-point composite (weight × sub-score).
- Cash flow +30.0/30.0
- 1% rule +10.0/10.0
- DSCR +10.0/10.0
- ARV discount +7.5/15.0
- Rent growth +4.4/5.0
- Livability +3.8/5.0
- Condition / age +2.5/5.0
- Schools +1.0/10.0
- Appreciation +0.0/10.0
$110,000
🖨 Deal sheet 📄 Offer letter ✓ Due diligence
Listing remarks MLS
IGNORE DAYS ON THE MARKET, CONTRACT FELL THROUGH. GREAT INVESTMENT PROPERTY, OR PERFECT FOR FIRST TIME HOME BUYER. PROPERTY NEEDS SOME MINOR WORK, BUT SHOWS WELL. SELLER IS OFFERING $3,000 IN CLOSING HELP. PROPERTY BEING SOLD AS IS. THANKS FOR SHOWING AND PLEASE LEAVE A BUSINESS CARD. GROUND RENT TO BE VERIFIED.
Key facts
- Natural lighting
- Fenced-in backyard
- Excellent location
Tags
Property features AI
Exterior
- Parking: Off-street parking
- Utilities: Public water; Public sewer; Electric cooling fuel; Natural gas for heating and hot water
- Home design: Interior townhouse/rowhouse; Fee simple ownership
- Construction: Brick construction; Permanent foundation; Above-grade and below-grade structures; Built year per assessor
- Exterior features: No tidal water
Interior
- Bedrooms: Two bedrooms on the first upper level; Two bedrooms on the second upper level
- Bathrooms: One full bathroom
- Heating & cooling: Central heating; Natural gas heating and hot water; Ceiling fan cooling (electric)
- Interior features: Full basement, partially finished
Neighborhood map
What this means for you Summary
Snapshot
- This is a 4-bed/1.0-bath townhouse listed at $110k.
Deal economics
- At list price, monthly cash flow is $758 ($9k/yr) — positive.
- The deal already cash-flows at list — no discount required.
- Meets the 1% rule at list price ($2k rent vs $110k).
- Recommended offer: $107k (3.0% below list) — sets the bar for market timing.
- Cap rate 14.6% vs local median 6.0% in Baltimore — top-decile yield for the area; either an underpriced asset or a hidden risk that comps aren't pricing in. Stress-test before assuming the spread holds.
Location & tenants
- Location reads 76/100 on livability (#90 in MD, #3,396 nationally) — a middle-class / working-renter tenant base. Strengths: amenities A+, commute A+, housing A+; Watch: schools D, crime F.
- Baltimore City Public Schools (urban): math 7% / reading 16% proficiency, ranked #24 of 24 in MD (top 100%) — low school quality limits family demand, transient renter base, plan for 1-2y turnover; 79% free/reduced lunch — lower-income household profile, screen leases tightly.
- Market conditions: Rents rising fast (+7.5%/yr); 422 active listings in the ZIP; 40 comparable units currently listed for rent nearby; rentals at typical pace (median 24d on market — plan ~3-4 weeks tenant-placement turnaround); 1,273 units permitted in Baltimore city in 2024 (1,104 in 5+ unit buildings).
- At $1,869/mo this rent would consume 49% of the median local household income ($46k/yr) (locally 1755% of renters already pay >50% of income on rent) — very limited rent-growth headroom before tenants either downsize or default.
Forward outlook
- Local home prices are declining (-3.0%/yr); year-one equity from $761 of loan paydown is wiped out by about $3k of value loss. Plan a longer hold.
- Baltimore County population projected to shrink 4% by 2050 — rents likely to lag national; underwrite the cash flow, not the appreciation.
- At projected returns (-3.0% appreciation + 7.5% rent growth), your $31k cash investment doubles in ~4 years — after that, you're playing with house money.
Negotiation context
- It's been on market 35 days — a 3% lower offer ($107k) is reasonable based on typical stale-listing flexibility.
- 7 sale attempts since 29y ago with the ask held roughly flat each time — persistent listings suggest the price (not the market) is what's stuck; bring a comps-based counter.
- Current owner paid $60k; list at $110k implies a 83% gain — meaningful room to come down on a strong offer.
Risks & watch-outs
- Watch-outs: built in 1920 — expect roof / HVAC / electrical / plumbing capex.
- Climate carrying-cost: major wind risk, 27% chance of damaging wind over 30y; extreme-heat days projected 7→15/yr by 2055 (HVAC capex compounding) — expect insurance premiums to compound above CPI over the hold.
Questions for the listing agent
- It's been on market 35 days. Have you received any prior offers? Is the seller open to a 3% concession, seller financing, or rate buy-down credit?
- Built in 1920 — when were the roof, HVAC, electrical panel, plumbing, and water heater last replaced?
- Is there a deadline driving the sale (1031 exchange, divorce, estate, relocation)? That informs how much negotiation room exists.
- Schools are D-rated, which usually means shorter tenancies and higher turnover. Who's the typical renter profile here, and what's been the actual vacancy rate?
- Crime grade is F in this area — have there been break-ins, vandalism, or insurance claims at this property in the last 3 years? What carrier currently insures it and at what premium?
- What's the average days-on-market for RENTAL listings here right now (not sales)? A rising rental-DOM trend means longer vacancies and softer asking-rent achievability than the comps imply.
- What's the recent tenant-quality profile in this submarket — average credit score on applications, eviction rate, late-payment / NSF rate, and stable-employment percentage? A property-management company in the area should have these aggregated.
- How much new for-sale + rental construction is in the pipeline within 1–3 miles? Heavy new supply typically softens prices + rents 12–24 months out; constrained supply supports both.
Investment metrics
- 1% rule
- 1.70% ✓
- Cap rate
- 14.57%
- Cash-on-cash
- 29.54%
- DSCR
- 2.31
- GRM
- 4.9
CMA / ARV
- ARV (median comp)
- $62,066
- List price
- $110,000
- Delta
- 77.23%
- Verdict
- OVERPRICED
- Comps
- 20 within 1.0 mi
Show comp detail 11 sales within ~0.75 mi
| Address | Dist | Beds/Ba | Sqft | Sold | Price | $/sf | Match |
|---|---|---|---|---|---|---|---|
| 2542 W Pratt St | 0.33mi | 4/1.5 | 1,700 (-1%) | 1mo | $115,000 | $68 | 80 |
| 503 Millington Ave | 0.03mi | 3/1.0 (-1) | 1,703 (-0%) | 22mo | $19,501 | $11 | 75 |
| 2733 Wilkens Ave | 0.26mi | 3/2.0 (-1) | 1,620 (-5%) | 3mo | $135,000 | $83 | 68 |
| 2005 Frederick Ave | 0.56mi | 3/1.0 (-1) | 1,710 (0%) | 10mo | $49,900 | $29 | 60 |
| 420 S Bentalou St | 0.24mi | 3/1.0 (-1) | 1,620 (-5%) | 20mo | $51,000 | $31 | 58 |
| 2807 Frederick Ave | 0.37mi | 3/2.0 (-1) | 1,680 (-2%) | 16mo | $63,000 | $38 | 58 |
| 2717 Wilkens Ave | 0.23mi | 4/3.5 | 1,880 (+10%) | 7mo | $190,000 | $101 | 57 |
| 2211 W Pratt St | 0.40mi | 3/1.0 (-1) | 1,500 (-12%) | 2mo | $30,000 | $20 | 54 |
| 2456 W Baltimore | 0.54mi | 3/1.5 (-1) | 1,464 (-14%) | 11mo | $92,000 | $63 | 35 |
| 1621 Ramsay St | 0.75mi | 3/1.0 (-1) | 1,500 (-12%) | 10mo | $30,500 | $20 | 32 |
| 2108 W Baltimore St | 0.63mi | 3/1.5 (-1) | 1,484 (-13%) | 13mo | $170,000 | $115 | 31 |
Match score weights: distance 35% · size 25% · config 20% · recency 20%. Top-matched comps best support the ARV.
Projected returns pro-forma
-3.0% appreciation · 7.51% rent growth · sell at horizon
- IRR
- 28.9%
- Equity multiple
- 2.28×
- Total profit
- $39,338
- Equity at exit
- $16,401
- IRR
- 38.8%
- Equity multiple
- 5.43×
- Total profit
- $136,386
- Equity at exit
- $9,511
Cash invested: $30,800 (down + closing). Projections, not guarantees.
Landlord ↔ Tenant lean methodology
- Overall (CITY)
- 12 Strongly Tenant-Friendly
- State Maryland
- 27 Tenant-Leaning · D+14
- County
- — inherits STATE
- City Baltimore
- 12 Strongly Tenant-Friendly · D+58
ZIP-level market 21223
- Rents YoY
- 7.5%
- Active inventory
- 422
- Price-to-rent
- 4.9×
Monthly cashflow live
- Estimated rent
- $1,869 high interval (Pro) →
- Mortgage (P&I)
- −$577
- Tax from tax record
- −$95 /mo · $1,145/yr
- Insurance
- −$46
- HOA
- −$0
- Vacancy / Maint / Mgmt
- −$392
- Net cashflow
- $758
Break-even live
UW: 25.0% down · 7.5% · 30yr · 1.5% tax · 5.0% vac · 8.0% maint · 8.0% mgmt
Financing live
Cash to close
- Down payment
- $27,500
- Closing costs
- $3,300
- Reserves months
- —
- Total cash needed
- —
Loan-product check · same deal, 3 products live
Conventional
25% down · 7.5% · 30yr
- Down + closing
- —
- Monthly P&I
- —
- Monthly cashflow
- —
- DSCR
- —
- Eligible?
- —
Personal DTI + credit; lowest rate.
DSCR
20% down · 8.5% · 30yr
- Down + closing
- —
- Monthly P&I
- —
- Monthly cashflow
- —
- DSCR
- —
- Eligible?
- —
No personal income docs; deal must DSCR.
Hard money
10% down · 12.0% · 12mo
- Down + closing
- —
- Monthly P&I
- —
- Monthly cashflow
- —
- DSCR
- —
- Eligible?
- —
Short-term bridge; refi at stabilization.
Rent comps 40 comps
| Address | Beds | Baths | Sqft | Rent | $/sqft | DOM | Units | Dist |
|---|---|---|---|---|---|---|---|---|
| 2509 Christian St Baltimore, MD | 4.0 | 2.0 | 1248 | $1,699 | $1.36 | 3d | 1 | 0.05mi |
| 2514 Wilkens Ave Baltimore, MD | 4.0 | 1.0 | 1344 | $1,800 | $1.34 | 11d | 1 | 0.07mi |
| 2514 Wilkens Ave Baltimore, MD | 4.0 | 1.0 | 1344 | $1,800 | $1.34 | 44d | 1 | 0.07mi |
| 2540 Frederick Ave Baltimore, MD | 3.0 | 1.0 | 1075 | $1,400 | $1.30 | 24d | 1 | 0.21mi |
| 941 Brunswick St Baltimore, MD | 3.0 | 1.5 | 1516 | $1,650 | $1.09 | 18d | 1 | 0.24mi |
| 941 Brunswick St Baltimore, MD | 3.0 | 1.5 | 1558 | $1,600 | $1.03 | 44d | 1 | 0.24mi |
| 2738 Wilkens Ave Baltimore, MD | 3.0 | 1.0 | 1183 | $1,500 | $1.27 | 44d | 1 | 0.25mi |
| 2737 Wilkens Ave Baltimore, MD | 3.0 | 1.5 | 1232 | $1,650 | $1.34 | 4d | 1 | 0.26mi |
| 311 S Pulaski St Baltimore, MD | 5.0 | 3.0 | 1450 | $2,400 | $1.66 | 44d | 1 | 0.43mi |
| 311 S Pulaski St Baltimore, MD | 5.0 | 3.0 | 1450 | $2,400 | $1.66 | 3d | 1 | 0.43mi |
| 514 S Payson St Unit 2 Baltimore, MD | 3.0 | 2.0 | 1264 | $1,750 | $1.38 | 44d | 1 | 0.45mi |
| 2537 Hollins St Baltimore, MD | 3.0 | 2.0 | 1200 | $1,450 | $1.21 | 24d | 1 | 0.46mi |
| 2516 Hollins St Baltimore, MD | 3.0 | 2.0 | 1100 | $1,700 | $1.55 | 44d | 1 | 0.48mi |
| 2225 W Baltimore St Baltimore, MD | 3.0 | 2.5 | 1200 | $1,600 | $1.33 | 24d | 1 | 0.57mi |
| 2232 W Baltimore St Baltimore, MD | 3.0 | 1.0 | 1250 | $1,875 | $1.50 | 24d | 1 | 0.59mi |
| 62 N Gorman Ave Baltimore, MD | 3.0 | 2.0 | 1100 | $2,500 | $2.27 | 18d | 1 | 0.64mi |
| 39 N Bentalou St Baltimore, MD | 3.0 | 2.5 | 1844 | $1,700 | $0.92 | 3d | 1 | 0.64mi |
| 3130 Stafford St Baltimore, MD | 3.0 | 1.0 | 1200 | $1,500 | $1.25 | 20d | 1 | 0.70mi |
| 1633 Sexton St Baltimore, MD | 4.0 | 3.0 | 1748 | $1,999 | $1.14 | 44d | 1 | 0.76mi |
| 1839 W Fayette St Baltimore, MD | 3.0 | 1.5 | 1426 | $1,675 | $1.17 | 24d | 1 | 0.82mi |
| 1635 Frederick Ave Baltimore, MD | 3.0 | 2.0 | 1224 | $1,850 | $1.51 | 44d | 1 | 0.86mi |
| 2012 W Saratoga St Baltimore, MD | 3.0 | 1.0 | 1300 | $1,700 | $1.31 | 24d | 1 | 0.91mi |
| 1814 Penrose Ave Baltimore, MD | 3.0 | 1.0 | 1624 | $1,700 | $1.05 | 18d | 1 | 0.95mi |
| 2609 Lauretta Ave Baltimore, MD | 3.0 | 1.0 | 1286 | $1,675 | $1.30 | 24d | 1 | 0.97mi |
| 2636 Lauretta Ave Baltimore, MD | 3.0 | 2.5 | 1232 | $1,900 | $1.54 | 44d | 1 | 1.00mi |
| 3336 W Caton Ave Baltimore, MD | 3.0 | 2.0 | 1236 | $1,625 | $1.31 | 24d | 1 | 1.02mi |
| 2056 Griffis Ave Baltimore, MD | 3.0 | 1.5 | 1230 | $1,495 | $1.22 | 22d | 1 | 1.04mi |
| 1315 Hollins St Unit 2 Baltimore, MD | 3.0 | 2.0 | 1096 | $1,860 | $1.70 | 4d | 1 | 1.06mi |
| 1315 Hollins St Unit 2 Baltimore, MD | 3.0 | 2.0 | 1096 | $1,950 | $1.78 | 12d | 1 | 1.06mi |
| 1519 Penrose Ave Baltimore, MD | 3.0 | 2.0 | 1200 | $1,875 | $1.56 | 44d | 1 | 1.09mi |
| 1127 S Carey St Baltimore, MD | 3.0 | 2.5 | 1340 | $1,900 | $1.42 | 4d | 1 | 1.10mi |
| 41 N Kossuth St Baltimore, MD | 3.0 | 2.0 | 1216 | $1,800 | $1.48 | 24d | 1 | 1.10mi |
| 104 S Carrollton Ave Baltimore, MD | 3.0 | 4.0 | 1232 | $2,400 | $1.95 | 4d | 1 | 1.12mi |
| 1259 Washington Blvd Baltimore, MD | 3.0 | 3.0 | 1232 | $2,999 | $2.43 | 4d | 1 | 1.13mi |
| 2922 Edmondson Ave Baltimore, MD | 3.0 | 2.0 | 1620 | $1,900 | $1.17 | 44d | 1 | 1.13mi |
| 1243 Washington Blvd Baltimore, MD | 3.0 | 2.0 | 1148 | $1,950 | $1.70 | 44d | 1 | 1.14mi |
| 1115 W Lombard St Baltimore, MD | 3.0 | 1.0 | 1468 | $2,100 | $1.43 | 44d | 1 | 1.17mi |
| 1111 W Lombard St Baltimore, MD | 3.0 | 1.0 | 1200 | $1,295 | $1.08 | 4d | 1 | 1.18mi |
| 1142 Sargeant St Baltimore, MD | 3.0 | 2.0 | 1080 | $1,601 | $1.48 | 2d | 1 | 1.20mi |
| 2303 Calverton Heights Ave Baltimore, MD | 4.0 | 2.0 | 1314 | $2,250 | $1.71 | 24d | 1 | 1.22mi |
Listing history 30 events
-
2026-06-18days on market $110,000 Active 35 DOM
-
2026-06-17days on market $110,000 Active 34 DOM
-
2026-06-16days on market $110,000 Active 33 DOM
-
2026-06-15days on market $110,000 Active 32 DOM
-
2026-06-13days on market $110,000 Active 30 DOM
-
2026-06-09days on market $110,000 Active 26 DOM
-
2026-06-08days on market $110,000 Active 25 DOM
-
2026-06-07days on market $110,000 Active 24 DOM
-
2026-06-04days on market $110,000 Active 21 DOM
-
2026-06-03days on market $110,000 Active 20 DOM
-
2026-06-02days on market $110,000 Active 19 DOM
-
2026-06-01days on market $110,000 Active 18 DOM
-
2026-05-31days on market $110,000 Active 17 DOM
-
2026-05-14$110,000 Active 817-char remark
-
2006-07-10soldstatus $60,000
-
2006-06-01soldstatus $60,000 313-char remark
Show marketing remark (313 chars)
IGNORE DAYS ON THE MARKET, CONTRACT FELL THROUGH. GREAT INVESTMENT PROPERTY, OR PERFECT FOR FIRST TIME HOME BUYER. PROPERTY NEEDS SOME MINOR WORK, BUT SHOWS WELL. SELLER IS OFFERING $3,000 IN CLOSING HELP. PROPERTY BEING SOLD AS IS. THANKS FOR SHOWING AND PLEASE LEAVE A BUSINESS CARD. GROUND RENT TO BE VERIFIED.
-
2006-04-29historical 313-char remark
Show marketing remark (313 chars)
IGNORE DAYS ON THE MARKET, CONTRACT FELL THROUGH. GREAT INVESTMENT PROPERTY, OR PERFECT FOR FIRST TIME HOME BUYER. PROPERTY NEEDS SOME MINOR WORK, BUT SHOWS WELL. SELLER IS OFFERING $3,000 IN CLOSING HELP. PROPERTY BEING SOLD AS IS. THANKS FOR SHOWING AND PLEASE LEAVE A BUSINESS CARD. GROUND RENT TO BE VERIFIED.
-
2005-12-20$60,000 313-char remark
Show marketing remark (313 chars)
IGNORE DAYS ON THE MARKET, CONTRACT FELL THROUGH. GREAT INVESTMENT PROPERTY, OR PERFECT FOR FIRST TIME HOME BUYER. PROPERTY NEEDS SOME MINOR WORK, BUT SHOWS WELL. SELLER IS OFFERING $3,000 IN CLOSING HELP. PROPERTY BEING SOLD AS IS. THANKS FOR SHOWING AND PLEASE LEAVE A BUSINESS CARD. GROUND RENT TO BE VERIFIED.
-
2005-11-28historical
-
2005-11-15
-
2005-10-27historical
-
2005-09-16
-
1999-03-01soldstatus $48,900
-
1999-01-13soldstatus $48,900
-
1998-10-14$48,900
-
1998-10-14historical
-
1998-09-28historical
-
1997-09-22
-
1997-09-19historical
-
1997-04-16
ⓘ Source: listings_history table (triggers on properties + properties_extension) + one-shot
backfill from property_details.listing_events for pre-trigger history.
Tax reassessment forecast MD · Partial reset (capped growth)
- Current annual tax
- $1,145 · $95/mo
- Projected year-2 tax
- $1,172 · $98/mo
- Expected delta
- +$27/yr (+$2/mo · 2.4%)
ⓘ Screening estimate from a state-policy table — verify with the county assessor before closing.
Climate risk First Street
- Flood 1/10 Low FEMA zone X (unshaded) · 0% chance over 30 yrs
- Wildfire 1/10 Low
- Heat 7/10 Severe 7 d/yr ≥103°F today · 15 d/yr by 30 yrs out
- Wind 6/10 Major 27% chance of damaging wind over 30 yrs
- Air quality 3/10 Moderate 3 unhealthy d/yr today · 4 by 30 yrs out
Nearby sold comps map
Loading sold comps map…
Walkable amenities ~0.75 mi
Loading nearby amenities…
Taxation est. · year 1
- Rental income
- $22,425
- − Mortgage interest
- −$6,162
- − Property taxes
- −$1,145
- − Insurance
- −$550
- − Repairs & maintenance
- −$1,794
- − Management
- −$1,794
- − Depreciation
- −$3,200
- Taxable income
- $7,781
- Est. tax owed @ 24.0%
- −$1,867
- After-tax cash flow
- $7,232/yr
For passive investors: Depreciation is non-cash, so a rental often shows a tax loss while cash-flowing — sheltering income. Rental losses are passive: they offset passive income freely, and up to $25,000/yr can offset ordinary (W-2) income if you actively participate and your MAGI is under $100k (phasing out to $0 by $150k); unused losses carry forward. On sale, claimed depreciation is recaptured at up to 25%, and gains may owe capital-gains tax (a 1031 exchange can defer both). Figures are a year-1 estimate at your 24.0% rate — not tax advice; consult a CPA.
Schools (NCES district)
- District
- Baltimore City Public Schools
- NCES district ID
- 2400090
- Math proficiency
- 7% ▼ -9.00%
- Reading proficiency
- 16% ▼ -5.00%
- Median HH income
- $42,108
- Composite
- 10.08/100
- National rank
- #9805
- State rank
- #24 of 24 in MD
Livability — Baltimore
- Score
- 76/100
- State rank
- #90
- US rank
- #3396
Category grades
Schools grade is shown separately in the Schools card above.
Census & demographics
- Census place
- Baltimore, MD
- County
- Baltimore City · 558,601 people
- City population
- 588,727
- Metro
- Baltimore-Columbia-Towson, MD
- Population (ZIP)
- 19,572
- Household income
- $45,840
- Rent vs Own
- Severe rent burden
- 1755.0
Population outlook (Baltimore County) Hauer SSP2
- Today (2025)
- 624,249 people
- By 2030
- 621,541 · -0.4%
- By 2040
- 609,756 · -2.3%
- By 2050
- 597,249 · -4.3%
- By 2075
- 552,236 · -11.5%
- By 2100
- 513,934 · -17.7%
Race, ethnicity, and origin ACS 2023
- Neighborhood character
- Predominantly Black (72%)
- Race & ethnicity
- Black 72% White 16% Hispanic / Latino 7% Two or more races 6% Asian 1%
- Hispanic origin (detail)
- Mexican 3% Puerto Rican 1%
- Common ancestry
- Romanian 1%
- Foreign-born
- 8% · Canada
- Languages at home
- 90% English-only · Spanish 6% French/Haitian/Cajun 2% Other Indo-European 1%
Political lean MEDSL · Baltimore
- 2024 margin
- Solid D (+73.0) · D 85.2% · R 12.2% · Other 2.6%
- 2008→2024 swing
- -2.5pp toward R · 2008: 75.5pp · 2024: 73.0pp
- All cycles
- 2024: D+73.0 2020: D+76.6 2016: D+74.6 2012: D+76.4 2008: D+75.5
Not yet ingested
- Civics
- —
Market trends
- HPI YoY
- ▼ -97.99%
- Current HPI
- 140.5836
- Rent YoY
- ▲ 7.51%
- Metro
- Baltimore-Columbia-Towson, MD
- State GDP YoY
- ▲ 2.97%
- F500 in state
- 12
Industry mix (Fortune 500 HQ in MD)
| Industry | F500 HQs | Revenue |
|---|---|---|
| Aerospace / Defense | 1 | $71B |
|
||
| Utilities | 1 | $25B |
|
||
| Hotels | 1 | $24B |
|
||
| Consumer Goods | 1 | $7B |
|
||
| Real Estate | 1 | $6B |
|
||
| Chemicals | 1 | $2B |
|
||
Price history
+124.9% since first listed17 events — show timeline
- 2026-05-14 Listed $110,000 BRIGHT MLS
- 2006-07-10 Sold (Public Records) $60,000 Public Records
- 2006-06-01 Sold (MLS) $60,000 MRIS
- 2006-04-29 Delisted — MRIS
- 2005-12-20 Listed $60,000 MRIS
- 2005-11-28 Delisted — MRIS
- 2005-11-15 Listed — MRIS
- 2005-10-27 Delisted — MRIS
- 2005-09-16 Listed — MRIS
- 1999-03-01 Sold (Public Records) $48,900 Public Records
- 1999-01-13 Sold (MLS) $48,900 MRIS
- 1998-10-14 Listed $48,900 MRIS
- 1998-10-14 Delisted — MRIS
- 1998-09-28 Delisted — MRIS
- 1997-09-22 Listed — MRIS
- 1997-09-19 Delisted — MRIS
- 1997-04-16 Listed — MRIS
Property tax history
+4.5%/yrLatest (2025): $1,145 · +2.9% YoY. Source: county tax records.
Cash-flow waterfall
monthlySold comps — $/sqft
last 12 mo · ≤1 miLoading sold comps…