 🌊 Lakefront
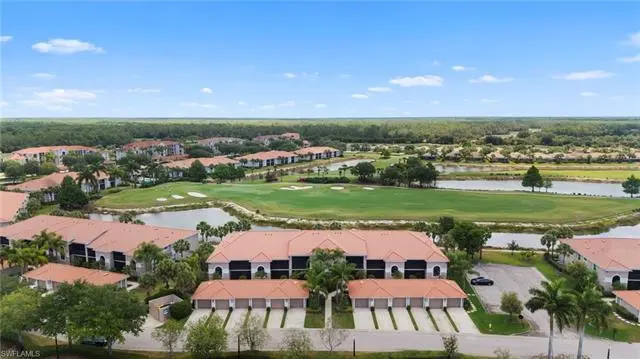
10306 Heritage Bay Blvd #2913 · Heritage Bay, FL
Flood risk 1/10 · Minimal
- FEMA flood zone
- AH
- Chance of flooding over 30 yrs
- 0.0%
- Est. flood insurance / yr
- $1,142 – $2,507
Fire risk 4/10 · Minor
- Est. fire insurance / yr
- $947 – $1,759
Heat risk 10/10 · Severe
- Hot days now (above 108°F)
- 7 days/yr
- Hot days in 30 yrs
- 33 days/yr
Wind risk 10/10 · Severe
- Chance of severe wind over 30 yrs
- 99.0%
Air-quality risk 2/10 · Minimal
- Unhealthy air days now
- 2 days/yr
- Unhealthy air days in 30 yrs
- 2 days/yr
Risk factors via First Street. Map © Google.
Why this score? — see what drove the D grade
The composite is a weighted blend of 9 inputs, each scored 0–100. Each bar is that input's sub-score; the figure is the points it added to the 100-point composite (weight × sub-score).
- Cash flow +12.8/30.0
- ARV discount +7.5/15.0
- 1% rule +6.5/10.0
- Schools +5.0/10.0
- DSCR +3.8/10.0
- Livability +2.5/5.0
- Condition / age +2.5/5.0
- Rent growth +2.1/5.0
- Appreciation +0.0/10.0
$450,000
🖨 Deal sheet 📄 Offer letter ✓ Due diligence
Listing remarks
This single owner, first floor Barrington model Veranda condo is priced to SELL and includes a golf membership to Heritage Bay's 27-hole championship course! Fully TURNKEY with expensive Tommy Bahama furniture and move in READY, with a tremendous water and golf view! This freshly painted condo features large ceramic tile on the diagonal in all common areas, crown molding, stainless appliances, and hurricane IMPACT windows and sliders for peace of mind. Heritage Bay features a stunning 27-hole Lewis-Azinger designed golf course and aqua driving range. The grand clubhouse offers diverse dining options, elegant event spaces, and a lively social scene. Have a bite to eat in The Grille Room- a c
Key facts
- Fitness center
- Golf view
- Resort style pool
Tags
Property features AI
Finance
- Other: Part of a large complex with many units; 12 units in the building
- Financial info: Total annual recurring community fees; Total one-time fees
- HOA & community: Mandatory HOA (Condo management); Master HOA paid annually; Quarterly condo fee; Maintenance covers cable, golf course, internet/Wi‑Fi, irrigation water, lawn/land maintenance, security, and water; Community amenities include clubhouse, community pool and spa, exercise/fitness center, attended fitness center, bocce court, cabana, community room, golf course, library, pickleball, putting green, restaurant, tennis and more; Gated golf-course community (golf bundled)
Exterior
- Parking: Detached garage (1 car); Guest parking
- Security: Gated community with guard at gate and patrolled security
- Utilities: Central water; Central sewer; Cable available
- Home design: Residential property in a low-rise (1–3) carriage/coach building; 2-story building; Rear exposure facing east; Located in Heritage Bay community
- Construction: Built in 2009; Concrete block construction; Stucco exterior; Tile roof; Impact resistant windows and doors
- Exterior features: Screened lanai/porch; Patio; Golf course view; Lake/pond/preserve/water views; Central irrigation
Interior
- Kitchen: Pantry; Dishwasher; Disposal; Microwave; Self-cleaning oven; Refrigerator/ice maker; Breakfast bar and eat-in kitchen
- Bedrooms: 2 bedrooms plus den
- Flooring: Carpet; Tile
- Bathrooms: 2 full bathrooms; Master bath with dual sinks
- Heating & cooling: Central electric heating; Central electric cooling
- Interior features: Pantry; Smoke detectors; Vaulted ceiling; Great room floor plan; Turnkey furnished
- Laundry & utility: Washer; Dryer; Auto garage door
Neighborhood map
What this means for you Summary
Snapshot
- This is a 2-bed/2.0-bath condo listed at $450k.
Deal economics
- At list price, monthly cash flow is $-194 ($-2k/yr) — negative.
- To cash-flow at today's rent, offer at most $416k (7.6% below list).
- Meets the 1% rule at list price ($5k rent vs $450k).
- Recommended offer: $416k (7.6% below list) — sets the bar for cash-flow.
Location & tenants
- Location reads: area grade D — affects rentability + tenant quality, not the cash-flow math above.
- Collier (suburban): math 60% / reading 56% proficiency, ranked #16 of 73 in FL (top 22%) — acceptable for families but not a draw, mixed tenant base, ~2y average lease.
- Zoned schools: Corkscrew Elementary School (math 76% / reading 73%, grade A, #230 of 2,144 statewide, top 12%, 863 students, 35% FRL); Palmetto Ridge High School (math 43% / reading 51%, grade D-, #207 of 667 statewide, top 32%, 2,347 students, 38% FRL) — zoned schools average 37% FRL vs 55% district-wide (18 pts lower); this property's tenant base skews higher-income than the district average.
- Market conditions: Rents soft (-1.6%/yr); 1124 active listings in the ZIP; 18 comparable units currently listed for rent nearby; rentals at typical pace (median 23d on market — plan ~3-4 weeks tenant-placement turnaround); solid renter incomes; 3,520 units permitted in Collier County in 2024 (959 in 5+ unit buildings).
- At $5,182/mo this rent would consume 66% of the median local household income ($94k/yr) (locally 409% of renters already pay >50% of income on rent) — very limited rent-growth headroom before tenants either downsize or default.
Forward outlook
- Local home prices are declining (-3.0%/yr); year-one equity from $3k of loan paydown is wiped out by about $14k of value loss. Plan a longer hold.
- Collier County population projected at +30% by 2050 — long-run rental-demand tailwind backs the buy-and-hold thesis.
Negotiation context
- It's been on market 31 days — a 3% lower offer ($436k) is reasonable based on typical stale-listing flexibility.
- 3 sale attempts since 2y ago with the ask held roughly flat each time — persistent listings suggest the price (not the market) is what's stuck; bring a comps-based counter.
Risks & watch-outs
- Watch-outs: flood insurance adds $152/mo; HOA is 23% of rent.
- Climate carrying-cost: in FEMA flood zone AH (mandatory federal flood insurance); severe wind risk, 99% chance of damaging wind over 30y; extreme-heat days projected 7→33/yr by 2055 (HVAC capex compounding) — expect insurance premiums to compound above CPI over the hold.
Questions for the listing agent
- What do current leases actually rent for vs. the listed asking? Can we see a recent rent roll and the last 12 months of T-12 income?
- It's been on market 31 days. Have you received any prior offers? Is the seller open to a 8% concession, seller financing, or rate buy-down credit?
- What's the actual annual flood-insurance premium (NFIP or private), and is the property in a SFHA with mandatory coverage?
- What does the HOA fee cover, when was the last increase, and are there any pending special assessments or reserve-fund shortfalls?
- Any open or pending special assessments — roof, HVAC, plumbing, elevator, façade? What's the per-unit balance and payoff schedule, and is the seller paying it off at close or rolling it to the buyer?
- Is there a deadline driving the sale (1031 exchange, divorce, estate, relocation)? That informs how much negotiation room exists.
- The area grade is low — what's the realistic commute time and amenity access for the typical tenant pool here? Any planned neighborhood developments (good or bad) we should know about?
- This sits on a lake — are riparian / water-frontage rights deeded with the parcel? Any dock permits, shoreline easements, or HOA water-use restrictions?
- What's the documented flood / surge / shoreline-erosion history here (FEMA AND non-FEMA — e.g., storm surge, creek backup, septic-field saturation)?
- Any water-quality or seasonal algae-bloom issues that affect tenant satisfaction or short-term-rental demand?
- What's the average days-on-market for RENTAL listings here right now (not sales)? A rising rental-DOM trend means longer vacancies and softer asking-rent achievability than the comps imply.
- What's the recent tenant-quality profile in this submarket — average credit score on applications, eviction rate, late-payment / NSF rate, and stable-employment percentage? A property-management company in the area should have these aggregated.
- How much new apartment / multifamily construction is in the pipeline within 1–3 miles? Heavy new supply (>2% of stock underway) typically softens rents 12–24 months out; light construction supports rent growth.
Investment metrics
- 1% rule
- 1.15% ✓
- Cap rate
- 6.18%
- Cash-on-cash
- -0.40%
- DSCR
- 0.98
- GRM
- 7.2
CMA / ARV
No comps found within radius.
Projected returns pro-forma
-3.0% appreciation · 0.0% rent growth · sell at horizon
- IRR
- -24.0%
- Equity multiple
- 0.21×
- Total profit
- $-99,650
- Equity at exit
- $67,096
- IRR
- -38.8%
- Equity multiple
- -0.25×
- Total profit
- $-158,105
- Equity at exit
- $38,908
Cash invested: $126,000 (down + closing). Projections, not guarantees.
Landlord ↔ Tenant lean methodology
- Overall (STATE)
- 87 Strongly Landlord-Friendly
- State Florida
- 87 Strongly Landlord-Friendly · R+3
- County
- — inherits STATE
- City
- — inherits STATE
ZIP-level market 34120
- Rents YoY
- -1.6%
- Active inventory
- 1124
- Price-to-rent
- 7.2×
Monthly cashflow live
- Estimated rent
- $5,182 high interval (Pro) →
- Mortgage (P&I)
- −$2,360
- Tax from tax record
- −$417 /mo · $5,009/yr
- Insurance
- −$188
- Flood insurance flood zone
- −$152 /mo · $1,824/yr
- HOA
- −$1,171
- Vacancy / Maint / Mgmt
- −$1,088
- Net cashflow
- $-194
Break-even live
UW: 25.0% down · 7.5% · 30yr · 1.5% tax · 5.0% vac · 8.0% maint · 8.0% mgmt
Financing live
Cash to close
- Down payment
- $112,500
- Closing costs
- $13,500
- Reserves months
- —
- Total cash needed
- —
Loan-product check · same deal, 3 products live
Conventional
25% down · 7.5% · 30yr
- Down + closing
- —
- Monthly P&I
- —
- Monthly cashflow
- —
- DSCR
- —
- Eligible?
- —
Personal DTI + credit; lowest rate.
DSCR
20% down · 8.5% · 30yr
- Down + closing
- —
- Monthly P&I
- —
- Monthly cashflow
- —
- DSCR
- —
- Eligible?
- —
No personal income docs; deal must DSCR.
Hard money
10% down · 12.0% · 12mo
- Down + closing
- —
- Monthly P&I
- —
- Monthly cashflow
- —
- DSCR
- —
- Eligible?
- —
Short-term bridge; refi at stabilization.
Rent comps 18 comps
| Address | Beds | Baths | Sqft | Rent | $/sqft | DOM | Units | Dist |
|---|---|---|---|---|---|---|---|---|
| 10313 Heritage Bay Blvd #1342 Naples, FL | 2.0 | 2.0 | 1232 | $6,500 | $5.28 | 23d | 1 | 0.06mi |
| 10307 Heritage Bay Blvd Naples, FL | 2.0 | 2.0 | 1194 | $2,800 | $2.35 | 13d | 1 | 0.07mi |
| 10330 Heritage Bay Blvd #2626 Naples, FL | 2.0 | 2.0 | 1414 | $6,900 | $4.88 | 23d | 1 | 0.09mi |
| 10317 Heritage Bay Blvd #1416 Naples, FL | 2.0 | 2.0 | 1232 | $7,000 | $5.68 | 23d | 1 | 0.10mi |
| 10321 Heritage Bay Blvd Naples, FL | 2.0–3.0 | 2.0 | 1320 | $6,500 | $4.92 | 21d | 2 | 0.12mi |
| 10321 Heritage Bay Blvd Naples, FL | 2.0–3.0 | 2.0 | 1301 | $5,400 | $4.15 | 23d | 3 | 0.12mi |
| 10338 Heritage Bay Blvd #2514 Naples, FL | 2.0 | 2.0 | 1414 | $2,500 | $1.77 | 23d | 1 | 0.13mi |
| 10329 Heritage Bay Blvd #1622 Naples, FL | 2.0 | 2.0 | 1232 | $5,500 | $4.46 | 23d | 1 | 0.16mi |
| 10333 Heritage Bay Blvd #1715 Naples, FL | 2.0 | 2.0 | 1194 | $6,000 | $5.03 | 23d | 1 | 0.16mi |
| 10337 Heritage Bay Blvd Naples, FL | 2.0 | 2.0 | 1213 | $4,400 | $3.63 | 23d | 4 | 0.18mi |
| 10345 Heritage Bay Blvd Naples, FL | 2.0 | 2.0 | 1232 | $4,425 | $3.59 | 13d | 2 | 0.24mi |
| 10275 Heritage Bay Blvd Naples, FL | 2.0 | 2.0 | 1301 | $4,500 | $3.46 | 23d | 2 | 0.26mi |
| 10270 Heritage Bay Blvd #3422 Naples, FL | 2.0 | 2.0 | 1414 | $6,500 | $4.60 | 23d | 1 | 0.26mi |
| 10349 Heritage Bay Blvd #2117 Naples, FL | 2.0 | 2.0 | 1232 | $2,300 | $1.87 | 13d | 1 | 0.27mi |
| 10353 Heritage Bay Blvd #2226 Naples, FL | 2.0 | 2.0 | 1232 | $6,500 | $5.28 | 23d | 1 | 0.31mi |
| 10353 Heritage Bay Blvd #2226 Naples, FL | 2.0 | 2.0 | 1232 | $6,500 | $5.28 | 13d | 1 | 0.31mi |
| 10307 Gator Bay Ct Naples, FL | 2.0 | 2.0 | 1855 | $9,900 | $5.34 | 23d | 1 | 0.87mi |
| 10044 Siesta Bay Dr #9412 Naples, FL | 2.0 | 2.0 | 1414 | $2,500 | $1.77 | 23d | 1 | 1.10mi |
HOA detail condo
- Monthly dues
- $1,171 · $14,052/yr
- Likely covers
- water
- Assessments
- None detected in remarks — confirm with the listing agent.
Listing history 22 events
-
2026-06-18days on market $450,000 Active 31 DOM
-
2026-06-17days on market $450,000 Active 30 DOM
-
2026-06-16days on market $450,000 Active 29 DOM
-
2026-06-15days on market $450,000 Active 28 DOM
-
2026-06-14days on market $450,000 Active 26 DOM
-
2026-06-10days on market $450,000 Active 23 DOM
-
2026-06-09days on market $450,000 Active 22 DOM
-
2026-06-08days on market $450,000 Active 21 DOM
-
2026-06-07days on market $450,000 Active 20 DOM
-
2026-06-03days on market $450,000 Active 16 DOM
-
2026-06-02days on market $450,000 Active 15 DOM
-
2026-06-01days on market $450,000 Active 14 DOM
-
2026-05-31days on market $450,000 Active 13 DOM
-
2026-05-30days on market $450,000 Active 12 DOM
-
2026-05-18$450,000 Active
-
2025-04-09historical
-
2025-03-11price $478,000
-
2024-11-21price $498,000
-
2024-07-30$524,000 Active
-
2024-07-29historical
-
2024-07-15price $524,000
-
2024-05-29$549,000 Active
ⓘ Source: listings_history table (triggers on properties + properties_extension) + one-shot
backfill from property_details.listing_events for pre-trigger history.
Tax reassessment forecast FL · Resets to sale price
- Current annual tax
- $5,009 · $417/mo
- Projected year-2 tax
- $5,009 · $417/mo
- Expected delta
- $0/yr ($0/mo · 0.0%)
ⓘ Screening estimate from a state-policy table — verify with the county assessor before closing.
Climate risk First Street
- Flood 1/10 Low FEMA zone AH · 0% chance over 30 yrs
- Wildfire 4/10 Moderate
- Heat 10/10 Extreme 7 d/yr ≥108°F today · 33 d/yr by 30 yrs out
- Wind 10/10 Extreme 99% chance of damaging wind over 30 yrs
- Air quality 2/10 Low 2 unhealthy d/yr today · 2 by 30 yrs out
Nearby sold comps map
Loading sold comps map…
Walkable amenities ~0.75 mi
Loading nearby amenities…
Taxation est. · year 1
- Rental income
- $62,186
- − Mortgage interest
- −$25,207
- − Property taxes
- −$5,009
- − Insurance
- −$4,074
- − Repairs & maintenance
- −$4,975
- − Management
- −$4,975
- − HOA
- −$14,052
- − Depreciation
- −$13,091
- Taxable loss
- −$9,197
- Est. tax savings @ 24.0%
- +$2,207
- After-tax cash flow
- $-119/yr
For passive investors: Depreciation is non-cash, so a rental often shows a tax loss while cash-flowing — sheltering income. Rental losses are passive: they offset passive income freely, and up to $25,000/yr can offset ordinary (W-2) income if you actively participate and your MAGI is under $100k (phasing out to $0 by $150k); unused losses carry forward. On sale, claimed depreciation is recaptured at up to 25%, and gains may owe capital-gains tax (a 1031 exchange can defer both). Figures are a year-1 estimate at your 24.0% rate — not tax advice; consult a CPA.
Schools (NCES district)
- District
- Collier
- NCES district ID
- 1200330
- Math proficiency
- 60% ▼ -4.00%
- Reading proficiency
- 56% ▼ -2.00%
- Median HH income
- $58,275
- Composite
- 50.23/100
- National rank
- #1892
- State rank
- #16 of 73 in FL
Livability — Heritage Bay
No livability data for this city. (Only ~50 U.S. cities are tracked.)
Census & demographics
- Census place
- Heritage Bay, FL
- County
- Collier County · 396,295 people
- Metro
- Naples-Marco Island, FL
- Population (ZIP)
- 42,345
- Household income
- $93,861
- Rent vs Own
- Severe rent burden
- 409.0
Population outlook (Collier County) Hauer SSP2
- Today (2025)
- 420,858 people
- By 2030
- 450,054 · +6.9%
- By 2040
- 502,232 · +19.3%
- By 2050
- 544,932 · +29.5%
- By 2075
- 627,203 · +49.0%
- By 2100
- 659,015 · +56.6%
Race, ethnicity, and origin ACS 2023
- Neighborhood character
- Diverse neighborhood (Simpson 0.58)
- Race & ethnicity
- White 56% Hispanic / Latino 32% Two or more races 23% Black 8% Asian 2%
- Hispanic origin (detail)
- Mexican 8% Puerto Rican 2% Cuban 13%
- Common ancestry
- Hispanic 4% Romanian 3% Italian 2%
- Foreign-born
- 28% · Canada, Jamaica, China
- Languages at home
- 62% English-only · Spanish 28% French/Haitian/Cajun 5% Other Indo-European 3%
Political lean MEDSL · Collier
- 2024 margin
- Solid R (+33.1) · D 33.1% · R 66.2%
- 2008→2024 swing
- -10.6pp toward R · 2008: -22.5pp · 2024: -33.1pp
- All cycles
- 2024: R+33.1 2020: R+24.7 2016: R+26.0 2012: R+30.1 2008: R+22.5
Not yet ingested
- Civics
- —
Market trends
- HPI YoY
- ▼ -223.18%
- Current HPI
- 316.2474
- Rent YoY
- ▼ -1.65%
- Metro
- Naples-Marco Island, FL
- State GDP YoY
- ▲ 3.28%
- F500 in state
- 36
Industry mix (Fortune 500 HQ in FL)
| Industry | F500 HQs | Revenue |
|---|---|---|
| Industrial Technology | 2 | $29B |
|
||
| Insurance | 2 | $17B |
|
||
| Retail | 1 | $60B |
|
||
| Technology Distribution | 1 | $58B |
|
||
| Homebuilding | 1 | $35B |
|
||
| Technology Manufacturing | 1 | $35B |
|
||
Price history
-18.0% since first listed8 events — show timeline
- 2026-05-18 Listed $450,000 NAPLESMLS
- 2025-04-09 Listing Removed — NAPLESMLS
- 2025-03-11 Price Changed $478,000 NAPLESMLS
- 2024-11-21 Price Changed $498,000 NAPLESMLS
- 2024-07-30 Listed $524,000 NAPLESMLS
- 2024-07-29 Listing Removed — NAPLESMLS
- 2024-07-15 Price Changed $524,000 NAPLESMLS
- 2024-05-29 Listed $549,000 NAPLESMLS
Property tax history
+8.5%/yrLatest (2025): $5,009 · +2.8% YoY. Source: county tax records.
Cash-flow waterfall
monthlySold comps — $/sqft
last 12 mo · ≤1 miLoading sold comps…