 Duplex
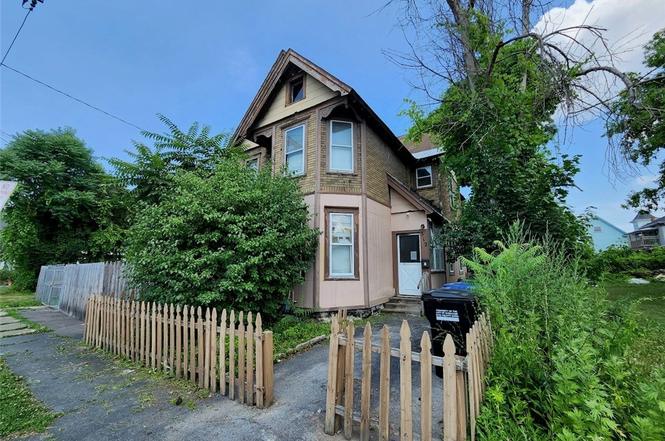
312 Richmond Ave #314 · Syracuse, NY
Flood risk No data
- FEMA flood zone
- —
- Chance of flooding over 30 yrs
- —
- Est. flood insurance / yr
- —
Fire risk No data
- Est. fire insurance / yr
- —
Heat risk No data
- Hot days now (above threshold)
- —
- Hot days in 30 yrs
- —
Wind risk No data
- Chance of severe wind over 30 yrs
- —
Air-quality risk No data
- Unhealthy air days now
- —
- Unhealthy air days in 30 yrs
- —
Risk factors via First Street. Map © Google.
Why this score? — see what drove the C+ grade
The composite is a weighted blend of 9 inputs, each scored 0–100. Each bar is that input's sub-score; the figure is the points it added to the 100-point composite (weight × sub-score).
- Cash flow +15.0/30.0
- ARV discount +15.0/15.0
- Appreciation +10.0/10.0
- 1% rule +5.0/10.0
- DSCR +5.0/10.0
- Rent growth +4.6/5.0
- Livability +3.9/5.0
- Condition / age +2.5/5.0
- Schools +1.8/10.0
$80,000
🖨 Deal sheet (PDF) 📄 Offer letter ✓ Due diligence
Multi-family units
County records classify this as Multi-Family (2-4 Unit). Listing-text estimate: 2 units. confirmed
Listing remarks
Are you looking for your next investment property? Look no further! This 2 family residence offers a double lot with a huge paved driveway that could fit 8-10 cars! There is also a private large backyard that is fully fenced. Each unit offers 3 bedrooms and 1 bath as well as formal dining rooms! There is a full unfinished attic and a full basement, so there is plenty of storage. Both units are vacant, so set your own rent! Property does need some TLC, but there is a lot of potential. Sold "As-Is" Schedule your showing today!
Key facts
- Fully fenced
- Double lot
- Full basement
Tags
Neighborhood map
What this means for you Summary
Snapshot
- This is a 2 × 3-bed/1.0-bath units multifamily listed at $80k.
Deal economics
- At list price, monthly cash flow is $2k ($29k/yr) — positive. Per door: $1k/mo.
- The deal already cash-flows at list — no discount required.
- Meets the 1% rule at list price ($4k rent vs $80k).
- Recommended offer: $75k (6.0% below list) — sets the bar for market timing.
- Cap rate 42.9% vs local median 8.2% in Syracuse — top-decile yield for the area; either an underpriced asset or a hidden risk that comps aren't pricing in. Stress-test before assuming the spread holds.
Location & tenants
- Location reads 77/100 on livability (#187 in NY, #2,869 nationally) — a middle-class / working-renter tenant base. Strengths: amenities A+, commute A+, cost of living A+; Watch: crime F, employment D-.
- Syracuse City School District (urban): math 18% / reading 26% proficiency, ranked #590 of 590 in NY (top 100%) — low school quality limits family demand, transient renter base, plan for 1-2y turnover; 74% free/reduced lunch — lower-income household profile, screen leases tightly.
- Zoned schools: Syracuse Latin School (math 31% / reading 62%, grade D-, #1,262 of 2,108 statewide, top 60%, 642 students, 42% FRL); Expeditionary Learning Middle School (math 17% / reading 32%, grade F, #611 of 729 statewide, top 88%, 170 students, 76% FRL); Institute of Technology At Syracuse Central (math 87% / reading 92%, grade A+, #265 of 1,100 statewide, top 26%, 581 students, 68% FRL).
- Zoned-school proficiency averages 54% at this address vs 22% district-wide (+32 pts) — the actual schools serving this property are materially stronger than the Syracuse City School District average implies; a family-tenant draw the district grade alone would hide.
- Market conditions: Rents rising fast (+8.2%/yr); 121 active listings in the ZIP; 616 units permitted in Onondaga County in 2024 (256 in 5+ unit buildings).
Forward outlook
- In year one you build about $9k of equity ($553 loan paydown + $8k appreciation (10.0% local appreciation)).
- Onondaga County population projected to shrink 9% by 2050 — rents likely to lag national; underwrite the cash flow, not the appreciation.
- At projected returns (10.0% appreciation + 8.0% rent growth), your $22k cash investment doubles in ~1 year — after that, you're playing with house money.
- By year 4, paydown + projected appreciation supports a ~$30k cash-out refi (75% LTV) — recoverable capital for the next deal without selling this one.
Negotiation context
- It's been on market 73 days — a 6% lower offer ($75k) is reasonable based on typical stale-listing flexibility.
- 2 sale attempts; this cycle's ask has dropped $39k (33%) from the opening price — seller is motivated, your offer sets the floor, not the list.
Risks & watch-outs
- Watch-outs: built in 1900 — expect roof / HVAC / electrical / plumbing capex.
Questions for the listing agent
- It's been on market 73 days. Have you received any prior offers? Is the seller open to a 6% concession, seller financing, or rate buy-down credit?
- Can we see the unit-by-unit rent roll, current vacancy, and any below-market leases? What's the average tenancy length?
- What capital expenditures (roof, boiler, parking lot, exteriors) have been made in the last 5 years, and what's planned in the next 2?
- Built in 1900 — when were the roof, HVAC, electrical panel, plumbing, and water heater last replaced?
- Why hasn't it sold? Are there any deal-killer items the seller is aware of (foundation, flood, title, zoning, code violations)?
- Is there a deadline driving the sale (1031 exchange, divorce, estate, relocation)? That informs how much negotiation room exists.
- Schools are D-rated, which usually means shorter tenancies and higher turnover. Who's the typical renter profile here, and what's been the actual vacancy rate?
- Crime grade is F in this area — have there been break-ins, vandalism, or insurance claims at this property in the last 3 years? What carrier currently insures it and at what premium?
- What's the average days-on-market for RENTAL listings here right now (not sales)? A rising rental-DOM trend means longer vacancies and softer asking-rent achievability than the comps imply.
- What's the recent tenant-quality profile in this submarket — average credit score on applications, eviction rate, late-payment / NSF rate, and stable-employment percentage? A property-management company in the area should have these aggregated.
- How much new apartment / multifamily construction is in the pipeline within 1–3 miles? Heavy new supply (>2% of stock underway) typically softens rents 12–24 months out; light construction supports rent growth.
Investment metrics
- 1% rule
- 4.74% ✓
- Cap rate
- 42.91%
- Cash-on-cash
- 130.78%
- DSCR
- 6.82
- GRM
- 1.8
CMA / ARV
- ARV (on-the-fly)
- $126,448
- Comps found
- 12
Show comp detail 12 sales within ~0.75 mi
| Address | Dist | Beds/Ba | Sqft | Sold | Price | $/sf | Match |
|---|---|---|---|---|---|---|---|
| 312 Richmond Ave #314 | 0.00mi | 6/2.0 | 2,258 (0%) | 1mo | $79,000 | $35 | 100 |
| 211 N Geddes St | 0.04mi | 6/2.0 | 2,198 (-3%) | 5mo | $140,000 | $64 | 89 |
| 113 Eureka St | 0.36mi | 5/2.0 (-1) | 2,280 (+1%) | 3mo | $215,000 | $94 | 74 |
| 314 Apple St | 0.30mi | 6/2.0 | 2,160 (-4%) | 7mo | $120,000 | $56 | 73 |
| 131 Lakeview Ave | 0.21mi | 5/2.0 (-1) | 2,068 (-8%) | 11mo | $100,000 | $48 | 62 |
| 122 Bryant Ave | 0.47mi | 5/2.0 (-1) | 2,240 (-1%) | 24mo | $275,000 | $123 | 52 |
| 135-137 Whittier Ave | 0.49mi | 6/2.0 | 2,432 (+8%) | 18mo | $240,000 | $99 | 49 |
| 136 Lakeview Ave | 0.22mi | 7/2.0 (+1) | 1,992 (-12%) | 22mo | $130,000 | $65 | 46 |
| 199 Lakeview Ave | 0.31mi | 5/2.0 (-1) | 2,034 (-10%) | 23mo | $55,000 | $27 | 45 |
| 413 Merriman Ave | 0.72mi | 5/2.0 (-1) | 2,206 (-2%) | 18mo | $94,900 | $43 | 42 |
| 531 Seymour St | 0.60mi | 7/2.0 (+1) | 2,464 (+9%) | 20mo | $103,000 | $42 | 36 |
| 460 Shonnard St | 0.62mi | 6/3.0 | 2,556 (+13%) | 15mo | $99,000 | $39 | 32 |
Match score weights: distance 35% · size 25% · config 20% · recency 20%. Top-matched comps best support the ARV.
Projected returns pro-forma
10.0% appreciation · 8.0% rent growth · sell at horizon
- IRR
- —
- Equity multiple
- 10.78×
- Total profit
- $219,140
- Equity at exit
- $72,070
- IRR
- —
- Equity multiple
- 26.57×
- Total profit
- $572,794
- Equity at exit
- $155,422
Cash invested: $22,400 (down + closing). Projections, not guarantees.
Landlord ↔ Tenant lean methodology
- Overall (STATE)
- 15 Strongly Tenant-Friendly
- State New York
- 15 Strongly Tenant-Friendly · D+10
- County
- — inherits STATE
- City
- — inherits STATE
ZIP-level market 13204
- Home prices YoY
- 31.6%
- Rents YoY
- 8.2%
- Active inventory
- 121
- Price-to-rent
- 3.5×
Monthly cashflow live
- Estimated rent
- $3,790 high interval (Pro) →
- Mortgage (P&I)
- −$420
- Tax est. 1.5%
- −$100 /mo · $1,200/yr
- Insurance
- −$33
- HOA
- −$0
- Vacancy / Maint / Mgmt
- −$796
- Net cashflow
- $2,441
Break-even live
Sensitivity live
| Price | -10% $2,497 | -5% $2,469 | +0% $2,441 | +5% $2,414 | +10% $2,386 |
|---|---|---|---|---|---|
| Rent | -10% $2,142 | -5% $2,292 | +0% $2,441 | +5% $2,591 | +10% $2,741 |
| Rate | -1.0pp $2,482 | -0.5pp $2,462 | base $2,441 | +0.5pp $2,421 | +1.0pp $2,399 |
2-unit breakdown (identical units grouped — click to expand)
| Units | Beds | Baths | Est. rent |
|---|---|---|---|
| 2× units | 3 | 1 | $3,790 |
| #1 | 3 | 1 | $1,895 |
| #2 | 3 | 1 | $1,895 |
| Total (2 units) | $3,790 | ||
UW: 25.0% down · 7.5% · 30yr · 1.5% tax · 5.0% vac · 8.0% maint · 8.0% mgmt
Financing live
Cash to close
- Down payment
- $20,000
- Closing costs
- $2,400
- Reserves months
- —
- Total cash needed
- —
Loan-product check · same deal, 3 products live
Conventional
25% down · 7.5% · 30yr
- Down + closing
- —
- Monthly P&I
- —
- Monthly cashflow
- —
- DSCR
- —
- Eligible?
- —
Personal DTI + credit; lowest rate.
DSCR
20% down · 8.5% · 30yr
- Down + closing
- —
- Monthly P&I
- —
- Monthly cashflow
- —
- DSCR
- —
- Eligible?
- —
No personal income docs; deal must DSCR.
Hard money
10% down · 12.0% · 12mo
- Down + closing
- —
- Monthly P&I
- —
- Monthly cashflow
- —
- DSCR
- —
- Eligible?
- —
Short-term bridge; refi at stabilization.
Listing history 7 events
-
2026-03-24status Pending
-
2026-03-04status Active
-
2025-09-02status Pending
-
2025-08-25price $80,000
-
2025-08-10price $90,000
-
2025-07-25price $100,000
-
2025-07-11$119,000 Active
ⓘ Source: listings_history table (triggers on properties + properties_extension) + one-shot
backfill from property_details.listing_events for pre-trigger history.
Nearby sold comps map
Loading sold comps map…
Walkable amenities ~0.75 mi
Loading nearby amenities…
Taxation est. · year 1
- Rental income
- $45,480
- − Mortgage interest
- −$4,481
- − Property taxes
- −$1,200
- − Insurance
- −$400
- − Repairs & maintenance
- −$3,638
- − Management
- −$3,638
- − Depreciation
- −$2,327
- Taxable income
- $29,795
- Est. tax owed @ 24.0%
- −$7,151
- After-tax cash flow
- $22,144/yr
For passive investors: Depreciation is non-cash, so a rental often shows a tax loss while cash-flowing — sheltering income. Rental losses are passive: they offset passive income freely, and up to $25,000/yr can offset ordinary (W-2) income if you actively participate and your MAGI is under $100k (phasing out to $0 by $150k); unused losses carry forward. On sale, claimed depreciation is recaptured at up to 25%, and gains may owe capital-gains tax (a 1031 exchange can defer both). Figures are a year-1 estimate at your 24.0% rate — not tax advice; consult a CPA.
Schools (NCES district)
- District
- Syracuse City School District
- NCES district ID
- 3628590
- Math proficiency
- 18% ▼ -5.00%
- Reading proficiency
- 26% ▬ 0.00%
- Median HH income
- $32,097
- Composite
- 17.83/100
- National rank
- #9007
- State rank
- #590 of 590 in NY
Livability — Syracuse
- Score
- 77/100
- State rank
- #187
- US rank
- #2869
Category grades
Schools grade is shown separately in the Schools card above.
Census & demographics
- Census place
- Syracuse, NY
- County
- Onondaga County · 247,257 people
- City population
- 152,627
- Metro
- Syracuse, NY
- Population (ZIP)
- 19,440
- Household income
- $45,351
- Rent vs Own
- Severe rent burden
- 2073.0
Population outlook (Onondaga County) Hauer SSP2
- Today (2025)
- 467,894 people
- By 2030
- 463,381 · -1.0%
- By 2040
- 447,697 · -4.3%
- By 2050
- 426,399 · -8.9%
- By 2075
- 373,661 · -20.1%
- By 2100
- 307,967 · -34.2%
Race, ethnicity, and origin ACS 2023
- Neighborhood character
- Diverse neighborhood (Simpson 0.68)
- Race & ethnicity
- White 47% Black 26% Hispanic / Latino 17% Two or more races 13% Native American 1%
- Hispanic origin (detail)
- Puerto Rican 12% Cuban 2% Dominican 1%
- Common ancestry
- Romanian 5% Lithuanian 2% Subsaharan African 2%
- Foreign-born
- 7% · Canada, Jamaica
- Languages at home
- 83% English-only · Spanish 11% Russian/Polish/Slavic 3% Arabic 1%
Political lean MEDSL · Onondaga
- 2024 margin
- D (+17.3) · D 58.6% · R 41.4%
- 2008→2024 swing
- -3.0pp toward R · 2008: 20.3pp · 2024: 17.3pp
- All cycles
- 2024: D+17.3 2020: D+20.6 2016: D+12.8 2012: D+21.1 2008: D+20.3
Not yet ingested
- Civics
- —
Market trends
- HPI YoY
- ▲ 100.14%
- Current HPI
- 416.7272
- Rent YoY
- ▲ 8.24%
- Metro
- Syracuse, NY
- State GDP YoY
- ▲ 2.60%
- F500 in state
- 92
Industry mix (Fortune 500 HQ in NY)
| Industry | F500 HQs | Revenue |
|---|---|---|
| Financial Services | 10 | $950B |
|
||
| Consumer Goods | 9 | $162B |
|
||
| Insurance | 4 | $225B |
|
||
| Telecommunications | 2 | $144B |
|
||
| Pharmaceuticals | 2 | $112B |
|
||
| Media / Entertainment | 2 | $69B |
|
||
Price history
-32.8% since first listed7 events — show timeline
- 2026-03-24 Pending — CNYIS
- 2026-03-04 Relisted — CNYIS
- 2025-09-02 Pending — CNYIS
- 2025-08-25 Price Changed $80,000 CNYIS
- 2025-08-10 Price Changed $90,000 CNYIS
- 2025-07-25 Price Changed $100,000 CNYIS
- 2025-07-11 Listed $119,000 CNYIS
Cash-flow waterfall
monthlySold comps — $/sqft
last 12 mo · ≤1 miLoading sold comps…