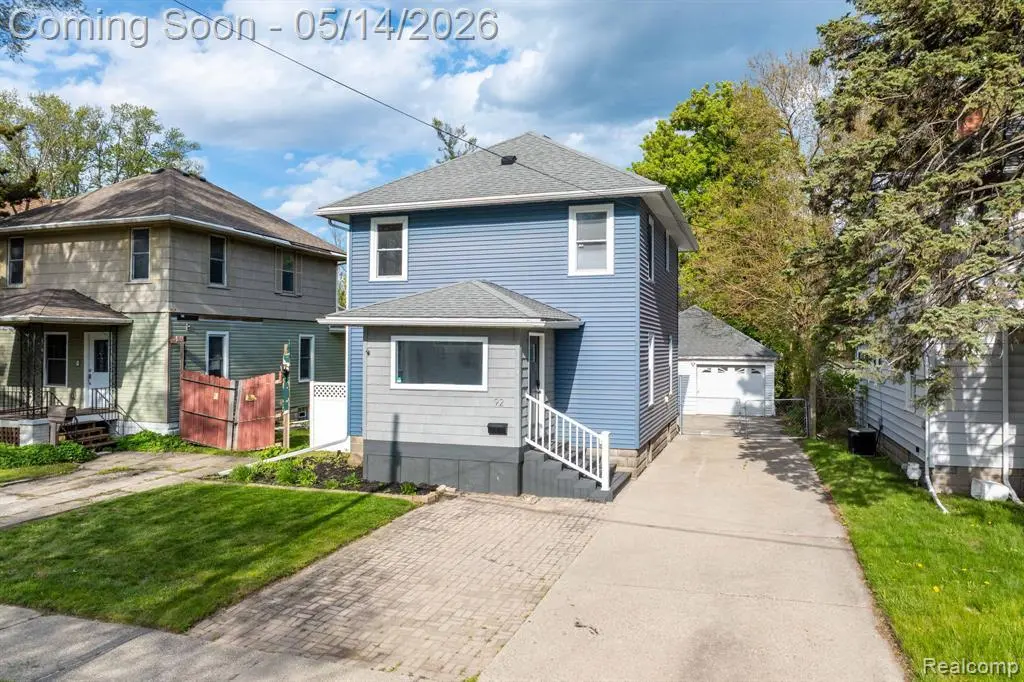
92 Eldredge St · Mount Clemens, MI
Flood risk 1/10 · Minimal
- FEMA flood zone
- X (unshaded)
- Chance of flooding over 30 yrs
- 0.0%
- Est. flood insurance / yr
- $473 – $860
Fire risk 1/10 · Minimal
- Est. fire insurance / yr
- $784 – $1,456
Heat risk 3/10 · Minor
- Hot days now (above 96°F)
- 7 days/yr
- Hot days in 30 yrs
- 15 days/yr
Wind risk 1/10 · Minimal
- Chance of severe wind over 30 yrs
- —
Air-quality risk 4/10 · Minor
- Unhealthy air days now
- 4 days/yr
- Unhealthy air days in 30 yrs
- 6 days/yr
Risk factors via First Street. Map © Google.
Why this score? — see what drove the D grade
The composite is a weighted blend of 9 inputs, each scored 0–100. Each bar is that input's sub-score; the figure is the points it added to the 100-point composite (weight × sub-score).
- ARV discount +14.1/15.0
- Cash flow +11.7/30.0
- Rent growth +5.0/5.0
- Livability +3.9/5.0
- 1% rule +3.4/10.0
- DSCR +3.4/10.0
- Condition / age +2.5/5.0
- Schools +0.6/10.0
- Appreciation +0.0/10.0
$179,900
🖨 Deal sheet (PDF) 📄 Offer letter ✓ Due diligence
Listing remarks MLS
* * All Offers Due By 3PM Saturday May 16th * * Move right into this beautifully updated 3-bedroom, 2 full bath Colonial in the heart of Mount Clemens! Featuring fresh paint throughout, updated kitchen and baths, and a functional layout full of charm and natural light. Enjoy a spacious backyard designed for entertaining with plenty of room to relax, host gatherings, or enjoy summer nights. Complete with a detached garage and convenient location near shopping, dining, and major freeways, this home is ready for its next owner to enjoy.
Key facts
- 7,405 sq ft lot
- 2 garage spots
- Built 1925
Property features AI
Exterior
- Parking: Detached 2-car garage
- Utilities: Public water; Public sewer
- Home design: Single-family residence; Two levels; Ground-level entry with steps; Residential property
- Construction: Vinyl siding; Block foundation; Asphalt roof; Built on two levels
- Exterior features: Deck; Enclosed porch; Porch; Paved road access
Interior
- Kitchen: Free-standing gas range; Free-standing refrigerator; Dishwasher; Disposal
- Bathrooms: 2 full bathrooms
- Heating & cooling: Forced air heating (natural gas); Central air conditioning
- Interior features: Finished, full basement; 6 total rooms
- Laundry & utility: Washer; Dryer; Gas water heater
Neighborhood map
What this means for you Summary
Snapshot
- This is a 3-bed/2.0-bath single-family listed at $180k.
Deal economics
- At list price, monthly cash flow is $-53 ($-630/yr) — negative.
- To cash-flow at today's rent, offer at most $171k (5.2% below list).
- To meet the 1% rule (rent ≥ 1% of price), the offer needs to be $151k (16.0% below list).
- Recommended offer: $151k (16.0% below list) — sets the bar for 1% rule.
- Cap rate 5.9% vs local median 3.0% in Mount Clemens — top-decile yield for the area; either an underpriced asset or a hidden risk that comps aren't pricing in. Stress-test before assuming the spread holds.
Location & tenants
- Location reads 77/100 on livability (#120 in MI, #2,918 nationally) — a middle-class / working-renter tenant base. Strengths: commute A+, cost of living A+, housing A+; Watch: schools D+, crime D+, amenities D+.
- Mount Clemens Community School District (suburban): math 4% / reading 11% proficiency, ranked #532 of 540 in MI (top 98%) — low school quality limits family demand, transient renter base, plan for 1-2y turnover; 80% free/reduced lunch — lower-income household profile, screen leases tightly.
- Market conditions: Rents rising fast (+10.8%/yr); 69 active listings in the ZIP; 13 comparable units currently listed for rent nearby; rentals leasing fast (median 4d on market — plan ~1-2 weeks tenant-placement turnaround); 1,321 units permitted in Macomb County in 2024 (86 in 5+ unit buildings).
- This rent runs 35% of the median local income ($52k/yr) — at the standard rent-burdened threshold; future hikes will face affordability resistance.
Forward outlook
- Local home prices are declining (-3.0%/yr); year-one equity from $1k of loan paydown is wiped out by about $5k of value loss. Plan a longer hold.
- Macomb County population projected at +9% by 2050 — modest demand growth; plan on rents tracking national, not racing it.
Negotiation context
- Only 11 days on market — expect competitive offers; lowballing is unlikely to land.
- 9 sale attempts since 22y ago with the ask held roughly flat each time — persistent listings suggest the price (not the market) is what's stuck; bring a comps-based counter.
- Current owner paid $40k; list at $180k implies a 350% gain — meaningful room to come down on a strong offer.
Risks & watch-outs
- Watch-outs: built in 1925 — expect roof / HVAC / electrical / plumbing capex.
Questions for the listing agent
- What do current leases actually rent for vs. the listed asking? Can we see a recent rent roll and the last 12 months of T-12 income?
- Built in 1925 — when were the roof, HVAC, electrical panel, plumbing, and water heater last replaced?
- Is there a deadline driving the sale (1031 exchange, divorce, estate, relocation)? That informs how much negotiation room exists.
- Schools are D-rated, which usually means shorter tenancies and higher turnover. Who's the typical renter profile here, and what's been the actual vacancy rate?
- Crime grade is D in this area — have there been break-ins, vandalism, or insurance claims at this property in the last 3 years? What carrier currently insures it and at what premium?
- The area grade is low — what's the realistic commute time and amenity access for the typical tenant pool here? Any planned neighborhood developments (good or bad) we should know about?
- What's the average days-on-market for RENTAL listings here right now (not sales)? A rising rental-DOM trend means longer vacancies and softer asking-rent achievability than the comps imply.
- What's the recent tenant-quality profile in this submarket — average credit score on applications, eviction rate, late-payment / NSF rate, and stable-employment percentage? A property-management company in the area should have these aggregated.
- How much new for-sale + rental construction is in the pipeline within 1–3 miles? Heavy new supply typically softens prices + rents 12–24 months out; constrained supply supports both.
Investment metrics
- 1% rule
- 0.84% ✗
- Cap rate
- 5.94%
- Cash-on-cash
- -1.25%
- DSCR
- 0.94
- GRM
- 9.9
CMA / ARV
- ARV (median comp)
- $211,028
- List price
- $179,900
- Delta
- -14.75%
- Verdict
- UNDERPRICED
- Comps
- 20 within 1.0 mi
Show comp detail 12 sales within ~0.75 mi
| Address | Dist | Beds/Ba | Sqft | Sold | Price | $/sf | Match |
|---|---|---|---|---|---|---|---|
| 288 Jones St | 0.33mi | 3/1.5 | 1,308 (+7%) | 6mo | $169,900 | $130 | 66 |
| 57 Madison Ave | 0.21mi | 3/2.0 | 1,380 (+13%) | 4mo | $209,900 | $152 | 65 |
| 26 Hollywood Ct | 0.57mi | 3/1.0 | 1,260 (+3%) | 1mo | $170,500 | $135 | 63 |
| 217 Jones St | 0.50mi | 3/1.0 | 1,330 (+9%) | 4mo | $141,000 | $106 | 54 |
| 21 Logan St | 0.59mi | 3/1.0 | 1,114 (-9%) | 0mo | $160,000 | $144 | 54 |
| 72 Gratiot Ave | 0.41mi | 3/1.0 | 1,045 (-14%) | 1mo | $169,900 | $163 | 52 |
| 104 Logan St | 0.69mi | 3/2.5 | 1,302 (+7%) | 5mo | $205,000 | $157 | 51 |
| 38 S Rose St | 0.53mi | 3/1.5 | 1,080 (-12%) | 6mo | $213,000 | $197 | 49 |
| 142 Miller St | 0.74mi | 3/2.0 | 1,328 (+9%) | 4mo | $227,500 | $171 | 47 |
| 75 Church St | 0.60mi | 3/2.0 | 1,380 (+13%) | 5mo | $305,000 | $221 | 46 |
| 33 Gallup St | 0.65mi | 3/1.0 | 1,340 (+10%) | 6mo | $170,000 | $127 | 44 |
| 24 Alter Ct | 0.69mi | 3/1.0 | 1,080 (-12%) | 5mo | $180,000 | $167 | 41 |
Match score weights: distance 35% · size 25% · config 20% · recency 20%. Top-matched comps best support the ARV.
Projected returns pro-forma
-3.0% appreciation · 8.0% rent growth · sell at horizon
- IRR
- -12.9%
- Equity multiple
- 0.51×
- Total profit
- $-24,483
- Equity at exit
- $26,824
- IRR
- 2.5%
- Equity multiple
- 1.22×
- Total profit
- $10,835
- Equity at exit
- $15,554
Cash invested: $50,372 (down + closing). Projections, not guarantees.
Landlord ↔ Tenant lean methodology
- Overall (STATE)
- 62 Landlord-Friendly
- State Michigan
- 62 Landlord-Friendly · EVEN
- County
- — inherits STATE
- City
- — inherits STATE
ZIP-level market 48043
- Rents YoY
- 10.8%
- Active inventory
- 69
- Price-to-rent
- 9.9×
Monthly cashflow live
- Estimated rent
- $1,512 high interval (Pro) →
- Mortgage (P&I)
- −$943
- Tax from tax record
- −$228 /mo · $2,740/yr
- Insurance
- −$75
- HOA
- −$0
- Vacancy / Maint / Mgmt
- −$317
- Net cashflow
- $-53
Break-even live
Sensitivity live
| Price | -10% $49 | -5% $-2 | +0% $-53 | +5% $-103 | +10% $-154 |
|---|---|---|---|---|---|
| Rent | -10% $-172 | -5% $-112 | +0% $-53 | +5% $7 | +10% $67 |
| Rate | -1.0pp $38 | -0.5pp $-7 | base $-53 | +0.5pp $-99 | +1.0pp $-147 |
UW: 25.0% down · 7.5% · 30yr · 1.5% tax · 5.0% vac · 8.0% maint · 8.0% mgmt
Financing live
Cash to close
- Down payment
- $44,975
- Closing costs
- $5,397
- Reserves months
- —
- Total cash needed
- —
Loan-product check · same deal, 3 products live
Conventional
25% down · 7.5% · 30yr
- Down + closing
- —
- Monthly P&I
- —
- Monthly cashflow
- —
- DSCR
- —
- Eligible?
- —
Personal DTI + credit; lowest rate.
DSCR
20% down · 8.5% · 30yr
- Down + closing
- —
- Monthly P&I
- —
- Monthly cashflow
- —
- DSCR
- —
- Eligible?
- —
No personal income docs; deal must DSCR.
Hard money
10% down · 12.0% · 12mo
- Down + closing
- —
- Monthly P&I
- —
- Monthly cashflow
- —
- DSCR
- —
- Eligible?
- —
Short-term bridge; refi at stabilization.
Rent comps 13 comps
| Address | Beds | Baths | Sqft | Rent | $/sqft | DOM | Units | Dist |
|---|---|---|---|---|---|---|---|---|
| 40 Ferrin Pl Mount Clemens, MI | 3.0 | 1.0 | 1400 | $1,700 | $1.21 | 0d | 1 | 0.27mi |
| 15 Washington St Unit 2 Mt Clemens, MI | 3.0 | 1.0 | 1396 | $1,400 | $1.00 | 45d | 1 | 0.27mi |
| 20 Lincoln St Unit 225 Mt Clemens, MI | 2.0 | 1.0 | 816 | $1,200 | $1.47 | 45d | 1 | 0.36mi |
| 35 S Groesbeck Hwy Mt Clemens, MI | 1.0–2.0 | 1.0–1.5 | 1125 | $2,050 | $1.82 | 0d | 1 | 0.66mi |
| 121 Jones St Unit 2 Mt Clemens, MI | 2.0 | 1.0 | 1050 | $1,600 | $1.52 | 3d | 1 | 0.73mi |
| 121 Jones St Unit 1 Mt Clemens, MI | 2.0 | 1.0 | 1080 | $1,400 | $1.30 | 0d | 1 | 0.73mi |
| 277 N Rose St Mt Clemens, MI | 1.0–2.0 | 1.0 | 755 | $1,434 | $1.90 | 0d | 2 | 0.79mi |
| 133 S Christine Cir Unit 1 Mt Clemens, MI | 3.0 | 1.5 | 1040 | $1,500 | $1.44 | 0d | 1 | 0.82mi |
| 176 N Christine Cir Unit 1 Mt Clemens, MI | 2.0 | 1.5 | 1020 | $1,300 | $1.27 | 45d | 1 | 0.86mi |
| 64 Crocker Blvd Mt Clemens, MI | 2.0 | 1.0 | 950 | $1,250 | $1.32 | 45d | 1 | 0.89mi |
| 70 Crocker Blvd Mt Clemens, MI | 2.0 | 1.0 | 950 | $1,400 | $1.47 | 11d | 1 | 0.89mi |
| 104 Crocker Blvd Mt Clemens, MI | 2.0 | 1.0 | 854 | $1,250 | $1.46 | 6d | 1 | 0.99mi |
| 23128 Wellington Cres Clinton Twp, MI | 1.0–2.0 | 1.0 | 850 | $1,375 | $1.62 | 0d | 6 | 1.39mi |
Listing history 21 events
-
2026-05-17historical Accepting Backup Offers 542-char remark
Show marketing remark (542 chars)
* * All Offers Due By 3PM Saturday May 16th * * Move right into this beautifully updated 3-bedroom, 2 full bath Colonial in the heart of Mount Clemens! Featuring fresh paint throughout, updated kitchen and baths, and a functional layout full of charm and natural light. Enjoy a spacious backyard designed for entertaining with plenty of room to relax, host gatherings, or enjoy summer nights. Complete with a detached garage and convenient location near shopping, dining, and major freeways, this home is ready for its next owner to enjoy.
-
2026-05-17historical Active Under Contract 542-char remark
Show marketing remark (542 chars)
* * All Offers Due By 3PM Saturday May 16th * * Move right into this beautifully updated 3-bedroom, 2 full bath Colonial in the heart of Mount Clemens! Featuring fresh paint throughout, updated kitchen and baths, and a functional layout full of charm and natural light. Enjoy a spacious backyard designed for entertaining with plenty of room to relax, host gatherings, or enjoy summer nights. Complete with a detached garage and convenient location near shopping, dining, and major freeways, this home is ready for its next owner to enjoy.
-
2026-05-14$179,900 Active 542-char remark
Show marketing remark (542 chars)
* * All Offers Due By 3PM Saturday May 16th * * Move right into this beautifully updated 3-bedroom, 2 full bath Colonial in the heart of Mount Clemens! Featuring fresh paint throughout, updated kitchen and baths, and a functional layout full of charm and natural light. Enjoy a spacious backyard designed for entertaining with plenty of room to relax, host gatherings, or enjoy summer nights. Complete with a detached garage and convenient location near shopping, dining, and major freeways, this home is ready for its next owner to enjoy.
-
2026-05-12historical $179,900 542-char remark
Show marketing remark (542 chars)
* * All Offers Due By 3PM Saturday May 16th * * Move right into this beautifully updated 3-bedroom, 2 full bath Colonial in the heart of Mount Clemens! Featuring fresh paint throughout, updated kitchen and baths, and a functional layout full of charm and natural light. Enjoy a spacious backyard designed for entertaining with plenty of room to relax, host gatherings, or enjoy summer nights. Complete with a detached garage and convenient location near shopping, dining, and major freeways, this home is ready for its next owner to enjoy.
-
2008-05-02soldstatus $40,000
Show marketing remark (190 chars)
Nice area of Mt. Clemens! Buyer to pre-qul w/ countrywide, buyer or agent responsible for inspec. Turn-on. LB to hold $1,000 dep. Buyer agent to verify all info. Buyer agent to verify taxes.
-
2008-05-02soldstatus $40,000
Show marketing remark (190 chars)
Nice area of Mt. Clemens! Buyer to pre-qul w/ countrywide, buyer or agent responsible for inspec. Turn-on. LB to hold $1,000 dep. Buyer agent to verify all info. Buyer agent to verify taxes.
-
2008-03-07historical
Show marketing remark (190 chars)
Nice area of Mt. Clemens! Buyer to pre-qul w/ countrywide, buyer or agent responsible for inspec. Turn-on. LB to hold $1,000 dep. Buyer agent to verify all info. Buyer agent to verify taxes.
-
2007-12-11$39,900
Show marketing remark (190 chars)
Nice area of Mt. Clemens! Buyer to pre-qul w/ countrywide, buyer or agent responsible for inspec. Turn-on. LB to hold $1,000 dep. Buyer agent to verify all info. Buyer agent to verify taxes.
-
2007-12-11$39,900
Show marketing remark (190 chars)
Nice area of Mt. Clemens! Buyer to pre-qul w/ countrywide, buyer or agent responsible for inspec. Turn-on. LB to hold $1,000 dep. Buyer agent to verify all info. Buyer agent to verify taxes.
-
2007-10-29historical
-
2007-10-29historical
-
2007-04-29$79,999
-
2007-04-29$79,999
-
2007-01-09historical
-
2006-09-19$99,700
-
2006-09-19historical
-
2006-06-01$103,900
-
2005-02-03soldstatus $795
-
2004-12-17historical
-
2004-10-29$795
ⓘ Source: listings_history table (triggers on properties + properties_extension) + one-shot
backfill from property_details.listing_events for pre-trigger history.
Tax reassessment forecast MI · Partial reset (capped growth)
- Current annual tax
- $2,740 · $228/mo
- Projected year-2 tax
- $2,755 · $230/mo
- Expected delta
- +$15/yr (+$1/mo · 0.5%)
ⓘ Screening estimate from a state-policy table — verify with the county assessor before closing.
Climate risk First Street
- Flood 1/10 Low FEMA zone X (unshaded) · 0% chance over 30 yrs
- Wildfire 1/10 Low
- Heat 3/10 Moderate 7 d/yr ≥96°F today · 15 d/yr by 30 yrs out
- Wind 1/10 Low
- Air quality 4/10 Moderate 4 unhealthy d/yr today · 6 by 30 yrs out
Nearby sold comps map
Loading sold comps map…
Walkable amenities ~0.75 mi
Loading nearby amenities…
Taxation est. · year 1
- Rental income
- $18,140
- − Mortgage interest
- −$10,077
- − Property taxes
- −$2,740
- − Insurance
- −$900
- − Repairs & maintenance
- −$1,451
- − Management
- −$1,451
- − Depreciation
- −$5,233
- Taxable loss
- −$3,713
- Est. tax savings @ 24.0%
- +$891
- After-tax cash flow
- $261/yr
For passive investors: Depreciation is non-cash, so a rental often shows a tax loss while cash-flowing — sheltering income. Rental losses are passive: they offset passive income freely, and up to $25,000/yr can offset ordinary (W-2) income if you actively participate and your MAGI is under $100k (phasing out to $0 by $150k); unused losses carry forward. On sale, claimed depreciation is recaptured at up to 25%, and gains may owe capital-gains tax (a 1031 exchange can defer both). Figures are a year-1 estimate at your 24.0% rate — not tax advice; consult a CPA.
Schools (NCES district)
- District
- Mount Clemens Community School District
- NCES district ID
- 2624690
- Math proficiency
- 4% ▼ -9.00%
- Reading proficiency
- 11% ▼ -7.00%
- Median HH income
- $36,632
- Composite
- 6.25/100
- National rank
- #10005
- State rank
- #532 of 540 in MI
Livability — Mount Clemens
- Score
- 77/100
- State rank
- #120
- US rank
- #2918
Category grades
Schools grade is shown separately in the Schools card above.
Census & demographics
- Census place
- Mount Clemens, MI
- County
- Macomb County · 638,552 people
- City population
- 15,429
- Metro
- Detroit-Warren-Dearborn, MI
- Population (ZIP)
- 15,429
- Household income
- $52,161
- Rent vs Own
- Severe rent burden
- 610.0
Population outlook (Macomb County) Hauer SSP2
- Today (2025)
- 925,296 people
- By 2030
- 948,226 · +2.5%
- By 2040
- 983,961 · +6.3%
- By 2050
- 1,010,200 · +9.2%
- By 2075
- 1,076,222 · +16.3%
- By 2100
- 1,077,065 · +16.4%
Race, ethnicity, and origin ACS 2023
- Neighborhood character
- Majority White (65%)
- Race & ethnicity
- White 65% Black 22% Two or more races 10% Hispanic / Latino 4%
- Common ancestry
- Romanian 10% Lithuanian 4% Slovak 2%
- Foreign-born
- 2% · Canada
- Languages at home
- 96% English-only · Spanish 2% Russian/Polish/Slavic 1%
Political lean MEDSL · Macomb
- 2024 margin
- R (+13.7) · D 42.2% · R 55.9% · Other 1.9%
- 2008→2024 swing
- -22.3pp toward R · 2008: 8.6pp · 2024: -13.7pp
- All cycles
- 2024: R+13.7 2020: R+8.1 2016: R+11.6 2012: D+4.0 2008: D+8.6
Not yet ingested
- Civics
- —
Market trends
- HPI YoY
- ▼ -194.74%
- Current HPI
- 260.7139
- Rent YoY
- ▲ 10.82%
- Metro
- Detroit-Warren-Dearborn, MI
- State GDP YoY
- ▲ 1.37%
- F500 in state
- 28
Industry mix (Fortune 500 HQ in MI)
| Industry | F500 HQs | Revenue |
|---|---|---|
| Automotive Parts | 3 | $48B |
|
||
| Automotive | 2 | $372B |
|
||
| Chemicals | 1 | $45B |
|
||
| Automotive Retail | 1 | $29B |
|
||
| Healthcare / Medical Devices | 1 | $23B |
|
||
| Automotive Technology | 1 | $20B |
|
||
Price history
+73.1% since first listed23 events — show timeline
- 2026-05-24 Pending — MiRealSource-MiMLS
- 2026-05-24 Pending — REALCOMP
- 2026-05-17 Contingent — MiRealSource-MiMLS
- 2026-05-17 Contingent — REALCOMP
- 2026-05-14 Listed $179,900 MiRealSource-MiMLS
- 2026-05-14 Listed $179,900 REALCOMP
- 2026-05-12 Coming Soon $179,900 MiRealSource-MiMLS
- 2008-05-02 Sold (MLS) $40,000 REALCOMP
- 2008-05-02 Sold (MLS) $40,000 MiRealSource-MiMLS
- 2008-03-07 Listing Removed — MiRealSource-MiMLS
- 2007-12-11 Listed $39,900 REALCOMP
- 2007-12-11 Listed $39,900 MiRealSource-MiMLS
- 2007-10-29 Listing Removed — MiRealSource-MiMLS
- 2007-10-29 Listing Removed — REALCOMP
- 2007-04-29 Listed $79,999 MiRealSource-MiMLS
- 2007-04-29 Listed $79,999 REALCOMP
- 2007-01-09 Listing Removed — MiRealSource-MiMLS
- 2006-09-19 Listing Removed — MiRealSource-MiMLS
- 2006-09-19 Listed $99,700 MiRealSource-MiMLS
- 2006-06-01 Listed $103,900 MiRealSource-MiMLS
- 2005-02-03 Sold (MLS) $795 MiRealSource-MiMLS
- 2004-12-17 Listing Removed — MiRealSource-MiMLS
- 2004-10-29 Listed $795 MiRealSource-MiMLS
Property tax history
+6.3%/yrLatest (2025): $2,740 · +30.8% YoY. Source: county tax records.
Cash-flow waterfall
monthlySold comps — $/sqft
last 12 mo · ≤1 miLoading sold comps…