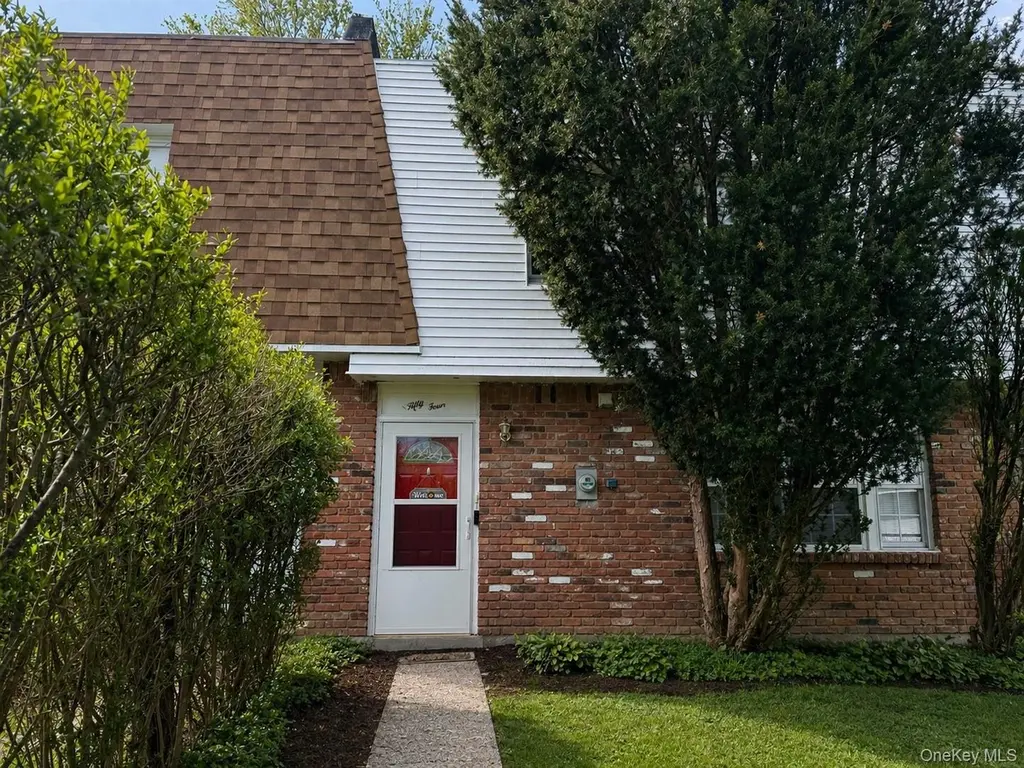
54 Whitman Ct · Scotchtown, NY
Flood risk 1/10 · Minimal
- FEMA flood zone
- X (unshaded)
- Chance of flooding over 30 yrs
- 0.0%
- Est. flood insurance / yr
- $507 – $1,088
Fire risk 3/10 · Minor
- Est. fire insurance / yr
- $691 – $1,283
Heat risk 4/10 · Minor
- Hot days now (above 100°F)
- 7 days/yr
- Hot days in 30 yrs
- 15 days/yr
Wind risk 4/10 · Minor
- Chance of severe wind over 30 yrs
- 10.0%
Air-quality risk 2/10 · Minimal
- Unhealthy air days now
- 1 days/yr
- Unhealthy air days in 30 yrs
- 2 days/yr
Risk factors via First Street. Map © Google.
Why this score? — see what drove the D+ grade
The composite is a weighted blend of 9 inputs, each scored 0–100. Each bar is that input's sub-score; the figure is the points it added to the 100-point composite (weight × sub-score).
- ARV discount +15.0/15.0
- Cash flow +13.5/30.0
- DSCR +4.1/10.0
- 1% rule +3.8/10.0
- Schools +3.8/10.0
- Livability +3.4/5.0
- Rent growth +3.3/5.0
- Condition / age +2.5/5.0
- Appreciation +0.0/10.0
$299,999
🖨 Deal sheet 📄 Offer letter ✓ Due diligence
Listing remarks
Welcome home—a move-in ready 3-bedroom, 1.5-bath townhouse located in a quiet cul-de-sac within the Pine Bush School District. With NO HOA fees, this is an incredible opportunity for buyers seeking low-maintenance living without the added monthly costs. This well-maintained home offers a functional and inviting layout, perfect for everyday living and entertaining. The kitchen and dining area flow seamlessly, making it easy to host or enjoy quiet nights at home, while the living space provides a comfortable setting for relaxing. Upstairs, you’ll find three generously sized bedrooms with ample natural light and a full bathroom, while the additional half bath one the first floor ad
Key facts
- 3,150 sq ft lot
- Built 1974
- Listed 10 days
Property features AI
Exterior
- Parking: Driveway (no carport)
- Utilities: Electricity connected (Orange & Rockland); Natural gas connected; Public water; Public sewer; Public trash collection
- Home design: Townhouse; Single-family residence; Living area recorded from public records
- Construction: Frame construction
- Exterior features: Frame construction; Not waterfront
Interior
- Kitchen: Dishwasher; Microwave; Oven; Refrigerator
- Bedrooms: 9 total rooms (bedroom count not explicitly listed)
- Bathrooms: 1 full bathroom; 1 half bathroom
- Heating & cooling: Baseboard heating; Other heating; No central cooling
- Interior features: Entrance foyer; His and hers closets; Storage; Walk-through kitchen; Walk-in closet(s)
- Laundry & utility: Washer/dryer hookup
Neighborhood map
What this means for you Summary
Snapshot
- This is a 3-bed/1.5-bath townhouse listed at $300k.
Deal economics
- At list price, monthly cash flow is $9 ($110/yr) — positive.
- The deal already cash-flows at list — no discount required.
- To meet the 1% rule (rent ≥ 1% of price), the offer needs to be $264k (12.1% below list).
- Recommended offer: $264k (12.1% below list) — sets the bar for 1% rule.
- Cap rate 6.3% vs local median 3.7% in Scotchtown — top-decile yield for the area; either an underpriced asset or a hidden risk that comps aren't pricing in. Stress-test before assuming the spread holds.
Location & tenants
- Location reads 68/100 on livability (#515 in NY) — a middle-class / working-renter tenant base. Strengths: employment A+, housing A+, health & safety A+; Watch: crime C-, cost of living D, amenities F.
- Pine Bush Central School District (rural): math 38% / reading 45% proficiency, ranked #468 of 590 in NY (top 79%) — families likely to look elsewhere, expect single-tenant / working-renter base with shorter leases.
- Zoned schools: Circleville Elementary School (math 17% / reading 42%, grade F, #1,729 of 2,108 statewide, top 84%, 477 students, 54% FRL); Circleville Middle School (math 12% / reading 42%, grade F, #587 of 729 statewide, top 81%, 450 students, 63% FRL); Pine Bush Senior High School (math 92% / reading 67%, grade A-, #518 of 1,100 statewide, top 51%, 1,615 students, 56% FRL) — zoned schools average 58% FRL vs 29% district-wide (29 pts higher); higher-poverty schools than district average — tighter screening recommended.
- Market conditions: Rents rising (+3.1%/yr); 57 active listings in the ZIP; 9 comparable units currently listed for rent nearby; rentals lingering (median 44d on market — plan ~5-8 weeks vacancy on turnover, expect pricing pressure); 56% of comp listings sitting > 30 days — soft ceiling on asking rent; solid renter incomes; 1,746 units permitted in Orange County in 2024 (1,265 in 5+ unit buildings).
- This rent runs 32% of the median local income ($99k/yr) — at the standard rent-burdened threshold; future hikes will face affordability resistance.
Forward outlook
- Local home prices are declining (-3.0%/yr); year-one equity from $2k of loan paydown is wiped out by about $9k of value loss. Plan a longer hold.
Negotiation context
- Only 10 days on market — expect competitive offers; lowballing is unlikely to land.
- Current owner paid $84k; list at $300k implies a 257% gain — meaningful room to come down on a strong offer.
Questions for the listing agent
- Built in 1974 — when were the roof, HVAC, electrical panel, plumbing, and water heater last replaced?
- Is there a deadline driving the sale (1031 exchange, divorce, estate, relocation)? That informs how much negotiation room exists.
- Schools are F-rated, which usually means shorter tenancies and higher turnover. Who's the typical renter profile here, and what's been the actual vacancy rate?
- The area grade is low — what's the realistic commute time and amenity access for the typical tenant pool here? Any planned neighborhood developments (good or bad) we should know about?
- What's the average days-on-market for RENTAL listings here right now (not sales)? A rising rental-DOM trend means longer vacancies and softer asking-rent achievability than the comps imply.
- What's the recent tenant-quality profile in this submarket — average credit score on applications, eviction rate, late-payment / NSF rate, and stable-employment percentage? A property-management company in the area should have these aggregated.
- How much new for-sale + rental construction is in the pipeline within 1–3 miles? Heavy new supply typically softens prices + rents 12–24 months out; constrained supply supports both.
Investment metrics
- 1% rule
- 0.88% ✗
- Cap rate
- 6.33%
- Cash-on-cash
- 0.13%
- DSCR
- 1.01
- GRM
- 9.5
CMA / ARV
- ARV (median comp)
- $448,305
- List price
- $299,999
- Delta
- -33.08%
- Verdict
- UNDERPRICED
- Comps
- 20 within 1.0 mi
Show comp detail 11 sales within ~0.75 mi
| Address | Dist | Beds/Ba | Sqft | Sold | Price | $/sf | Match |
|---|---|---|---|---|---|---|---|
| 26 Chaucer Ct | 0.09mi | 3/1.5 | 1,428 (0%) | 14mo | $300,000 | $210 | 84 |
| 18 Shelley Ct | 0.03mi | 3/1.5 | 1,428 (0%) | 21mo | $295,000 | $207 | 81 |
| 84 Sandburg Ct | 0.20mi | 3/1.5 | 1,344 (-6%) | 11mo | $340,000 | $253 | 72 |
| 70 Sandburg Ct | 0.19mi | 3/2.5 | 1,560 (+9%) | 12mo | $322,500 | $207 | 61 |
| 36 Hampton Ct | 0.59mi | 3/1.5 | 1,508 (+6%) | 10mo | $329,900 | $219 | 55 |
| 52 Hampton Ct | 0.62mi | 3/1.5 | 1,440 (+1%) | 18mo | $279,000 | $194 | 54 |
| 4 Cindy Ln | 0.55mi | 3/1.5 | 1,440 (+1%) | 22mo | $217,500 | $151 | 54 |
| 160 Patio Rd | 0.51mi | 3/1.5 | 1,620 (+13%) | 19mo | $335,000 | $207 | 38 |
| 32 Patio Rd | 0.51mi | 4/2.0 (+1) | 1,600 (+12%) | 14mo | $300,000 | $188 | 37 |
| 38 Hampton Ct | 0.59mi | 3/1.5 | 1,280 (-10%) | 23mo | $275,000 | $215 | 36 |
| 708 Silver Lake Scotchtown Rd | 0.52mi | 4/2.0 (+1) | 1,600 (+12%) | 20mo | $330,000 | $206 | 32 |
Match score weights: distance 35% · size 25% · config 20% · recency 20%. Top-matched comps best support the ARV.
Projected returns pro-forma
-3.0% appreciation · 3.15% rent growth · sell at horizon
- IRR
- -15.9%
- Equity multiple
- 0.43×
- Total profit
- $-47,591
- Equity at exit
- $44,731
- IRR
- -7.2%
- Equity multiple
- 0.54×
- Total profit
- $-38,884
- Equity at exit
- $25,938
Cash invested: $84,000 (down + closing). Projections, not guarantees.
Landlord ↔ Tenant lean methodology
- Overall (STATE)
- 15 Strongly Tenant-Friendly
- State New York
- 15 Strongly Tenant-Friendly · D+10
- County
- — inherits STATE
- City
- — inherits STATE
ZIP-level market 10941
- Home prices YoY
- -22.2%
- Rents YoY
- 3.1%
- Active inventory
- 57
- Price-to-rent
- 9.5×
Monthly cashflow live
- Estimated rent
- $2,638 high interval (Pro) →
- Mortgage (P&I)
- −$1,573
- Tax from tax record
- −$377 /mo · $4,519/yr
- Insurance
- −$125
- HOA
- −$0
- Vacancy / Maint / Mgmt
- −$554
- Net cashflow
- $9
Break-even live
UW: 25.0% down · 7.5% · 30yr · 1.5% tax · 5.0% vac · 8.0% maint · 8.0% mgmt
Financing live
Cash to close
- Down payment
- $75,000
- Closing costs
- $9,000
- Reserves months
- —
- Total cash needed
- —
Loan-product check · same deal, 3 products live
Conventional
25% down · 7.5% · 30yr
- Down + closing
- —
- Monthly P&I
- —
- Monthly cashflow
- —
- DSCR
- —
- Eligible?
- —
Personal DTI + credit; lowest rate.
DSCR
20% down · 8.5% · 30yr
- Down + closing
- —
- Monthly P&I
- —
- Monthly cashflow
- —
- DSCR
- —
- Eligible?
- —
No personal income docs; deal must DSCR.
Hard money
10% down · 12.0% · 12mo
- Down + closing
- —
- Monthly P&I
- —
- Monthly cashflow
- —
- DSCR
- —
- Eligible?
- —
Short-term bridge; refi at stabilization.
Rent comps 9 comps
| Address | Beds | Baths | Sqft | Rent | $/sqft | DOM | Units | Dist |
|---|---|---|---|---|---|---|---|---|
| 10 Chaucer Ct Middletown, NY | 3.0 | 1.5 | 1428 | $2,400 | $1.68 | 43d | 1 | 0.07mi |
| 202 Midland Lake Rd Middletown, NY | 4.0 | 2.0 | 1776 | $2,800 | $1.58 | 23d | 1 | 0.30mi |
| 310 Tower Dr Scotchtown, NY | 2.0 | 2.0 | 1225 | $2,700 | $2.20 | 43d | 1 | 0.63mi |
| 411 Tower Ridge Cir Scotchtown, NY | 2.0 | 2.0 | 1225 | $2,700 | $2.20 | 13d | 1 | 0.66mi |
| 415 Tower Ridge Cir Scotchtown, NY | 2.0 | 2.0 | 1123 | $2,600 | $2.32 | 13d | 1 | 0.66mi |
| 114 Tower Ridge Cir Scotchtown, NY | 2.0 | 2.0 | 1225 | $2,700 | $2.20 | 43d | 1 | 0.71mi |
| 100 Tower Ridge Cir Unit 122 Middletown, NY | 2.0 | 2.0 | 1330 | $3,000 | $2.26 | 43d | 1 | 0.75mi |
| 200 Tower Dr Scotchtown, NY | 1.0–2.0 | 1.0–2.0 | 1142 | $2,900 | $2.54 | 13d | 5 | 0.75mi |
| 834 Tower Ridge Cir Middletown, NY | 2.0 | 2.0 | 1249 | $2,400 | $1.92 | 43d | 1 | 0.75mi |
Listing history 3 events
-
2026-05-09$299,999 Active
-
2026-04-25historical
-
1986-11-26soldstatus $84,000
ⓘ Source: listings_history table (triggers on properties + properties_extension) + one-shot
backfill from property_details.listing_events for pre-trigger history.
Tax reassessment forecast NY · Partial reset (capped growth)
- Current annual tax
- $4,519 · $377/mo
- Projected year-2 tax
- $4,795 · $400/mo
- Expected delta
- +$275/yr (+$23/mo · 6.1%)
ⓘ Screening estimate from a state-policy table — verify with the county assessor before closing.
Climate risk First Street
- Flood 1/10 Low FEMA zone X (unshaded) · 0% chance over 30 yrs
- Wildfire 3/10 Moderate
- Heat 4/10 Moderate 7 d/yr ≥100°F today · 15 d/yr by 30 yrs out
- Wind 4/10 Moderate 10% chance of damaging wind over 30 yrs
- Air quality 2/10 Low 1 unhealthy d/yr today · 2 by 30 yrs out
Nearby sold comps map
Loading sold comps map…
Walkable amenities ~0.75 mi
Loading nearby amenities…
Taxation est. · year 1
- Rental income
- $31,656
- − Mortgage interest
- −$16,805
- − Property taxes
- −$4,519
- − Insurance
- −$1,500
- − Repairs & maintenance
- −$2,532
- − Management
- −$2,532
- − Depreciation
- −$8,727
- Taxable loss
- −$4,961
- Est. tax savings @ 24.0%
- +$1,191
- After-tax cash flow
- $1,300/yr
For passive investors: Depreciation is non-cash, so a rental often shows a tax loss while cash-flowing — sheltering income. Rental losses are passive: they offset passive income freely, and up to $25,000/yr can offset ordinary (W-2) income if you actively participate and your MAGI is under $100k (phasing out to $0 by $150k); unused losses carry forward. On sale, claimed depreciation is recaptured at up to 25%, and gains may owe capital-gains tax (a 1031 exchange can defer both). Figures are a year-1 estimate at your 24.0% rate — not tax advice; consult a CPA.
Schools (NCES district)
- District
- Pine Bush Central School District
- NCES district ID
- 3623010
- Math proficiency
- 38% ▼ -16.00%
- Reading proficiency
- 45% ▼ -7.00%
- Median HH income
- $72,525
- Composite
- 37.87/100
- National rank
- #4324
- State rank
- #468 of 590 in NY
Livability — Scotchtown
- Score
- 68/100
- State rank
- #515
- US rank
- #9142
Category grades
Schools grade is shown separately in the Schools card above.
Census & demographics
- Census place
- Scotchtown, NY
- County
- Orange County · 267,004 people
- Metro
- Poughkeepsie-Newburgh-Middletown, NY
- Population (ZIP)
- 14,422
- Household income
- $99,238
- Rent vs Own
- Severe rent burden
- 525.0
Population outlook (Orange County) Hauer SSP2
- Today (2025)
- 379,830 people
- By 2030
- 378,955 · -0.2%
- By 2040
- 375,444 · -1.2%
- By 2050
- 369,311 · -2.8%
- By 2075
- 354,233 · -6.7%
- By 2100
- 318,150 · -16.2%
Race, ethnicity, and origin ACS 2023
- Neighborhood character
- Highly diverse neighborhood (Simpson 0.71)
- Race & ethnicity
- White 44% Hispanic / Latino 23% Black 21% Two or more races 16% Asian 4% Native American 1%
- Hispanic origin (detail)
- Mexican 3% Puerto Rican 9% Cuban 1% Dominican 3%
- Common ancestry
- Romanian 4% Hispanic 3% Italian 1%
- Foreign-born
- 16% · Canada, Jamaica, Dominican Republic
- Languages at home
- 72% English-only · Spanish 14% Other Indo-European 4% French/Haitian/Cajun 3%
Political lean MEDSL · Orange
- 2024 margin
- Lean R (+8.4) · D 45.8% · R 54.2%
- 2008→2024 swing
- -12.5pp toward R · 2008: 4.1pp · 2024: -8.4pp
- All cycles
- 2024: R+8.4 2020: R+0.2 2016: R+6.5 2012: D+5.2 2008: D+4.1
Not yet ingested
- Civics
- —
Market trends
- HPI YoY
- ▼ -93.38%
- Current HPI
- 326.3597
- Rent YoY
- ▲ 3.15%
- Metro
- Poughkeepsie-Newburgh-Middletown, NY
- State GDP YoY
- ▲ 2.60%
- F500 in state
- 92
Industry mix (Fortune 500 HQ in NY)
| Industry | F500 HQs | Revenue |
|---|---|---|
| Financial Services | 10 | $950B |
|
||
| Consumer Goods | 9 | $162B |
|
||
| Insurance | 4 | $225B |
|
||
| Telecommunications | 2 | $144B |
|
||
| Pharmaceuticals | 2 | $112B |
|
||
| Media / Entertainment | 2 | $69B |
|
||
Price history
+257.1% since first listed4 events — show timeline
- 2026-05-25 Pending — OneKey® MLS as Distributed by MLS Grid
- 2026-05-09 Listed $299,999 OneKey® MLS as Distributed by MLS Grid
- 2026-04-25 Coming Soon $299,999 OneKey® MLS as Distributed by MLS Grid
- 1986-11-26 Sold (Public Records) $84,000 Public Records
Property tax history
+2.3%/yrLatest (2025): $4,519 · +5.0% YoY. Source: county tax records.
Cash-flow waterfall
monthlySold comps — $/sqft
last 12 mo · ≤1 miLoading sold comps…