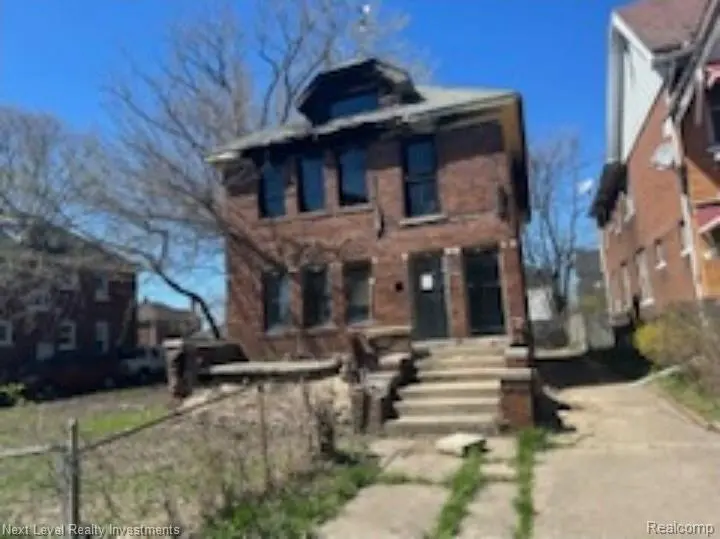
3000 Tyler St · Detroit, MI
Flood risk 1/10 · Minimal
- FEMA flood zone
- X (unshaded)
- Chance of flooding over 30 yrs
- 0.0%
- Est. flood insurance / yr
- $473 – $860
Fire risk 1/10 · Minimal
- Est. fire insurance / yr
- $784 – $1,456
Heat risk 3/10 · Minor
- Hot days now (above 97°F)
- 7 days/yr
- Hot days in 30 yrs
- 15 days/yr
Wind risk 2/10 · Minimal
- Chance of severe wind over 30 yrs
- —
Air-quality risk 4/10 · Minor
- Unhealthy air days now
- 4 days/yr
- Unhealthy air days in 30 yrs
- 6 days/yr
Risk factors via First Street. Map © Google.
Why this score? — see what drove the D grade
The composite is a weighted blend of 9 inputs, each scored 0–100. Each bar is that input's sub-score; the figure is the points it added to the 100-point composite (weight × sub-score).
- Cash flow +15.0/30.0
- ARV discount +7.5/15.0
- 1% rule +5.0/10.0
- DSCR +5.0/10.0
- Rent growth +4.0/5.0
- Livability +3.7/5.0
- Condition / age +2.5/5.0
- Schools +1.3/10.0
- Appreciation +0.0/10.0
$25,000
🖨 Deal sheet (PDF) 📄 Offer letter ✓ Due diligence
Listing remarks MLS
Development opportunity in up and coming area with lots of revitalization happening. Interested buyers must submit a complete proposal package for DLBA approval, including a project proposal, proof of funds, site plan or concept drawing, and proof of previous development experience. Sale is contingent upon execution of a DLBA Development Agreement. The Detroit Land Bank Authority is entitled to a tax recapture for the five (5) tax years following transfer of ownership. This provision may be incompatible with certain tax abatements, lot combinations, or assemblages. Waiver requests may be considered on a case-by-case basis and may require a payment in lieu of taxes, determined after DLBA review of the development pro forma and financing
Key facts
- 3,920 sq ft lot
- Built 1926
- Listed 54 days
Property features AI
Finance
- Other: Above-grade finished area: 2,112 total square feet; Lot dimensions approximately 35 x 110 (0.09 acres); Zoned for multi-family/residential; Property offered by investor-oriented residential income/multi-family type
Exterior
- Utilities: Public water; Public sewer
- Home design: Multi-family residential; Two-story building; Brick construction
- Construction: Brick construction
- Exterior features: Paved road access; Pets allowed
Interior
- Bedrooms: Two 3-bedroom units
- Bathrooms: Two full bathrooms (one per unit)
- Heating & cooling: Forced air heating (natural gas); No central cooling
- Interior features: Unfinished basement
Neighborhood map
What this means for you Summary
Snapshot
- This is a 6-bed/2.0-bath townhouse listed at $25k.
Deal economics
- At list price, monthly cash flow is $1k ($17k/yr) — positive.
- The deal already cash-flows at list — no discount required.
- Meets the 1% rule at list price ($2k rent vs $25k).
- Recommended offer: $24k (3.0% below list) — sets the bar for market timing.
- Cap rate 72.6% vs local median 10.0% in Detroit — top-decile yield for the area; either an underpriced asset or a hidden risk that comps aren't pricing in. Stress-test before assuming the spread holds.
Location & tenants
- Location reads 73/100 on livability (#218 in MI) — a middle-class / working-renter tenant base. Strengths: amenities A+, commute A+, cost of living A+; Watch: crime F, employment F.
- Detroit Public Schools Community District (urban): math 10% / reading 24% proficiency, ranked #499 of 540 in MI (top 92%) — low school quality limits family demand, transient renter base, plan for 1-2y turnover; 90% free/reduced lunch — lower-income household profile, screen leases tightly.
- Zoned schools: Durfee Elementarymiddle School (593 students, 91% FRL); Central High School (math 24% / reading 24%, grade F, #481 of 713 statewide, top 81%, 353 students, 89% FRL) — zoned schools at 90% FRL track the district average.
- Market conditions: Rents rising fast (+6.1%/yr); 350 active listings in the ZIP; 2 comparable units currently listed for rent nearby; lower-income renter base — watch delinquency; 2,639 units permitted in Wayne County in 2024 (1,216 in 5+ unit buildings).
- At $1,967/mo this rent would consume 71% of the median local household income ($33k/yr) (locally 2172% of renters already pay >50% of income on rent) — very limited rent-growth headroom before tenants either downsize or default.
Forward outlook
- Local home prices are declining (-3.0%/yr); year-one equity from $173 of loan paydown is wiped out by about $750 of value loss. Plan a longer hold.
- Wayne County population projected at -17% by 2050 — secular population decline; favor cash flow + early exit over multi-decade hold.
- At projected returns (-3.0% appreciation + 6.1% rent growth), your $7k cash investment doubles in ~1 year — after that, you're playing with house money.
Negotiation context
- It's been on market 55 days — a 3% lower offer ($24k) is reasonable based on typical stale-listing flexibility.
- 4 sale attempts since 10y ago with the ask held roughly flat each time — persistent listings suggest the price (not the market) is what's stuck; bring a comps-based counter.
- Current owner paid $500; list at $25k implies a 4900% gain — meaningful room to come down on a strong offer.
Risks & watch-outs
- Watch-outs: built in 1926 — expect roof / HVAC / electrical / plumbing capex.
Questions for the listing agent
- It's been on market 55 days. Have you received any prior offers? Is the seller open to a 3% concession, seller financing, or rate buy-down credit?
- Built in 1926 — when were the roof, HVAC, electrical panel, plumbing, and water heater last replaced?
- Is there a deadline driving the sale (1031 exchange, divorce, estate, relocation)? That informs how much negotiation room exists.
- Schools are F-rated, which usually means shorter tenancies and higher turnover. Who's the typical renter profile here, and what's been the actual vacancy rate?
- Crime grade is F in this area — have there been break-ins, vandalism, or insurance claims at this property in the last 3 years? What carrier currently insures it and at what premium?
- The area grade is low — what's the realistic commute time and amenity access for the typical tenant pool here? Any planned neighborhood developments (good or bad) we should know about?
- What's the average days-on-market for RENTAL listings here right now (not sales)? A rising rental-DOM trend means longer vacancies and softer asking-rent achievability than the comps imply.
- What's the recent tenant-quality profile in this submarket — average credit score on applications, eviction rate, late-payment / NSF rate, and stable-employment percentage? A property-management company in the area should have these aggregated.
- How much new for-sale + rental construction is in the pipeline within 1–3 miles? Heavy new supply typically softens prices + rents 12–24 months out; constrained supply supports both.
Investment metrics
- 1% rule
- 7.87% ✓
- Cap rate
- 72.58%
- Cash-on-cash
- 236.73%
- DSCR
- 11.53
- GRM
- 1.1
CMA / ARV
- ARV (median comp)
- $88,099
- List price
- $25,000
- Delta
- -71.62%
- Verdict
- UNDERPRICED
- Comps
- 20 within 1.0 mi
Projected returns pro-forma
-3.0% appreciation · 6.14% rent growth · sell at horizon
- IRR
- —
- Equity multiple
- 13.91×
- Total profit
- $90,341
- Equity at exit
- $3,728
- IRR
- —
- Equity multiple
- 32.44×
- Total profit
- $220,094
- Equity at exit
- $2,162
Cash invested: $7,000 (down + closing). Projections, not guarantees.
Landlord ↔ Tenant lean methodology
- Overall (STATE)
- 62 Landlord-Friendly
- State Michigan
- 62 Landlord-Friendly · EVEN
- County
- — inherits STATE
- City
- — inherits STATE
ZIP-level market 48238
- Home prices YoY
- -14.4%
- Rents YoY
- 6.1%
- Active inventory
- 350
- Price-to-rent
- 1.1×
Monthly cashflow live
- Estimated rent
- $1,967 medium interval (Pro) →
- Mortgage (P&I)
- −$131
- Tax est. 1.5%
- −$31 /mo · $375/yr
- Insurance
- −$10
- HOA
- −$0
- Vacancy / Maint / Mgmt
- −$413
- Net cashflow
- $1,381
Break-even live
Sensitivity live
| Price | -10% $1,398 | -5% $1,390 | +0% $1,381 | +5% $1,372 | +10% $1,364 |
|---|---|---|---|---|---|
| Rent | -10% $1,226 | -5% $1,303 | +0% $1,381 | +5% $1,459 | +10% $1,536 |
| Rate | -1.0pp $1,394 | -0.5pp $1,387 | base $1,381 | +0.5pp $1,374 | +1.0pp $1,368 |
UW: 25.0% down · 7.5% · 30yr · 1.5% tax · 5.0% vac · 8.0% maint · 8.0% mgmt
Financing live
Cash to close
- Down payment
- $6,250
- Closing costs
- $750
- Reserves months
- —
- Total cash needed
- —
Loan-product check · same deal, 3 products live
Conventional
25% down · 7.5% · 30yr
- Down + closing
- —
- Monthly P&I
- —
- Monthly cashflow
- —
- DSCR
- —
- Eligible?
- —
Personal DTI + credit; lowest rate.
DSCR
20% down · 8.5% · 30yr
- Down + closing
- —
- Monthly P&I
- —
- Monthly cashflow
- —
- DSCR
- —
- Eligible?
- —
No personal income docs; deal must DSCR.
Hard money
10% down · 12.0% · 12mo
- Down + closing
- —
- Monthly P&I
- —
- Monthly cashflow
- —
- DSCR
- —
- Eligible?
- —
Short-term bridge; refi at stabilization.
Rent comps 2 comps
| Address | Beds | Baths | Sqft | Rent | $/sqft | DOM | Units | Dist |
|---|---|---|---|---|---|---|---|---|
| 13225 Santa Rosa Dr Detroit, MI | 5.0 | 2.0 | 2100 | $1,700 | $0.81 | 6d | 1 | 0.86mi |
| 1699 Glynn Ct Detroit, MI | 5.0 | 3.5 | 2542 | $2,500 | $0.98 | 23d | 1 | 1.34mi |
Listing history 24 events
-
2026-06-21days on market $25,000 Active 55 DOM
-
2026-06-18days on market $25,000 Active 52 DOM
-
2026-06-17days on market $25,000 Active 51 DOM
-
2026-06-15days on market $25,000 Active 49 DOM
-
2026-06-13days on market $25,000 Active 47 DOM
-
2026-06-13days on market $25,000 Active 46 DOM
-
2026-06-09days on market $25,000 Active 43 DOM
-
2026-06-08days on market $25,000 Active 42 DOM
-
2026-06-07days on market $25,000 Active 41 DOM
-
2026-06-04days on market $25,000 Active 38 DOM
-
2026-06-03days on market $25,000 Active 37 DOM
-
2026-06-02days on market $25,000 Active 36 DOM
-
2026-06-01days on market $25,000 Active 35 DOM
-
2026-05-31days on market $25,000 Active 34 DOM
-
2026-04-27$25,000 Active 745-char remark
Show marketing remark (745 chars)
Development opportunity in up and coming area with lots of revitalization happening. Interested buyers must submit a complete proposal package for DLBA approval, including a project proposal, proof of funds, site plan or concept drawing, and proof of previous development experience. Sale is contingent upon execution of a DLBA Development Agreement. The Detroit Land Bank Authority is entitled to a tax recapture for the five (5) tax years following transfer of ownership. This provision may be incompatible with certain tax abatements, lot combinations, or assemblages. Waiver requests may be considered on a case-by-case basis and may require a payment in lieu of taxes, determined after DLBA review of the development pro forma and financing
-
2016-10-14soldstatus $500
-
2016-10-12soldstatus $500 Sold
Show marketing remark (164 chars)
BRICK MULTI FAMILY. Property close to major freeways and shopping. The Seller must comply with HUD Guidelines 24 CRF 206.125 and property is sold "as is".
-
2016-10-12soldstatus $500 Closed
Show marketing remark (164 chars)
BRICK MULTI FAMILY. Property close to major freeways and shopping. The Seller must comply with HUD Guidelines 24 CRF 206.125 and property is sold "as is".
-
2016-09-27status Pending
Show marketing remark (164 chars)
BRICK MULTI FAMILY. Property close to major freeways and shopping. The Seller must comply with HUD Guidelines 24 CRF 206.125 and property is sold "as is".
-
2016-09-27status Pending
Show marketing remark (164 chars)
BRICK MULTI FAMILY. Property close to major freeways and shopping. The Seller must comply with HUD Guidelines 24 CRF 206.125 and property is sold "as is".
-
2016-08-02$500 Active
-
2016-08-01$500 Active
Show marketing remark (164 chars)
BRICK MULTI FAMILY. Property close to major freeways and shopping. The Seller must comply with HUD Guidelines 24 CRF 206.125 and property is sold "as is".
-
2015-12-21soldstatus $23,500
ⓘ Source: listings_history table (triggers on properties + properties_extension) + one-shot
backfill from property_details.listing_events for pre-trigger history.
Climate risk First Street
- Flood 1/10 Low FEMA zone X (unshaded) · 0% chance over 30 yrs
- Wildfire 1/10 Low
- Heat 3/10 Moderate 7 d/yr ≥97°F today · 15 d/yr by 30 yrs out
- Wind 2/10 Low
- Air quality 4/10 Moderate 4 unhealthy d/yr today · 6 by 30 yrs out
Nearby sold comps map
Loading sold comps map…
Walkable amenities ~0.75 mi
Loading nearby amenities…
Taxation est. · year 1
- Rental income
- $23,601
- − Mortgage interest
- −$1,400
- − Property taxes
- −$375
- − Insurance
- −$125
- − Repairs & maintenance
- −$1,888
- − Management
- −$1,888
- − Depreciation
- −$727
- Taxable income
- $17,197
- Est. tax owed @ 24.0%
- −$4,127
- After-tax cash flow
- $12,444/yr
For passive investors: Depreciation is non-cash, so a rental often shows a tax loss while cash-flowing — sheltering income. Rental losses are passive: they offset passive income freely, and up to $25,000/yr can offset ordinary (W-2) income if you actively participate and your MAGI is under $100k (phasing out to $0 by $150k); unused losses carry forward. On sale, claimed depreciation is recaptured at up to 25%, and gains may owe capital-gains tax (a 1031 exchange can defer both). Figures are a year-1 estimate at your 24.0% rate — not tax advice; consult a CPA.
Schools (NCES district)
- District
- Detroit Public Schools Community District
- NCES district ID
- 2601103
- Math proficiency
- 10% ▼ -2.00%
- Reading proficiency
- 24% ▲ 6.00%
- Median HH income
- $25,815
- Composite
- 13.06/100
- National rank
- #9564
- State rank
- #499 of 540 in MI
Livability — Detroit
- Score
- 73/100
- State rank
- #218
- US rank
- #5427
Category grades
Schools grade is shown separately in the Schools card above.
Census & demographics
- Census place
- Detroit, MI
- County
- Wayne County · 1,562,939 people
- City population
- 572,865
- Metro
- Detroit-Warren-Dearborn, MI
- Population (ZIP)
- 24,731
- Household income
- $33,315
- Rent vs Own
- Severe rent burden
- 2172.0
Population outlook (Wayne County) Hauer SSP2
- Today (2025)
- 1,675,273 people
- By 2030
- 1,620,300 · -3.3%
- By 2040
- 1,502,341 · -10.3%
- By 2050
- 1,384,039 · -17.4%
- By 2075
- 1,124,592 · -32.9%
- By 2100
- 881,193 · -47.4%
Race, ethnicity, and origin ACS 2023
- Neighborhood character
- Predominantly Black (94%)
- Race & ethnicity
- Black 94% Two or more races 3% White 1%
- Foreign-born
- 1%
Political lean MEDSL · Wayne
- 2024 margin
- Strong D (+29.0) · D 62.7% · R 33.7% · Other 3.6%
- 2008→2024 swing
- -20.5pp toward R · 2008: 49.5pp · 2024: 29.0pp
- All cycles
- 2024: D+29.0 2020: D+38.1 2016: D+37.3 2012: D+46.9 2008: D+49.5
Not yet ingested
- Civics
- —
Market trends
- HPI YoY
- ▼ -31.96%
- Current HPI
- 189.6227
- Rent YoY
- ▲ 6.14%
- Metro
- Detroit-Warren-Dearborn, MI
- State GDP YoY
- ▲ 1.37%
- F500 in state
- 28
Industry mix (Fortune 500 HQ in MI)
| Industry | F500 HQs | Revenue |
|---|---|---|
| Automotive Parts | 3 | $48B |
|
||
| Automotive | 2 | $372B |
|
||
| Chemicals | 1 | $45B |
|
||
| Automotive Retail | 1 | $29B |
|
||
| Healthcare / Medical Devices | 1 | $23B |
|
||
| Automotive Technology | 1 | $20B |
|
||
Price history
+6.4% since first listed10 events — show timeline
- 2026-04-27 Listed $25,000 REALCOMP
- 2026-04-27 Listed $25,000 MiRealSource-MiMLS
- 2016-10-14 Sold (Public Records) $500 Public Records
- 2016-10-12 Sold (MLS) $500 MiRealSource-MiMLS
- 2016-10-12 Sold (MLS) $500 REALCOMP
- 2016-09-27 Pending — MiRealSource-MiMLS
- 2016-09-27 Pending — REALCOMP
- 2016-08-02 Listed $500 MiRealSource-MiMLS
- 2016-08-01 Listed $500 REALCOMP
- 2015-12-21 Sold (Public Records) $23,500 Public Records
Property tax history
-1.0%/yrLatest (2025): $1,988 · +0.0% YoY. Source: county tax records.
Cash-flow waterfall
monthlySold comps — $/sqft
last 12 mo · ≤1 miLoading sold comps…