1443 Truman Dr · Bradley, IL
Flood risk 1/10 · Minimal
- FEMA flood zone
- X (unshaded)
- Chance of flooding over 30 yrs
- 0.0%
- Est. flood insurance / yr
- $473 – $860
Fire risk 1/10 · Minimal
- Est. fire insurance / yr
- $804 – $1,492
Heat risk 3/10 · Minor
- Hot days now (above 104°F)
- 7 days/yr
- Hot days in 30 yrs
- 16 days/yr
Wind risk 2/10 · Minimal
- Chance of severe wind over 30 yrs
- 1.0%
Air-quality risk 2/10 · Minimal
- Unhealthy air days now
- 1 days/yr
- Unhealthy air days in 30 yrs
- 2 days/yr
Risk factors via First Street. Map © Google.
Why this score? — see what drove the B- grade
The composite is a weighted blend of 9 inputs, each scored 0–100. Each bar is that input's sub-score; the figure is the points it added to the 100-point composite (weight × sub-score).
- Cash flow +30.0/30.0
- 1% rule +10.0/10.0
- DSCR +10.0/10.0
- ARV discount +7.5/15.0
- Livability +3.3/5.0
- Rent growth +2.5/5.0
- Condition / age +2.5/5.0
- Schools +1.8/10.0
- Appreciation +0.0/10.0
$109,000
🖨 Deal sheet 📄 Offer letter ✓ Due diligence
Listing remarks MLS
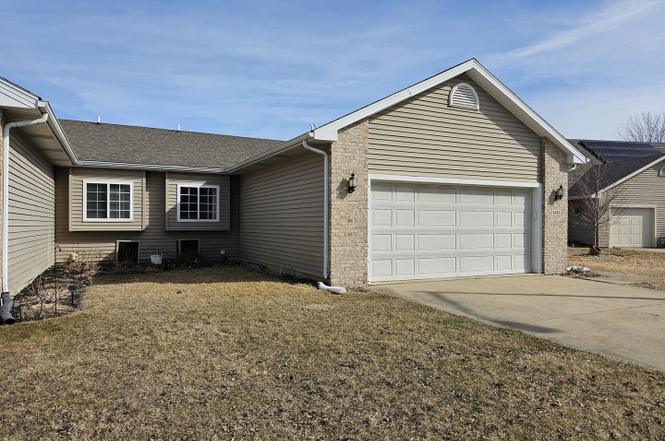
Cute Cute Cute!! Great open floor plan with cathedral ceiling, gas log fireplace & cozy sun room! All appliances plus 1 year home warranty included. Hot water heater '08, shed, crown molding in kitchen & great room. 2.5 car attached garage. Large kitchen with plenty of cabinet & counterspace. Low maintainance - Easy Living. Call for appointment today!!
Key facts
- Close to schools
- Large kitchen
- Spacious garage
Tags
Neighborhood map
What this means for you Summary
Snapshot
- This is a 2-bed/2.0-bath single-family listed at $109k.
Deal economics
- At list price, monthly cash flow is $407 ($5k/yr) — positive.
- The deal already cash-flows at list — no discount required.
- Meets the 1% rule at list price ($2k rent vs $109k).
- Recommended offer: $107k (1.5% below list) — sets the bar for market timing.
- Cap rate 10.8% vs local median 4.5% in Bradley — top-decile yield for the area; either an underpriced asset or a hidden risk that comps aren't pricing in. Stress-test before assuming the spread holds.
Location & tenants
- Location reads 66/100 on livability (#569 in IL) — a middle-class / working-renter tenant base. Strengths: cost of living A+, housing A+; Watch: employment D+, amenities D, schools F.
- Bradley Bourbonnais Chsd 307 (suburban): math 15% / reading 24% proficiency, ranked #413 of 620 in IL (top 67%) — low school quality limits family demand, transient renter base, plan for 1-2y turnover.
- Market conditions: 21 active listings in the ZIP; 1 comparable units currently listed for rent nearby; 145 units permitted in Kankakee County in 2024 (5 in 5+ unit buildings).
Forward outlook
- Local home prices are declining (-3.0%/yr); year-one equity from $754 of loan paydown is wiped out by about $3k of value loss. Plan a longer hold.
- Kankakee County population projected at -19% by 2050 — secular population decline; favor cash flow + early exit over multi-decade hold.
- At projected returns (-3.0% appreciation + 3.0% rent growth), your $31k cash investment doubles in ~8 years — after that, you're playing with house money.
Negotiation context
- It's been on market 17 days — a 2% lower offer ($107k) is reasonable based on typical stale-listing flexibility.
- 6 sale attempts since 20y ago with the ask held roughly flat each time — persistent listings suggest the price (not the market) is what's stuck; bring a comps-based counter.
Risks & watch-outs
- Watch-outs: property tax is 3.5% of price.
Questions for the listing agent
- Property tax is high relative to price — has the assessment been appealed recently, and will the sale trigger a re-assessment?
- Is there a deadline driving the sale (1031 exchange, divorce, estate, relocation)? That informs how much negotiation room exists.
- Schools are F-rated, which usually means shorter tenancies and higher turnover. Who's the typical renter profile here, and what's been the actual vacancy rate?
- What's the average days-on-market for RENTAL listings here right now (not sales)? A rising rental-DOM trend means longer vacancies and softer asking-rent achievability than the comps imply.
- What's the recent tenant-quality profile in this submarket — average credit score on applications, eviction rate, late-payment / NSF rate, and stable-employment percentage? A property-management company in the area should have these aggregated.
- How much new for-sale + rental construction is in the pipeline within 1–3 miles? Heavy new supply typically softens prices + rents 12–24 months out; constrained supply supports both.
Investment metrics
- 1% rule
- 1.56% ✓
- Cap rate
- 10.78%
- Cash-on-cash
- 16.02%
- DSCR
- 1.71
- GRM
- 5.3
CMA / ARV
- ARV (on-the-fly)
- $228,864
- Comps found
- 12
Show comp detail 12 sales within ~0.75 mi
| Address | Dist | Beds/Ba | Sqft | Sold | Price | $/sf | Match |
|---|---|---|---|---|---|---|---|
| 860 Pheasant Dr | 0.24mi | 3/2.0 (+1) | 1,235 (+4%) | 1mo | $242,200 | $196 | 77 |
| 318 N Jackson Ave | 0.41mi | 3/1.0 (+1) | 1,186 (-0%) | 1mo | $210,000 | $177 | 70 |
| 973 Cardinal Dr | 0.31mi | 3/1.5 (+1) | 1,120 (-6%) | 0mo | $215,000 | $192 | 69 |
| 1069 Flamingo Ln | 0.36mi | 3/2.0 (+1) | 1,288 (+8%) | 6mo | $235,000 | $182 | 59 |
| 166 N Randolph Ave | 0.68mi | 3/1.5 (+1) | 1,188 (-0%) | 2mo | $195,000 | $164 | 59 |
| 253 N Jackson Ave | 0.49mi | 3/2.0 (+1) | 1,146 (-4%) | 11mo | $220,000 | $192 | 56 |
| 135 S Jackson Ave | 0.71mi | 3/1.5 (+1) | 1,175 (-1%) | 2mo | $200,000 | $170 | 56 |
| 1374 Potomac Pl | 0.72mi | 3/1.5 (+1) | 1,120 (-6%) | 1mo | $260,000 | $232 | 49 |
| 252 N Lasalle | 0.74mi | 3/1.0 (+1) | 1,216 (+2%) | 6mo | $214,900 | $177 | 48 |
| 289 N Jackson Ave | 0.45mi | 3/2.0 (+1) | 1,040 (-13%) | 6mo | $209,999 | $202 | 48 |
| 1525 Merlin Rd | 0.63mi | 3/2.0 (+1) | 1,300 (+9%) | 11mo | $274,900 | $211 | 41 |
| 244 N Madison Ave | 0.53mi | 3/1.0 (+1) | 1,352 (+13%) | 11mo | $175,000 | $129 | 35 |
Match score weights: distance 35% · size 25% · config 20% · recency 20%. Top-matched comps best support the ARV.
Projected returns pro-forma
-3.0% appreciation · 3.0% rent growth · sell at horizon
- IRR
- 7.1%
- Equity multiple
- 1.28×
- Total profit
- $8,426
- Equity at exit
- $16,252
- IRR
- 16.5%
- Equity multiple
- 2.35×
- Total profit
- $41,312
- Equity at exit
- $9,424
Cash invested: $30,520 (down + closing). Projections, not guarantees.
Landlord ↔ Tenant lean methodology
- Overall (STATE)
- 43 Moderately Tenant-Leaning
- State Illinois
- 43 Moderately Tenant-Leaning · D+7
- County
- — inherits STATE
- City
- — inherits STATE
ZIP-level market 60915
- Active inventory
- 21
- Price-to-rent
- 5.3×
Monthly cashflow live
- Estimated rent
- $1,700 medium interval (Pro) →
- Mortgage (P&I)
- −$572
- Tax from tax record
- −$318 /mo · $3,819/yr
- Insurance
- −$45
- HOA
- −$0
- Vacancy / Maint / Mgmt
- −$357
- Net cashflow
- $407
Break-even live
UW: 25.0% down · 7.5% · 30yr · 1.5% tax · 5.0% vac · 8.0% maint · 8.0% mgmt
Financing live
Cash to close
- Down payment
- $27,250
- Closing costs
- $3,270
- Reserves months
- —
- Total cash needed
- —
Loan-product check · same deal, 3 products live
Conventional
25% down · 7.5% · 30yr
- Down + closing
- —
- Monthly P&I
- —
- Monthly cashflow
- —
- DSCR
- —
- Eligible?
- —
Personal DTI + credit; lowest rate.
DSCR
20% down · 8.5% · 30yr
- Down + closing
- —
- Monthly P&I
- —
- Monthly cashflow
- —
- DSCR
- —
- Eligible?
- —
No personal income docs; deal must DSCR.
Hard money
10% down · 12.0% · 12mo
- Down + closing
- —
- Monthly P&I
- —
- Monthly cashflow
- —
- DSCR
- —
- Eligible?
- —
Short-term bridge; refi at stabilization.
Rent comps 1 comps
| Address | Beds | Baths | Sqft | Rent | $/sqft | DOM | Units | Dist |
|---|---|---|---|---|---|---|---|---|
| 728 Double Jack St Bourbonnais, IL | 3.0 | 2.0 | 950 | $1,700 | $1.79 | 1d | 1 | 1.38mi |
Listing history 22 events
-
2026-06-13statusdays on market $109,000 Pending 17 DOM
-
2026-06-10days on market $109,000 Active 16 DOM
-
2026-06-09days on market $109,000 Active 15 DOM
-
2026-06-08days on market $109,000 Active 14 DOM
-
2026-06-07statusdays on market $109,000 Active 13 DOM
-
2026-03-09status Pending
-
2026-02-25$109,000 Active
-
2025-02-11status Pending
-
2025-02-11status Active
-
2025-02-07historical
-
2025-02-05historical
-
2025-02-05status Temporarily No Showings
-
2025-02-03historical
-
2025-01-12Active
-
2010-04-30soldstatus $125,000
-
2010-04-27soldstatus $124,900 Closed Sale 366-char remark
Show marketing remark (366 chars)
Cute Cute Cute!! Great open floor plan with cathedral ceiling, gas log fireplace & cozy sun room! All appliances plus 1 year home warranty included. Hot water heater '08, shed, crown molding in kitchen & great room. 2.5 car attached garage. Large kitchen with plenty of cabinet & counterspace. Low maintainance - Easy Living. Call for appointment today!!
-
2010-03-05historical Contingent 366-char remark
Show marketing remark (366 chars)
Cute Cute Cute!! Great open floor plan with cathedral ceiling, gas log fireplace & cozy sun room! All appliances plus 1 year home warranty included. Hot water heater '08, shed, crown molding in kitchen & great room. 2.5 car attached garage. Large kitchen with plenty of cabinet & counterspace. Low maintainance - Easy Living. Call for appointment today!!
-
2010-01-06price $124,900 Price Change 366-char remark
Show marketing remark (366 chars)
Cute Cute Cute!! Great open floor plan with cathedral ceiling, gas log fireplace & cozy sun room! All appliances plus 1 year home warranty included. Hot water heater '08, shed, crown molding in kitchen & great room. 2.5 car attached garage. Large kitchen with plenty of cabinet & counterspace. Low maintainance - Easy Living. Call for appointment today!!
-
2009-11-20$129,900 New 366-char remark
Show marketing remark (366 chars)
Cute Cute Cute!! Great open floor plan with cathedral ceiling, gas log fireplace & cozy sun room! All appliances plus 1 year home warranty included. Hot water heater '08, shed, crown molding in kitchen & great room. 2.5 car attached garage. Large kitchen with plenty of cabinet & counterspace. Low maintainance - Easy Living. Call for appointment today!!
-
2006-03-13soldstatus $128,000
-
2006-03-10soldstatus $128,000
-
2006-02-06$129,900
ⓘ Source: listings_history table (triggers on properties + properties_extension) + one-shot
backfill from property_details.listing_events for pre-trigger history.
Tax reassessment forecast IL · Partial reset (capped growth)
- Current annual tax
- $3,819 · $318/mo
- Projected year-2 tax
- $3,819 · $318/mo
- Expected delta
- $0/yr ($0/mo · 0.0%)
ⓘ Screening estimate from a state-policy table — verify with the county assessor before closing.
Climate risk First Street
- Flood 1/10 Low FEMA zone X (unshaded) · 0% chance over 30 yrs
- Wildfire 1/10 Low
- Heat 3/10 Moderate 7 d/yr ≥104°F today · 16 d/yr by 30 yrs out
- Wind 2/10 Low 100% chance of damaging wind over 30 yrs
- Air quality 2/10 Low 1 unhealthy d/yr today · 2 by 30 yrs out
Nearby sold comps map
Loading sold comps map…
Walkable amenities ~0.75 mi
Loading nearby amenities…
Taxation est. · year 1
- Rental income
- $20,396
- − Mortgage interest
- −$6,106
- − Property taxes
- −$3,819
- − Insurance
- −$545
- − Repairs & maintenance
- −$1,632
- − Management
- −$1,632
- − Depreciation
- −$3,171
- Taxable income
- $3,492
- Est. tax owed @ 24.0%
- −$838
- After-tax cash flow
- $4,051/yr
For passive investors: Depreciation is non-cash, so a rental often shows a tax loss while cash-flowing — sheltering income. Rental losses are passive: they offset passive income freely, and up to $25,000/yr can offset ordinary (W-2) income if you actively participate and your MAGI is under $100k (phasing out to $0 by $150k); unused losses carry forward. On sale, claimed depreciation is recaptured at up to 25%, and gains may owe capital-gains tax (a 1031 exchange can defer both). Figures are a year-1 estimate at your 24.0% rate — not tax advice; consult a CPA.
Schools (NCES district)
- District
- Bradley Bourbonnais Chsd 307
- NCES district ID
- 1706960
- Math proficiency
- 15% ▼ -6.00%
- Reading proficiency
- 24% ▼ -6.00%
- Median HH income
- $59,302
- Composite
- 18.35/100
- National rank
- #8945
- State rank
- #413 of 620 in IL
Livability — Bradley
- Score
- 66/100
- State rank
- #569
- US rank
- #11945
Category grades
Schools grade is shown separately in the Schools card above.
Census & demographics
- Census place
- Bradley, IL
- City population
- 10,217
- Population (ZIP)
- 10,217
Population outlook (Kankakee County) Hauer SSP2
- Today (2025)
- 105,479 people
- By 2030
- 101,792 · -3.5%
- By 2040
- 93,479 · -11.4%
- By 2050
- 85,061 · -19.4%
- By 2075
- 67,314 · -36.2%
- By 2100
- 52,439 · -50.3%
Race, ethnicity, and origin ACS 2023
- Neighborhood character
- Predominantly White (80%)
- Race & ethnicity
- White 80% Hispanic / Latino 14% Two or more races 9% Black 3%
- Hispanic origin (detail)
- Mexican 14%
- Common ancestry
- Romanian 10% Lithuanian 6% Slovak 2%
- Foreign-born
- 4% · Canada
- Languages at home
- 86% English-only · Spanish 11% French/Haitian/Cajun 1% Other Indo-European 1%
Political lean MEDSL · Kankakee
- 2024 margin
- Strong R (+20.8) · D 38.7% · R 59.5% · Other 1.8%
- 2008→2024 swing
- -25.4pp toward R · 2008: 4.6pp · 2024: -20.8pp
- All cycles
- 2024: R+20.8 2020: R+16.5 2016: R+13.3 2012: R+3.4 2008: D+4.6
Not yet ingested
- Civics
- —
Market trends
- HPI YoY
- ▼ -136.35%
- Current HPI
- 178.3271
- Rent YoY
- —
- Metro
- —
- State GDP YoY
- ▲ 1.59%
- F500 in state
- 60
Industry mix (Fortune 500 HQ in IL)
| Industry | F500 HQs | Revenue |
|---|---|---|
| Insurance | 4 | $201B |
|
||
| Consumer Goods | 4 | $87B |
|
||
| Industrial Machinery | 3 | $64B |
|
||
| Healthcare | 2 | $55B |
|
||
| Retail / Pharmacy | 1 | $148B |
|
||
| Agriculture / Food | 1 | $86B |
|
||
Price history
-16.1% since first listed17 events — show timeline
- 2026-03-09 Pending — MRED as Distributed by MLS Grid
- 2026-02-25 Listed $109,000 MRED as Distributed by MLS Grid
- 2025-02-11 Pending — MRED as Distributed by MLS Grid
- 2025-02-11 Relisted — MRED as Distributed by MLS Grid
- 2025-02-07 Listing Removed — MRED as Distributed by MLS Grid
- 2025-02-05 Listing Removed — MRED as Distributed by MLS Grid
- 2025-02-05 Relisted — MRED as Distributed by MLS Grid
- 2025-02-03 Listing Removed — MRED as Distributed by MLS Grid
- 2025-01-12 Listed — MRED as Distributed by MLS Grid
- 2010-04-30 Sold (Public Records) $125,000 Public Records
- 2010-04-27 Sold (MLS) $124,900 MRED as Distributed by MLS Grid
- 2010-03-05 Contingent — MRED as Distributed by MLS Grid
- 2010-01-06 Price Changed $124,900 MRED as Distributed by MLS Grid
- 2009-11-20 Listed $129,900 MRED as Distributed by MLS Grid
- 2006-03-13 Sold (Public Records) $128,000 Public Records
- 2006-03-10 Sold (MLS) $128,000 MRED as Distributed by MLS Grid
- 2006-02-06 Listed $129,900 MRED as Distributed by MLS Grid
Property tax history
+2.3%/yrLatest (2024): $3,819 · +5.2% YoY. Source: county tax records.
Cash-flow waterfall
monthlySold comps — $/sqft
last 12 mo · ≤1 miLoading sold comps…