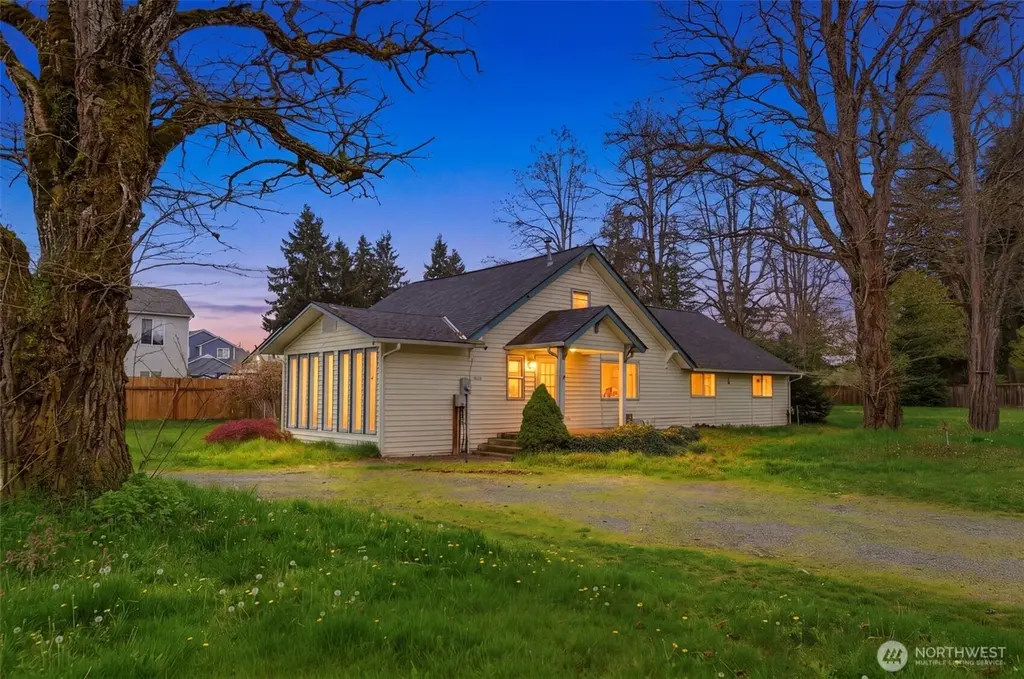
14751 89th Ave SE · Yelm, WA
Flood risk 1/10 · Minimal
- FEMA flood zone
- X (unshaded)
- Chance of flooding over 30 yrs
- 0.0%
- Est. flood insurance / yr
- $507 – $1,088
Fire risk 4/10 · Minor
- Est. fire insurance / yr
- $604 – $1,122
Heat risk 3/10 · Minor
- Hot days now (above 87°F)
- 7 days/yr
- Hot days in 30 yrs
- 15 days/yr
Wind risk 1/10 · Minimal
- Chance of severe wind over 30 yrs
- —
Air-quality risk 6/10 · Moderate
- Unhealthy air days now
- 7 days/yr
- Unhealthy air days in 30 yrs
- 9 days/yr
Risk factors via First Street. Map © Google.
Why this score? — see what drove the C- grade
The composite is a weighted blend of 9 inputs, each scored 0–100. Each bar is that input's sub-score; the figure is the points it added to the 100-point composite (weight × sub-score).
- ARV discount +15.0/15.0
- Cash flow +13.9/30.0
- Schools +4.8/10.0
- DSCR +4.2/10.0
- Rent growth +3.9/5.0
- Livability +3.5/5.0
- 1% rule +3.0/10.0
- Condition / age +2.5/5.0
- Appreciation +0.0/10.0
$380,000
🖨 Deal sheet (PDF) 📄 Offer letter ✓ Due diligence
Listing remarks
Rare opportunity on a spacious corner lot with NO HOA! This classic farmhouse-style home is full of character and ready for your personal vision. Offering 2,481 finished square feet, there’s plenty of room to reimagine and make it your own. Step inside to a generously sized dining room/ bright sunroom and kitchen, perfect for gathering and everyday living. The sunroom, kitchen, and utility room feature vinyl plank flooring, adding a fresh touch to the home’s original charm. The main level includes three bedrooms, including a primary suite with a private en-suite bathroom. Upstairs, you’ll find a versatile loft space and a large bonus room that could easily serve as a fourt
Key facts
- Large bonus room
- Newer roof
- Versatile loft space
Tags
Property features AI
Finance
- Financial info: Acceptable financing: Cash, Conventional, Rehab Loan, USDA Loan
- HOA & community: Community governed by CCRs
Exterior
- Parking: Uncovered parking for 6 vehicles; Driveway; RV parking available
- Security: Partially fenced
- Utilities: Electric energy source; Community water (City of Yelm); Sewer connected (City of Yelm); Power provided by PSE
- Home design: Single-family residence; One and one-half story; Attached / zero lot line; Main entry on the main level; Facing direction not specified
- Construction: Built (effective) in 1944; Block foundation; Metal and vinyl construction materials; Composition roof; Structure type: House
- Exterior features: Metal/vinyl exterior; Partially fenced yard; Outbuildings; Garden space; RV parking; Corner lot with curbs, paved surfaces and sidewalks; Level topography; Has a view
Interior
- Kitchen: Kitchen with eating space; Dishwasher; Microwave; Refrigerator
- Bedrooms: 3 bedrooms (all on the main level); Primary bedroom on the main level; Additional bedroom on the main level; Bonus room on the second level; Dining room (main level); Living room (main level); Entry hall (main level)
- Flooring: Laminate; Vinyl plank; Carpet
- Bathrooms: 2 full bathrooms (both on the main level); 2 bathtubs; 2 showers
- Heating & cooling: Baseboard heating; Stove / free standing heating; Wall furnace; No central cooling
- Interior features: Fireplace; Water heater
- Laundry & utility: Washer; Dryer; Utility room with electric water heater
Neighborhood map
What this means for you Summary
Snapshot
- This is a 3-bed/2.0-bath single-family listed at $380k.
Deal economics
- At list price, monthly cash flow is $42 ($501/yr) — positive.
- The deal already cash-flows at list — no discount required.
- To meet the 1% rule (rent ≥ 1% of price), the offer needs to be $306k (19.6% below list).
- Recommended offer: $306k (19.6% below list) — sets the bar for 1% rule.
- Cap rate 6.4% vs local median 3.7% in Yelm — top-decile yield for the area; either an underpriced asset or a hidden risk that comps aren't pricing in. Stress-test before assuming the spread holds.
Location & tenants
- Location reads 70/100 on livability (#244 in WA) — a middle-class / working-renter tenant base. Strengths: employment A+, housing A+; Watch: cost of living C-, health & safety C-, amenities F.
- Yelm School District (rural): math 48% / reading 59% proficiency, ranked #108 of 291 in WA (top 37%) — acceptable for families but not a draw, mixed tenant base, ~2y average lease.
- Zoned schools: Southworth Elementary (628 students, 45% FRL); Yelm Middle School (696 students, 53% FRL); Yelm High School 12 (1,634 students, 45% FRL).
- Market conditions: Rents rising fast (+5.8%/yr); 434 active listings in the ZIP; 5 comparable units currently listed for rent nearby; rentals at typical pace (median 23d on market — plan ~3-4 weeks tenant-placement turnaround); solid renter incomes; 1,222 units permitted in Thurston County in 2024 (508 in 5+ unit buildings).
- This rent runs 40% of the median local income ($92k/yr) — at the standard rent-burdened threshold; future hikes will face affordability resistance.
Forward outlook
- Local home prices are declining (-3.0%/yr); year-one equity from $3k of loan paydown is wiped out by about $11k of value loss. Plan a longer hold.
- Thurston County population projected at +27% by 2050 — long-run rental-demand tailwind backs the buy-and-hold thesis.
Negotiation context
- It's been on market 51 days — a 3% lower offer ($369k) is reasonable based on typical stale-listing flexibility.
- 2 sale attempts since 5y ago; this cycle's ask has dropped $35k (8%) from the opening price — seller is motivated, your offer sets the floor, not the list.
Risks & watch-outs
- Watch-outs: built in 1944 — expect roof / HVAC / electrical / plumbing capex.
Questions for the listing agent
- It's been on market 51 days. Have you received any prior offers? Is the seller open to a 20% concession, seller financing, or rate buy-down credit?
- Built in 1944 — when were the roof, HVAC, electrical panel, plumbing, and water heater last replaced?
- Is there a deadline driving the sale (1031 exchange, divorce, estate, relocation)? That informs how much negotiation room exists.
- What's the average days-on-market for RENTAL listings here right now (not sales)? A rising rental-DOM trend means longer vacancies and softer asking-rent achievability than the comps imply.
- What's the recent tenant-quality profile in this submarket — average credit score on applications, eviction rate, late-payment / NSF rate, and stable-employment percentage? A property-management company in the area should have these aggregated.
- How much new for-sale + rental construction is in the pipeline within 1–3 miles? Heavy new supply typically softens prices + rents 12–24 months out; constrained supply supports both.
Investment metrics
- 1% rule
- 0.80% ✗
- Cap rate
- 6.42%
- Cash-on-cash
- 0.47%
- DSCR
- 1.02
- GRM
- 10.4
CMA / ARV
- ARV (on-the-fly)
- $575,592
- Comps found
- 12
Show comp detail 12 sales within ~0.75 mi
| Address | Dist | Beds/Ba | Sqft | Sold | Price | $/sf | Match |
|---|---|---|---|---|---|---|---|
| 14727 88th Way SE #18 | 0.09mi | 4/3.0 (+1) | 2,510 (+1%) | 9mo | $636,397 | $254 | 78 |
| 14744 88th Way SE #8 | 0.31mi | 4/2.5 (+1) | 2,385 (-4%) | 1mo | $585,000 | $245 | 71 |
| 14958 91st Ave SE | 0.26mi | 4/2.5 (+1) | 2,366 (-5%) | 3mo | $545,000 | $230 | 71 |
| 14732 88th Way SE #6 | 0.31mi | 4/3.0 (+1) | 2,510 (+1%) | 8mo | $608,975 | $243 | 68 |
| 14756 88th Way SE #10 | 0.31mi | 4/2.5 (+1) | 2,385 (-4%) | 6mo | $577,150 | $242 | 67 |
| 15103 Iverson Loop SE | 0.51mi | 3/2.5 | 2,386 (-4%) | 7mo | $527,000 | $221 | 62 |
| 14843 Prairie Vista Loop SE | 0.18mi | 4/3.0 (+1) | 2,152 (-13%) | 1mo | $500,000 | $232 | 60 |
| 14932 Prairie Vista Loop | 0.10mi | 4/3.0 (+1) | 2,148 (-13%) | 8mo | $475,000 | $221 | 58 |
| 15352 Kayla St SE | 0.69mi | 4/2.5 (+1) | 2,549 (+3%) | 2mo | $550,000 | $216 | 55 |
| 15315 91st Ave SE | 0.58mi | 4/2.5 (+1) | 2,604 (+5%) | 10mo | $580,000 | $223 | 49 |
| 15232 Chad Dr SE | 0.52mi | 4/2.5 (+1) | 2,108 (-15%) | 3mo | $515,000 | $244 | 42 |
| 15230 Kayla St SE | 0.58mi | 4/2.5 (+1) | 2,226 (-10%) | 9mo | $515,000 | $231 | 41 |
Match score weights: distance 35% · size 25% · config 20% · recency 20%. Top-matched comps best support the ARV.
Projected returns pro-forma
-3.0% appreciation · 5.78% rent growth · sell at horizon
- IRR
- -12.8%
- Equity multiple
- 0.53×
- Total profit
- $-50,240
- Equity at exit
- $56,659
- IRR
- -0.3%
- Equity multiple
- 0.98×
- Total profit
- $-2,593
- Equity at exit
- $32,855
Cash invested: $106,400 (down + closing). Projections, not guarantees.
Landlord ↔ Tenant lean methodology
- Overall (STATE)
- 28 Tenant-Leaning
- State Washington
- 28 Tenant-Leaning · D+8
- County
- — inherits STATE
- City
- — inherits STATE
ZIP-level market 98597
- Rents YoY
- 5.8%
- Active inventory
- 434
- Price-to-rent
- 10.4×
Monthly cashflow live
- Estimated rent
- $3,057 high interval (Pro) →
- Mortgage (P&I)
- −$1,993
- Tax from tax record
- −$222 /mo · $2,664/yr
- Insurance
- −$158
- HOA
- −$0
- Vacancy / Maint / Mgmt
- −$642
- Net cashflow
- $42
Break-even live
Sensitivity live
| Price | -10% $257 | -5% $149 | +0% $42 | +5% $-66 | +10% $-173 |
|---|---|---|---|---|---|
| Rent | -10% $-200 | -5% $-79 | +0% $42 | +5% $162 | +10% $283 |
| Rate | -1.0pp $233 | -0.5pp $138 | base $42 | +0.5pp $-57 | +1.0pp $-157 |
UW: 25.0% down · 7.5% · 30yr · 1.5% tax · 5.0% vac · 8.0% maint · 8.0% mgmt
Financing live
Cash to close
- Down payment
- $95,000
- Closing costs
- $11,400
- Reserves months
- —
- Total cash needed
- —
Loan-product check · same deal, 3 products live
Conventional
25% down · 7.5% · 30yr
- Down + closing
- —
- Monthly P&I
- —
- Monthly cashflow
- —
- DSCR
- —
- Eligible?
- —
Personal DTI + credit; lowest rate.
DSCR
20% down · 8.5% · 30yr
- Down + closing
- —
- Monthly P&I
- —
- Monthly cashflow
- —
- DSCR
- —
- Eligible?
- —
No personal income docs; deal must DSCR.
Hard money
10% down · 12.0% · 12mo
- Down + closing
- —
- Monthly P&I
- —
- Monthly cashflow
- —
- DSCR
- —
- Eligible?
- —
Short-term bridge; refi at stabilization.
Rent comps 5 comps
| Address | Beds | Baths | Sqft | Rent | $/sqft | DOM | Units | Dist |
|---|---|---|---|---|---|---|---|---|
| 14708 91st Ave SE Yelm, WA | 4.0 | 2.5 | 2350 | $2,995 | $1.27 | 6d | 1 | 0.14mi |
| 15127 Iverson Loop SE Yelm, WA | 3.0 | 2.5 | 1824 | $2,900 | $1.59 | 23d | 1 | 0.54mi |
| 15717 View Dr SE Yelm, WA | 4.0 | 2.5 | 2126 | $2,650 | $1.25 | 14d | 1 | 0.95mi |
| 14444 99th Ave SE Yelm, WA | 4.0 | 3.0 | 2444 | $3,445 | $1.41 | 23d | 1 | 0.97mi |
| 14386 99th Way SE Yelm, WA | 4.0 | 2.5 | 2482 | $3,299 | $1.33 | 23d | 1 | 1.05mi |
Listing history 17 events
-
2026-06-22statusdays on market $380,000 Active 51 DOM
-
2026-06-13status $380,000 Pending 50 DOM
-
2026-06-10days on market $380,000 Active 50 DOM
-
2026-06-09days on market $380,000 Active 49 DOM
-
2026-06-08days on market $380,000 Active 48 DOM
-
2026-06-07days on market $380,000 Active 47 DOM
-
2026-06-02days on market $380,000 Active 42 DOM
-
2026-06-01days on market $380,000 Active 41 DOM
-
2026-06-01price $380,000 Active 40 DOM
-
2026-05-31days on market $399,999 Active 40 DOM
-
2026-05-30days on market $399,999 Active 39 DOM
-
2026-05-14price $399,999
-
2026-04-21$415,000 Active
-
2021-10-23historical
-
2021-10-22soldstatus $415,000 Closed
-
2021-09-02status Pending
-
2021-08-11$415,000 Active
ⓘ Source: listings_history table (triggers on properties + properties_extension) + one-shot
backfill from property_details.listing_events for pre-trigger history.
Tax reassessment forecast WA · Resets to sale price
- Current annual tax
- $2,664 · $222/mo
- Projected year-2 tax
- $3,724 · $310/mo
- Expected delta
- +$1,060/yr (+$88/mo · 39.8%)
ⓘ Screening estimate from a state-policy table — verify with the county assessor before closing.
Climate risk First Street
- Flood 1/10 Low FEMA zone X (unshaded) · 0% chance over 30 yrs
- Wildfire 4/10 Moderate
- Heat 3/10 Moderate 7 d/yr ≥87°F today · 15 d/yr by 30 yrs out
- Wind 1/10 Low
- Air quality 6/10 Major 7 unhealthy d/yr today · 9 by 30 yrs out
Nearby sold comps map
Loading sold comps map…
Walkable amenities ~0.75 mi
Loading nearby amenities…
Taxation est. · year 1
- Rental income
- $36,681
- − Mortgage interest
- −$21,286
- − Property taxes
- −$2,664
- − Insurance
- −$1,900
- − Repairs & maintenance
- −$2,934
- − Management
- −$2,934
- − Depreciation
- −$11,055
- Taxable loss
- −$6,092
- Est. tax savings @ 24.0%
- +$1,462
- After-tax cash flow
- $1,963/yr
For passive investors: Depreciation is non-cash, so a rental often shows a tax loss while cash-flowing — sheltering income. Rental losses are passive: they offset passive income freely, and up to $25,000/yr can offset ordinary (W-2) income if you actively participate and your MAGI is under $100k (phasing out to $0 by $150k); unused losses carry forward. On sale, claimed depreciation is recaptured at up to 25%, and gains may owe capital-gains tax (a 1031 exchange can defer both). Figures are a year-1 estimate at your 24.0% rate — not tax advice; consult a CPA.
Schools (NCES district)
- District
- Yelm School District
- NCES district ID
- 5310140
- Math proficiency
- 48% ▲ 1.00%
- Reading proficiency
- 59% ▲ 1.00%
- Median HH income
- $58,328
- Composite
- 48.34/100
- National rank
- #4685
- State rank
- #108 of 291 in WA
Livability — Yelm
- Score
- 70/100
- State rank
- #244
- US rank
- #7737
Category grades
Schools grade is shown separately in the Schools card above.
Census & demographics
- Census place
- Yelm, WA
- County
- Thurston County · 269,345 people
- City population
- 26,669
- Metro
- Olympia-Lacey-Tumwater, WA
- Population (ZIP)
- 26,669
- Household income
- $92,219
- Rent vs Own
- Severe rent burden
- 259.0
Population outlook (Thurston County) Hauer SSP2
- Today (2025)
- 308,239 people
- By 2030
- 326,483 · +5.9%
- By 2040
- 359,890 · +16.8%
- By 2050
- 391,800 · +27.1%
- By 2075
- 468,024 · +51.8%
- By 2100
- 519,890 · +68.7%
Race, ethnicity, and origin ACS 2023
- Neighborhood character
- Predominantly White (76%)
- Race & ethnicity
- White 76% Two or more races 10% Hispanic / Latino 10% Black 3% Pacific Islander 2% Asian 2%
- Hispanic origin (detail)
- Mexican 7% Puerto Rican 1%
- Common ancestry
- Portuguese 5% Romanian 4% Lithuanian 3%
- Foreign-born
- 7% · Canada, South Korea
- Languages at home
- 90% English-only · Spanish 6% German/W. Germanic 1% Other Asian/Pacific 1%
Political lean MEDSL · Thurston
- 2024 margin
- Strong D (+20.4) · D 58.5% · R 38.1% · Other 3.5%
- 2008→2024 swing
- -1.3pp toward R · 2008: 21.7pp · 2024: 20.4pp
- All cycles
- 2024: D+20.4 2020: D+18.6 2016: D+15.4 2012: D+19.0 2008: D+21.7
Not yet ingested
- Civics
- —
Market trends
- HPI YoY
- ▼ -192.07%
- Current HPI
- 326.4361
- Rent YoY
- ▲ 5.78%
- Metro
- Olympia-Lacey-Tumwater, WA
- State GDP YoY
- ▲ 4.65%
- F500 in state
- 22
Industry mix (Fortune 500 HQ in WA)
| Industry | F500 HQs | Revenue |
|---|---|---|
| Retail | 2 | $269B |
|
||
| Technology / Retail | 1 | $638B |
|
||
| Technology | 1 | $245B |
|
||
| Telecommunications | 1 | $38B |
|
||
| Food / Beverage | 1 | $36B |
|
||
| Automotive / Trucks | 1 | $34B |
|
||
Price history
-3.6% since first listed6 events — show timeline
- 2026-05-14 Price Changed $399,999 NWMLS as Distributed by MLS Grid
- 2026-04-21 Listed $415,000 NWMLS as Distributed by MLS Grid
- 2021-10-23 Delisted — NWMLS as Distributed by MLS Grid
- 2021-10-22 Sold (MLS) $415,000 NWMLS as Distributed by MLS Grid
- 2021-09-02 Pending — NWMLS as Distributed by MLS Grid
- 2021-08-11 Listed $415,000 NWMLS as Distributed by MLS Grid
Property tax history
+1.7%/yrLatest (2026): $2,664 · -8.3% YoY. Source: county tax records.
Cash-flow waterfall
monthlySold comps — $/sqft
last 12 mo · ≤1 miLoading sold comps…