1500 Hanna Ave Ave · Corcoran, CA
Flood risk 1/10 · Minimal
- FEMA flood zone
- X (unshaded)
- Chance of flooding over 30 yrs
- 0.0%
- Est. flood insurance / yr
- $507 – $1,088
Fire risk 5/10 · Moderate
- Est. fire insurance / yr
- $659 – $1,223
Heat risk 8/10 · Major
- Hot days now (above 105°F)
- 7 days/yr
- Hot days in 30 yrs
- 16 days/yr
Wind risk 1/10 · Minimal
- Chance of severe wind over 30 yrs
- —
Air-quality risk 10/10 · Severe
- Unhealthy air days now
- 36 days/yr
- Unhealthy air days in 30 yrs
- 38 days/yr
Risk factors via First Street. Map © Google.
Why this score? — see what drove the C+ grade
The composite is a weighted blend of 9 inputs, each scored 0–100. Each bar is that input's sub-score; the figure is the points it added to the 100-point composite (weight × sub-score).
- Cash flow +18.9/30.0
- ARV discount +15.0/15.0
- Appreciation +10.0/10.0
- DSCR +6.0/10.0
- 1% rule +3.9/10.0
- Rent growth +2.5/5.0
- Livability +2.5/5.0
- Condition / age +2.5/5.0
- Schools +1.7/10.0
$245,000
🖨 Deal sheet 📄 Offer letter ✓ Due diligence
Listing remarks
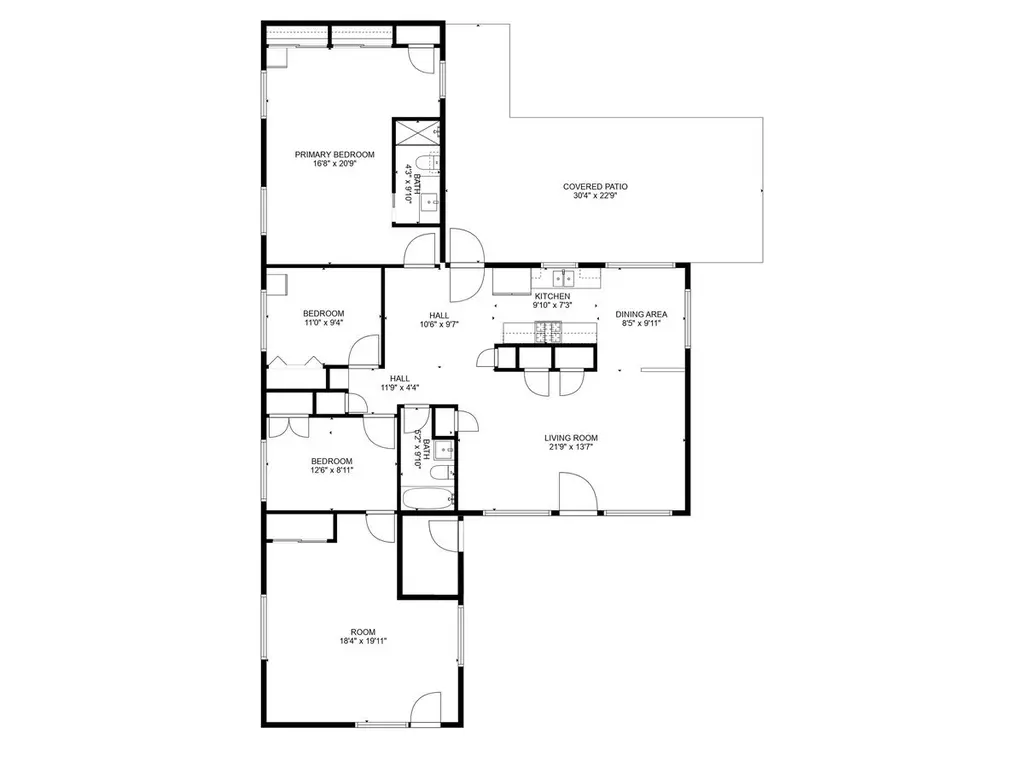
Charming Home with Endless Potential in the Heart of Corcoran! Welcome to 1500 Hanna Avenue — where comfort, character, and opportunity meet! This spacious 4-bedroom, 2 1/2-bath home offers 1,744 sq. ft. of living space, designed for families who love to gather, create, and grow. Built in 1972, this home carries timeless charm and solid craftsmanship — ready for your modern touch to make it shine again! Step inside to find an inviting layout perfect for both relaxing evenings and weekend entertaining. Outside, you'll find a detached 2-car garage complete with a built-in shop and air compressor — a dream setup for any hobbyist, mechanic, or DIY enthusiast. Need space fo
Key facts
- Rv access
- Spacious patio area
- Built in shop
Tags
Neighborhood map
What this means for you Summary
Snapshot
- This is a 4-bed/2.0-bath single-family listed at $245k.
Deal economics
- At list price, monthly cash flow is $253 ($3k/yr) — positive.
- The deal already cash-flows at list — no discount required.
- To meet the 1% rule (rent ≥ 1% of price), the offer needs to be $217k (11.4% below list).
- Recommended offer: $217k (11.4% below list) — sets the bar for 1% rule.
- Cap rate 7.5% vs local median 4.2% in Corcoran — top-decile yield for the area; either an underpriced asset or a hidden risk that comps aren't pricing in. Stress-test before assuming the spread holds.
Location & tenants
- Location reads 49/100 on livability (#1,161 in CA) — a working-class tenant base; expect higher turnover. Strengths: housing A+; Watch: crime D, schools F, amenities F.
- Corcoran Joint Unified (town): math 12% / reading 30% proficiency, ranked #464 of 517 in CA (top 90%) — low school quality limits family demand, transient renter base, plan for 1-2y turnover; 78% free/reduced lunch — lower-income household profile, screen leases tightly.
- Market conditions: 66 active listings in the ZIP; 2 comparable units currently listed for rent nearby; 741 units permitted in Kings County in 2024 (307 in 5+ unit buildings).
Forward outlook
- In year one you build about $26k of equity ($2k loan paydown + $24k appreciation (10.0% local appreciation)).
- At projected returns (10.0% appreciation + 3.0% rent growth), your $69k cash investment doubles in ~3 years — after that, you're playing with house money.
- By year 2, paydown + projected appreciation supports a ~$42k cash-out refi (75% LTV) — recoverable capital for the next deal without selling this one.
Negotiation context
- It's been on market 90 days — a 6% lower offer ($230k) is reasonable based on typical stale-listing flexibility.
Risks & watch-outs
- Climate carrying-cost: moderate wildfire risk; extreme-heat days projected 7→16/yr by 2055 (HVAC capex compounding) — expect insurance premiums to compound above CPI over the hold.
Questions for the listing agent
- It's been on market 90 days. Have you received any prior offers? Is the seller open to a 11% concession, seller financing, or rate buy-down credit?
- Built in 1972 — when were the roof, HVAC, electrical panel, plumbing, and water heater last replaced?
- Why hasn't it sold? Are there any deal-killer items the seller is aware of (foundation, flood, title, zoning, code violations)?
- Is there a deadline driving the sale (1031 exchange, divorce, estate, relocation)? That informs how much negotiation room exists.
- Schools are F-rated, which usually means shorter tenancies and higher turnover. Who's the typical renter profile here, and what's been the actual vacancy rate?
- Crime grade is D in this area — have there been break-ins, vandalism, or insurance claims at this property in the last 3 years? What carrier currently insures it and at what premium?
- What's the average days-on-market for RENTAL listings here right now (not sales)? A rising rental-DOM trend means longer vacancies and softer asking-rent achievability than the comps imply.
- What's the recent tenant-quality profile in this submarket — average credit score on applications, eviction rate, late-payment / NSF rate, and stable-employment percentage? A property-management company in the area should have these aggregated.
- How much new for-sale + rental construction is in the pipeline within 1–3 miles? Heavy new supply typically softens prices + rents 12–24 months out; constrained supply supports both.
Investment metrics
- 1% rule
- 0.89% ✗
- Cap rate
- 7.53%
- Cash-on-cash
- 4.43%
- DSCR
- 1.20
- GRM
- 9.4
CMA / ARV
- ARV (on-the-fly)
- $322,640
- Comps found
- 12
Show comp detail 12 sales within ~0.75 mi
| Address | Dist | Beds/Ba | Sqft | Sold | Price | $/sf | Match |
|---|---|---|---|---|---|---|---|
| 1233 Chase Ave | 0.42mi | 4/2.0 | 1,688 (-3%) | 8mo | $315,000 | $187 | 69 |
| 1424 Norboe Ave | 0.49mi | 4/2.0 | 1,722 (-1%) | 14mo | $265,000 | $154 | 63 |
| 2104 Bell Ave | 0.53mi | 4/2.0 | 1,579 (-10%) | 0mo | $325,000 | $206 | 59 |
| 2117 Circle Dr | 0.64mi | 3/1.5 (-1) | 1,665 (-4%) | 9mo | $280,000 | $168 | 48 |
| 2312 Brokaw Ave | 0.62mi | 4/2.0 | 1,600 (-8%) | 11mo | $350,000 | $219 | 48 |
| 516 Josephine Ave | 0.50mi | 4/2.0 | 1,510 (-13%) | 12mo | $338,000 | $224 | 45 |
| 2217 Philip Ave | 0.73mi | 3/2.0 (-1) | 1,832 (+5%) | 18mo | $330,000 | $180 | 38 |
| 1240 Flory Ave Ave | 0.58mi | 3/2.0 (-1) | 1,605 (-8%) | 20mo | $285,000 | $178 | 37 |
| 1721 Letts Ave | 0.61mi | 3/2.0 (-1) | 1,580 (-9%) | 17mo | $259,900 | $164 | 37 |
| 1502 Sequoia Ave | 0.75mi | 4/2.0 | 1,574 (-10%) | 17mo | $339,900 | $216 | 35 |
| 1712 Letts Ave Ave | 0.60mi | 3/2.0 (-1) | 1,485 (-15%) | 11mo | $265,000 | $178 | 33 |
| 1707 Heffner Ave | 0.60mi | 3/2.0 (-1) | 1,918 (+10%) | 22mo | $355,000 | $185 | 32 |
Match score weights: distance 35% · size 25% · config 20% · recency 20%. Top-matched comps best support the ARV.
Projected returns pro-forma
10.0% appreciation · 3.0% rent growth · sell at horizon
- IRR
- 27.5%
- Equity multiple
- 3.18×
- Total profit
- $149,459
- Equity at exit
- $220,715
- IRR
- 24.0%
- Equity multiple
- 7.23×
- Total profit
- $427,225
- Equity at exit
- $475,981
Cash invested: $68,600 (down + closing). Projections, not guarantees.
Landlord ↔ Tenant lean methodology
- Overall (STATE)
- 18 Strongly Tenant-Friendly
- State California
- 18 Strongly Tenant-Friendly · D+13
- County
- — inherits STATE
- City
- — inherits STATE
ZIP-level market 93212
- Home prices YoY
- 6.5%
- Active inventory
- 66
- Price-to-rent
- 9.4×
Monthly cashflow live
- Estimated rent
- $2,170 medium interval (Pro) →
- Mortgage (P&I)
- −$1,285
- Tax from tax record
- −$74 /mo · $888/yr
- Insurance
- −$102
- HOA
- −$0
- Vacancy / Maint / Mgmt
- −$456
- Net cashflow
- $253
Break-even live
UW: 25.0% down · 7.5% · 30yr · 1.5% tax · 5.0% vac · 8.0% maint · 8.0% mgmt
Financing live
Cash to close
- Down payment
- $61,250
- Closing costs
- $7,350
- Reserves months
- —
- Total cash needed
- —
Loan-product check · same deal, 3 products live
Conventional
25% down · 7.5% · 30yr
- Down + closing
- —
- Monthly P&I
- —
- Monthly cashflow
- —
- DSCR
- —
- Eligible?
- —
Personal DTI + credit; lowest rate.
DSCR
20% down · 8.5% · 30yr
- Down + closing
- —
- Monthly P&I
- —
- Monthly cashflow
- —
- DSCR
- —
- Eligible?
- —
No personal income docs; deal must DSCR.
Hard money
10% down · 12.0% · 12mo
- Down + closing
- —
- Monthly P&I
- —
- Monthly cashflow
- —
- DSCR
- —
- Eligible?
- —
Short-term bridge; refi at stabilization.
Rent comps 2 comps
| Address | Beds | Baths | Sqft | Rent | $/sqft | DOM | Units | Dist |
|---|---|---|---|---|---|---|---|---|
| 1696 Hume Lake Ave Corcoran, CA | 3.0 | 2.0 | 1213 | $2,000 | $1.65 | 13d | 1 | 0.91mi |
| 1732 Sequoia Ave Corcoran, CA | 4.0 | 3.0 | 1800 | $2,300 | $1.28 | 13d | 1 | 0.97mi |
Listing history 5 events
-
2026-01-29status Pending
-
2025-12-09price $245,000
-
2025-10-17$275,000 Active
-
2025-07-25price $290,000
-
2025-04-12price $300,000
ⓘ Source: listings_history table (triggers on properties + properties_extension) + one-shot
backfill from property_details.listing_events for pre-trigger history.
Tax reassessment forecast CA · Resets to sale price
- Current annual tax
- $888 · $74/mo
- Projected year-2 tax
- $1,862 · $155/mo
- Expected delta
- +$974/yr (+$81/mo · 109.6%)
ⓘ Screening estimate from a state-policy table — verify with the county assessor before closing.
Climate risk First Street
- Flood 1/10 Low FEMA zone X (unshaded) · 0% chance over 30 yrs
- Wildfire 5/10 Major
- Heat 8/10 Severe 7 d/yr ≥105°F today · 16 d/yr by 30 yrs out
- Wind 1/10 Low
- Air quality 10/10 Extreme 36 unhealthy d/yr today · 38 by 30 yrs out
Nearby sold comps map
Loading sold comps map…
Walkable amenities ~0.75 mi
Loading nearby amenities…
Taxation est. · year 1
- Rental income
- $26,040
- − Mortgage interest
- −$13,724
- − Property taxes
- −$888
- − Insurance
- −$1,225
- − Repairs & maintenance
- −$2,083
- − Management
- −$2,083
- − Depreciation
- −$7,127
- Taxable loss
- −$1,091
- Est. tax savings @ 24.0%
- +$262
- After-tax cash flow
- $3,302/yr
For passive investors: Depreciation is non-cash, so a rental often shows a tax loss while cash-flowing — sheltering income. Rental losses are passive: they offset passive income freely, and up to $25,000/yr can offset ordinary (W-2) income if you actively participate and your MAGI is under $100k (phasing out to $0 by $150k); unused losses carry forward. On sale, claimed depreciation is recaptured at up to 25%, and gains may owe capital-gains tax (a 1031 exchange can defer both). Figures are a year-1 estimate at your 24.0% rate — not tax advice; consult a CPA.
Schools (NCES district)
- District
- Corcoran Joint Unified
- NCES district ID
- 0609690
- Math proficiency
- 12% ▼ -12.00%
- Reading proficiency
- 30% ▼ -8.00%
- Median HH income
- $34,649
- Composite
- 17.2/100
- National rank
- #9103
- State rank
- #464 of 517 in CA
Livability — Corcoran
- Score
- 49/100
- State rank
- #1161
- US rank
- #25849
Category grades
Schools grade is shown separately in the Schools card above.
Census & demographics
- Census place
- Corcoran, CA
- Population (ZIP)
- 23,407
Population outlook (Kings County) Hauer SSP2
- Today (2025)
- 147,136 people
- By 2030
- 145,623 · -1.0%
- By 2040
- 146,017 · -0.8%
- By 2050
- 145,239 · -1.3%
- By 2075
- 131,479 · -10.6%
- By 2100
- 103,967 · -29.3%
Race, ethnicity, and origin ACS 2023
- Neighborhood character
- Predominantly Hispanic (74%)
- Race & ethnicity
- Hispanic / Latino 74% Two or more races 25% White 12% Black 10% Native American 3% Asian 1%
- Hispanic origin (detail)
- Mexican 68% Puerto Rican 2%
- Common ancestry
- Russian 1%
- Foreign-born
- 24% · Canada
- Languages at home
- 49% English-only · Spanish 49%
Political lean MEDSL · Kings
- 2024 margin
- Strong R (+23.0) · D 37.4% · R 60.4% · Other 2.2%
- 2008→2024 swing
- -8.9pp toward R · 2008: -14.1pp · 2024: -23.0pp
- All cycles
- 2024: R+23.0 2020: R+12.2 2016: R+14.1 2012: R+16.3 2008: R+14.1
Not yet ingested
- Civics
- —
Market trends
- HPI YoY
- ▲ 24.86%
- Current HPI
- 405.1924
- Rent YoY
- —
- Metro
- —
- State GDP YoY
- ▲ 3.21%
- F500 in state
- 116
Industry mix (Fortune 500 HQ in CA)
| Industry | F500 HQs | Revenue |
|---|---|---|
| Technology | 27 | $1,492B |
|
||
| Financial Services | 3 | $174B |
|
||
| Retail | 3 | $44B |
|
||
| Insurance | 3 | $26B |
|
||
| Media / Entertainment | 2 | $115B |
|
||
| Pharmaceuticals / Biotech | 2 | $62B |
|
||
Price history
-18.3% since first listed5 events — show timeline
- 2026-01-29 Pending — TCMLS
- 2025-12-09 Price Changed $245,000 TCMLS
- 2025-10-17 Listed $275,000 TCMLS
- 2025-07-25 Price Changed $290,000 TCMLS
- 2025-04-12 Price Changed $300,000 TCMLS
Property tax history
+2.6%/yrLatest (2025): $888 · +2.7% YoY. Source: county tax records.
Cash-flow waterfall
monthlySold comps — $/sqft
last 12 mo · ≤1 miLoading sold comps…