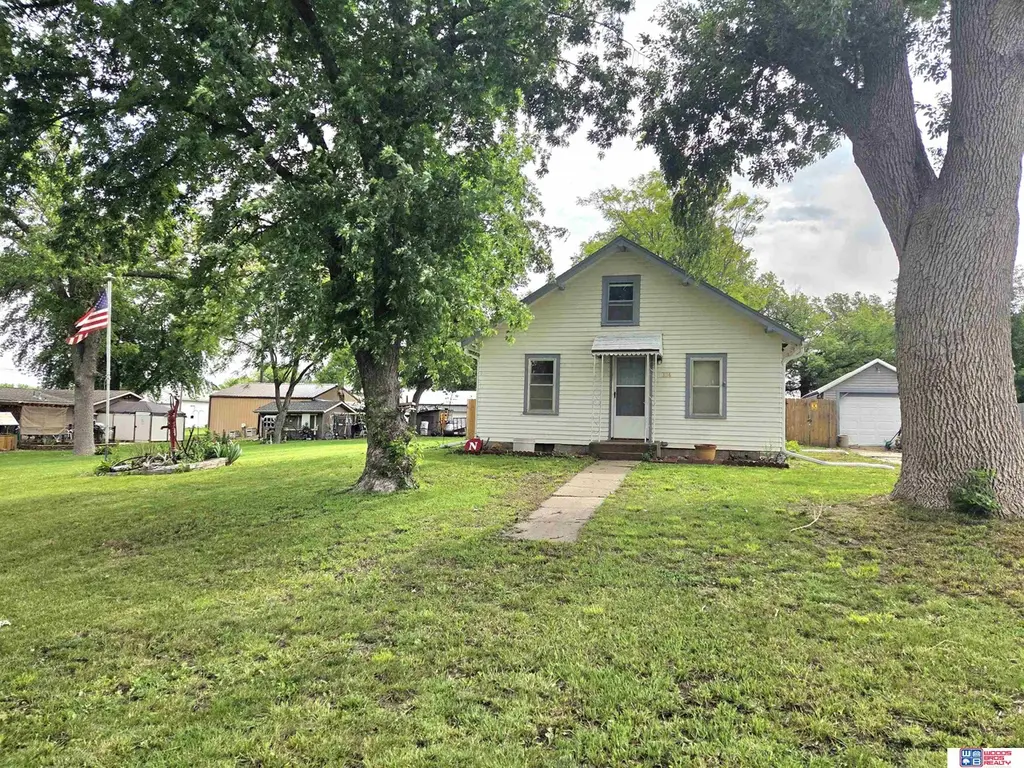
304 Ford St · Filley, NE
Flood risk 1/10 · Minimal
- FEMA flood zone
- X (unshaded)
- Chance of flooding over 30 yrs
- 0.0%
- Est. flood insurance / yr
- $473 – $860
Fire risk 2/10 · Minimal
- Est. fire insurance / yr
- $1,161 – $2,155
Heat risk 3/10 · Minor
- Hot days now (above 103°F)
- 7 days/yr
- Hot days in 30 yrs
- 16 days/yr
Wind risk 2/10 · Minimal
- Chance of severe wind over 30 yrs
- —
Air-quality risk 2/10 · Minimal
- Unhealthy air days now
- 0 days/yr
- Unhealthy air days in 30 yrs
- 1 days/yr
Risk factors via First Street. Map © Google.
Why this score? — see what drove the C grade
The composite is a weighted blend of 9 inputs, each scored 0–100. Each bar is that input's sub-score; the figure is the points it added to the 100-point composite (weight × sub-score).
- Cash flow +20.3/30.0
- ARV discount +7.5/15.0
- DSCR +6.4/10.0
- Schools +5.2/10.0
- Appreciation +5.0/10.0
- 1% rule +4.7/10.0
- Livability +3.5/5.0
- Rent growth +2.5/5.0
- Condition / age +2.5/5.0
$92,900
🖨 Deal sheet 📄 Offer letter ✓ Due diligence
Listing remarks
No Show until May 29th. Cute home on a large lot in Filley. Cash or Conventional loan.
Key facts
- 0.32 acre lot
- Garage
- Built 1935
Property features AI
Finance
- Financial info: Taxes listed (not included per instructions)
Exterior
- Parking: Detached covered garage with 1 parking space
- Security: Security system
- Utilities: Public water; Public sewer; Electricity available; Propane available
- Home design: Single-family residence; Residential property; Not new (built in 1935)
- Construction: Wood siding; Composition roof; Block foundation; Built in 1935
- Exterior features: Wood privacy fencing; City lot over 1/4 up to 1/2 acre (approximately 0.32 acre); Lot dimensions about 100 x 140
Interior
- Kitchen: Range
- Bedrooms: Master bedroom on the main floor; Additional bedrooms on the main floor
- Flooring: Laminate flooring; Vinyl flooring
- Bathrooms: Two bathrooms total (one full, one 1/4); one main-level bathroom and one below-grade bathroom
- Heating & cooling: Propane forced-air heating; Central air conditioning
- Interior features: Security system; No fireplaces
- Laundry & utility: Basement utility space (full, unfinished)
Neighborhood map
What this means for you Summary
Snapshot
- This is a 2-bed/1.0-bath single-family listed at $93k.
Deal economics
- At list price, monthly cash flow is $119 ($1k/yr) — positive.
- The deal already cash-flows at list — no discount required.
- To meet the 1% rule (rent ≥ 1% of price), the offer needs to be $90k (3.4% below list).
- Recommended offer: $90k (3.4% below list) — sets the bar for 1% rule.
Location & tenants
- Location reads 69/100 on livability (#241 in NE) — a middle-class / working-renter tenant base. Strengths: cost of living A+, housing A+, crime A-; Watch: health & safety C-, amenities F, commute F.
- Freeman Public Schools (rural): math 63% / reading 56% proficiency, ranked #19 of 111 in NE (top 17%) — acceptable for families but not a draw, mixed tenant base, ~2y average lease; only 12% free/reduced lunch — higher-income household profile.
- Zoned schools: Freeman Elementary-Adams (math 62% / reading 52%, grade C+, #136 of 502 statewide, top 31%, 278 students, 18% FRL); Freeman High School (math 62% / reading 62%, grade B-, #39 of 261 statewide, top 18%, 199 students, 19% FRL).
- Market conditions: 1 active listings in the ZIP; 41 units permitted in Gage County in 2024 (14 in 5+ unit buildings).
Forward outlook
- In year one you build about $3k of equity ($642 loan paydown + $3k appreciation (3.0% local appreciation)).
- Gage County population projected at -15% by 2050 — secular population decline; favor cash flow + early exit over multi-decade hold.
- At projected returns (3.0% appreciation + 3.0% rent growth), your $26k cash investment doubles in ~5 years — after that, you're playing with house money.
- By year 10, paydown + projected appreciation supports a ~$33k cash-out refi (75% LTV) — recoverable capital for the next deal without selling this one.
Negotiation context
- It's been on market 22 days — a 2% lower offer ($92k) is reasonable based on typical stale-listing flexibility.
- 2 sale attempts since 2y ago with the ask held roughly flat each time — persistent listings suggest the price (not the market) is what's stuck; bring a comps-based counter.
- Current owner paid $78k; 19% above their basis — modest negotiation headroom, anchor on the comps not their cost.
Risks & watch-outs
- Watch-outs: built in 1935 — expect roof / HVAC / electrical / plumbing capex.
Questions for the listing agent
- Built in 1935 — when were the roof, HVAC, electrical panel, plumbing, and water heater last replaced?
- Is there a deadline driving the sale (1031 exchange, divorce, estate, relocation)? That informs how much negotiation room exists.
- Schools are F-rated, which usually means shorter tenancies and higher turnover. Who's the typical renter profile here, and what's been the actual vacancy rate?
- What's the average days-on-market for RENTAL listings here right now (not sales)? A rising rental-DOM trend means longer vacancies and softer asking-rent achievability than the comps imply.
- What's the recent tenant-quality profile in this submarket — average credit score on applications, eviction rate, late-payment / NSF rate, and stable-employment percentage? A property-management company in the area should have these aggregated.
- How much new for-sale + rental construction is in the pipeline within 1–3 miles? Heavy new supply typically softens prices + rents 12–24 months out; constrained supply supports both.
Investment metrics
- 1% rule
- 0.97% ✗
- Cap rate
- 7.83%
- Cash-on-cash
- 5.49%
- DSCR
- 1.24
- GRM
- 8.6
CMA / ARV
No comps found within radius.
Projected returns pro-forma
3.0% appreciation · 3.0% rent growth · sell at horizon
- IRR
- 12.6%
- Equity multiple
- 1.72×
- Total profit
- $18,749
- Equity at exit
- $41,772
- IRR
- 14.6%
- Equity multiple
- 3.16×
- Total profit
- $56,117
- Equity at exit
- $64,375
Cash invested: $26,012 (down + closing). Projections, not guarantees.
Landlord ↔ Tenant lean methodology
- Overall (STATE)
- 83 Strongly Landlord-Friendly
- State Nebraska
- 83 Strongly Landlord-Friendly · R+13
- County
- — inherits STATE
- City
- — inherits STATE
ZIP-level market 68357
- Active inventory
- 1
- Price-to-rent
- 8.6×
Monthly cashflow live
- Estimated rent
- $898 medium interval (Pro) →
- Mortgage (P&I)
- −$487
- Tax from tax record
- −$64 /mo · $772/yr
- Insurance
- −$39
- HOA
- −$0
- Vacancy / Maint / Mgmt
- −$189
- Net cashflow
- $119
Break-even live
UW: 25.0% down · 7.5% · 30yr · 1.5% tax · 5.0% vac · 8.0% maint · 8.0% mgmt
Financing live
Cash to close
- Down payment
- $23,225
- Closing costs
- $2,787
- Reserves months
- —
- Total cash needed
- —
Loan-product check · same deal, 3 products live
Conventional
25% down · 7.5% · 30yr
- Down + closing
- —
- Monthly P&I
- —
- Monthly cashflow
- —
- DSCR
- —
- Eligible?
- —
Personal DTI + credit; lowest rate.
DSCR
20% down · 8.5% · 30yr
- Down + closing
- —
- Monthly P&I
- —
- Monthly cashflow
- —
- DSCR
- —
- Eligible?
- —
No personal income docs; deal must DSCR.
Hard money
10% down · 12.0% · 12mo
- Down + closing
- —
- Monthly P&I
- —
- Monthly cashflow
- —
- DSCR
- —
- Eligible?
- —
Short-term bridge; refi at stabilization.
Listing history 22 events
-
2026-06-19days on market $92,900 Active 22 DOM
-
2026-06-18days on market $92,900 Active 21 DOM
-
2026-06-17days on market $92,900 Active 20 DOM
-
2026-06-16days on market $92,900 Active 19 DOM
-
2026-06-15days on market $92,900 Active 18 DOM
-
2026-06-14days on market $92,900 Active 16 DOM
-
2026-06-12days on market $92,900 Active 15 DOM
-
2026-06-09days on market $92,900 Active 12 DOM
-
2026-06-08days on market $92,900 Active 11 DOM
-
2026-06-07days on market $92,900 Active 10 DOM
-
2026-06-05days on market $92,900 Active 8 DOM
-
2026-06-04statusdays on market $92,900 Active 6 DOM
-
2026-06-02days on market $92,900 New 5 DOM
-
2026-06-01days on market $92,900 New 4 DOM
-
2026-05-31days on market $92,900 New 3 DOM
-
2026-05-31days on market $92,900 New 2 DOM
-
2026-05-21$92,900 New
-
2024-07-25soldstatus $78,000
-
2024-07-24soldstatus $77,500 Sold
-
2024-06-21status Pending
-
2024-06-14$84,900 New
-
2002-07-12soldstatus $25,000
ⓘ Source: listings_history table (triggers on properties + properties_extension) + one-shot
backfill from property_details.listing_events for pre-trigger history.
Tax reassessment forecast NE · Resets to sale price
- Current annual tax
- $772 · $64/mo
- Projected year-2 tax
- $1,607 · $134/mo
- Expected delta
- +$836/yr (+$70/mo · 108.3%)
ⓘ Screening estimate from a state-policy table — verify with the county assessor before closing.
Climate risk First Street
- Flood 1/10 Low FEMA zone X (unshaded) · 0% chance over 30 yrs
- Wildfire 2/10 Low
- Heat 3/10 Moderate 7 d/yr ≥103°F today · 16 d/yr by 30 yrs out
- Wind 2/10 Low
- Air quality 2/10 Low 0 unhealthy d/yr today · 1 by 30 yrs out
Nearby sold comps map
Loading sold comps map…
Walkable amenities ~0.75 mi
Loading nearby amenities…
Taxation est. · year 1
- Rental income
- $10,772
- − Mortgage interest
- −$5,204
- − Property taxes
- −$772
- − Insurance
- −$464
- − Repairs & maintenance
- −$862
- − Management
- −$862
- − Depreciation
- −$2,703
- Taxable loss
- −$94
- Est. tax savings @ 24.0%
- +$23
- After-tax cash flow
- $1,450/yr
For passive investors: Depreciation is non-cash, so a rental often shows a tax loss while cash-flowing — sheltering income. Rental losses are passive: they offset passive income freely, and up to $25,000/yr can offset ordinary (W-2) income if you actively participate and your MAGI is under $100k (phasing out to $0 by $150k); unused losses carry forward. On sale, claimed depreciation is recaptured at up to 25%, and gains may owe capital-gains tax (a 1031 exchange can defer both). Figures are a year-1 estimate at your 24.0% rate — not tax advice; consult a CPA.
Schools (NCES district)
- District
- Freeman Public Schools
- NCES district ID
- 3100116
- Math proficiency
- 63% ▲ 6.00%
- Reading proficiency
- 56% ▼ -8.00%
- Median HH income
- $60,686
- Composite
- 51.72/100
- National rank
- #1685
- State rank
- #19 of 111 in NE
Livability — Filley
- Score
- 69/100
- State rank
- #241
- US rank
- #8605
Category grades
Schools grade is shown separately in the Schools card above.
Census & demographics
- Census place
- Filley, NE
- Population (ZIP)
- 325
Population outlook (Gage County) Hauer SSP2
- Today (2025)
- 21,133 people
- By 2030
- 20,629 · -2.4%
- By 2040
- 19,398 · -8.2%
- By 2050
- 18,049 · -14.6%
- By 2075
- 15,504 · -26.6%
- By 2100
- 12,941 · -38.8%
Race, ethnicity, and origin ACS 2023
- Neighborhood character
- Predominantly White (98%)
- Race & ethnicity
- White 98% Hispanic / Latino 2%
- Common ancestry
- Italian 4% Iranian 1% Portuguese 1%
- Languages at home
- 97% English-only · Spanish 2% Arabic 1%
Political lean MEDSL · Gage
- 2024 margin
- Solid R (+39.2) · D 29.7% · R 68.9% · Other 1.4%
- 2008→2024 swing
- -29.8pp toward R · 2008: -9.5pp · 2024: -39.2pp
- All cycles
- 2024: R+39.2 2020: R+36.5 2016: R+34.5 2012: R+16.8 2008: R+9.5
Not yet ingested
- Civics
- —
Market trends
- HPI YoY
- —
- Current HPI
- —
- Rent YoY
- —
- Metro
- —
- State GDP YoY
- ▲ 0.68%
- F500 in state
- 2
Industry mix (Fortune 500 HQ in NE)
| Industry | F500 HQs | Revenue |
|---|---|---|
| Conglomerate | 1 | $371B |
|
||
Price history
+271.6% since first listed6 events — show timeline
- 2026-05-21 Listed $92,900 GPRMLS
- 2024-07-25 Sold (Public Records) $78,000 Public Records
- 2024-07-24 Sold (MLS) $77,500 GPRMLS
- 2024-06-21 Pending — GPRMLS
- 2024-06-14 Listed $84,900 GPRMLS
- 2002-07-12 Sold (Public Records) $25,000 Public Records
Property tax history
+3.5%/yrLatest (2025): $772 · +121.6% YoY. Source: county tax records.
Cash-flow waterfall
monthlySold comps — $/sqft
last 12 mo · ≤1 miLoading sold comps…