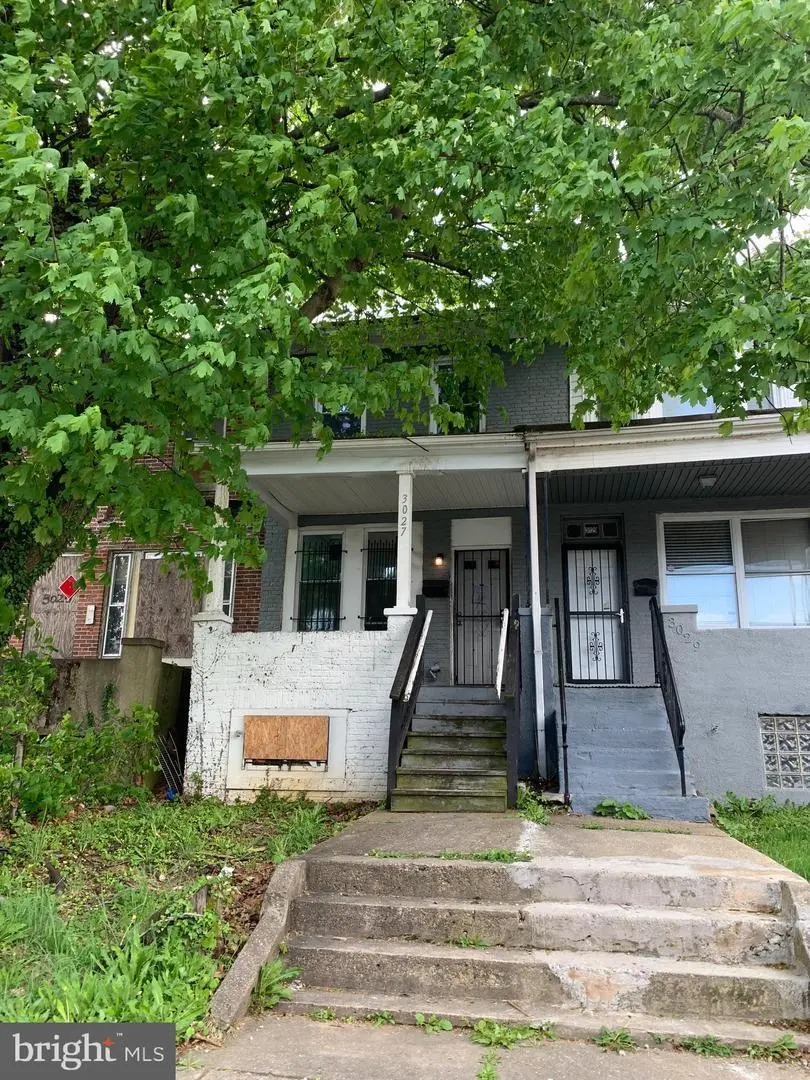
3027 Harlem Ave · Baltimore, MD
Flood risk 1/10 · Minimal
- FEMA flood zone
- X (unshaded)
- Chance of flooding over 30 yrs
- 0.0%
- Est. flood insurance / yr
- $473 – $860
Fire risk 1/10 · Minimal
- Est. fire insurance / yr
- $755 – $1,403
Heat risk 7/10 · Major
- Hot days now (above 103°F)
- 7 days/yr
- Hot days in 30 yrs
- 15 days/yr
Wind risk 6/10 · Moderate
- Chance of severe wind over 30 yrs
- 27.0%
Air-quality risk 3/10 · Minor
- Unhealthy air days now
- 3 days/yr
- Unhealthy air days in 30 yrs
- 4 days/yr
Risk factors via First Street. Map © Google.
Why this score? — see what drove the B- grade
The composite is a weighted blend of 9 inputs, each scored 0–100. Each bar is that input's sub-score; the figure is the points it added to the 100-point composite (weight × sub-score).
- Cash flow +30.0/30.0
- 1% rule +10.0/10.0
- DSCR +10.0/10.0
- ARV discount +4.0/15.0
- Rent growth +4.0/5.0
- Livability +3.8/5.0
- Condition / age +2.5/5.0
- Schools +1.0/10.0
- Appreciation +0.0/10.0
$60,000
🖨 Deal sheet (PDF) 📄 Offer letter ✓ Due diligence
Listing remarks
NOT AN AUCTION, NOT A SHORT SALE, NOT A BANK OWNED, NOT A FORECLOSURE, NOT WHOLESALING---QUICK AND EASY. Buyer to pay all transfer and recording fees Minimum $2,000 EMD. Excellent Opportunity . .. use your imagination! Property can be rehabbed for a nice rental investment or homeowner. Property sold "as is". Home Inspections for informational purposes only. Seller will make no repairs. . In addition, this property qualifies for a special 5.75% mortgage program—a rare financing opportunity that makes this high-quality home even more affordable. Ask Listing Agent for details.
Key facts
- Built 1920
- Listed 29 days
Property features AI
Finance
- Other: Annual ground rent listed under income/expense
- Financial info: Ownership interest: ground rent; Land assessed separately from improvements
Exterior
- Utilities: Public water; Public sewer
- Home design: Interior townhouse/rowhouse; Finished above-grade living area (912 finished area, per assessor)
- Construction: Brick/mortar foundation; Above-grade and below-grade structures; Year built sourced from assessor
- Exterior features: Not in a federal flood zone; Ground rent exists (semi-annual payment of $120); No tidal water
Interior
- Bedrooms: 2 bedrooms on the main level
- Bathrooms: 1 full bathroom on the main level
- Heating & cooling: Forced air heating; Hot water provided by electric system
- Interior features: Full basement
Neighborhood map
What this means for you Summary
Snapshot
- This is a 2-bed/1.0-bath townhouse listed at $60k.
Deal economics
- At list price, monthly cash flow is $628 ($8k/yr) — positive.
- The deal already cash-flows at list — no discount required.
- Meets the 1% rule at list price ($1k rent vs $60k).
- Recommended offer: $59k (1.5% below list) — sets the bar for market timing.
- Cap rate 18.9% vs local median 6.0% in Baltimore — top-decile yield for the area; either an underpriced asset or a hidden risk that comps aren't pricing in. Stress-test before assuming the spread holds.
Location & tenants
- Location reads 76/100 on livability (#90 in MD, #3,396 nationally) — a middle-class / working-renter tenant base. Strengths: amenities A+, commute A+, housing A+; Watch: crime F.
- Baltimore City Public Schools (urban): math 7% / reading 16% proficiency, ranked #24 of 24 in MD (top 100%) — low school quality limits family demand, transient renter base, plan for 1-2y turnover; 79% free/reduced lunch — lower-income household profile, screen leases tightly.
- Zoned schools: Elmer A. Henderson: A Johns Hopkins Partnership (math 2% / reading 16%, grade F, #650 of 860 statewide, top 77%, 642 students, 80% FRL); Baltimore Polytechnic Institute (math 71% / reading 84%, grade A-, #22 of 222 statewide, top 10%, 1,555 students, 43% FRL) — zoned schools average 62% FRL vs 79% district-wide (17 pts lower); this property's tenant base skews higher-income than the district average.
- Zoned-school proficiency averages 43% at this address vs 12% district-wide (+32 pts) — the actual schools serving this property are materially stronger than the Baltimore City Public Schools average implies; a family-tenant draw the district grade alone would hide.
- Market conditions: Rents rising fast (+6.1%/yr); 252 active listings in the ZIP; 40 comparable units currently listed for rent nearby; rentals at typical pace (median 25d on market — plan ~3-4 weeks tenant-placement turnaround); 40% of comp listings sitting > 30 days — soft ceiling on asking rent; lower-income renter base — watch delinquency; 1,273 units permitted in Baltimore city in 2024 (1,104 in 5+ unit buildings).
Forward outlook
- Local home prices are declining (-3.0%/yr); year-one equity from $415 of loan paydown is wiped out by about $2k of value loss. Plan a longer hold.
- Baltimore County population projected to shrink 4% by 2050 — rents likely to lag national; underwrite the cash flow, not the appreciation.
- At projected returns (-3.0% appreciation + 6.1% rent growth), your $17k cash investment doubles in ~3 years — after that, you're playing with house money.
Negotiation context
- It's been on market 29 days — a 2% lower offer ($59k) is reasonable based on typical stale-listing flexibility.
- 2 sale attempts since 8y ago with the ask held roughly flat each time — persistent listings suggest the price (not the market) is what's stuck; bring a comps-based counter.
Risks & watch-outs
- Watch-outs: property tax is 3.2% of price; built in 1920 — expect roof / HVAC / electrical / plumbing capex.
- Climate carrying-cost: major wind risk, 27% chance of damaging wind over 30y; extreme-heat days projected 7→15/yr by 2055 (HVAC capex compounding) — expect insurance premiums to compound above CPI over the hold.
Questions for the listing agent
- Built in 1920 — when were the roof, HVAC, electrical panel, plumbing, and water heater last replaced?
- Property tax is high relative to price — has the assessment been appealed recently, and will the sale trigger a re-assessment?
- Is there a deadline driving the sale (1031 exchange, divorce, estate, relocation)? That informs how much negotiation room exists.
- Schools are D-rated, which usually means shorter tenancies and higher turnover. Who's the typical renter profile here, and what's been the actual vacancy rate?
- Crime grade is F in this area — have there been break-ins, vandalism, or insurance claims at this property in the last 3 years? What carrier currently insures it and at what premium?
- What's the average days-on-market for RENTAL listings here right now (not sales)? A rising rental-DOM trend means longer vacancies and softer asking-rent achievability than the comps imply.
- What's the recent tenant-quality profile in this submarket — average credit score on applications, eviction rate, late-payment / NSF rate, and stable-employment percentage? A property-management company in the area should have these aggregated.
- How much new for-sale + rental construction is in the pipeline within 1–3 miles? Heavy new supply typically softens prices + rents 12–24 months out; constrained supply supports both.
Investment metrics
- 1% rule
- 2.38% ✓
- Cap rate
- 18.85%
- Cash-on-cash
- 44.86%
- DSCR
- 3.00
- GRM
- 3.5
CMA / ARV
- ARV (on-the-fly)
- $55,632
- Comps found
- 12
Show comp detail 12 sales within ~0.75 mi
| Address | Dist | Beds/Ba | Sqft | Sold | Price | $/sf | Match |
|---|---|---|---|---|---|---|---|
| 3005 Harlem Ave | 0.03mi | 2/2.0 | 912 (0%) | 3mo | $50,000 | $55 | 92 |
| 2863 W Lanvale St | 0.18mi | 2/1.0 | 864 (-5%) | 3mo | $56,000 | $65 | 80 |
| 910 N Dukeland St | 0.31mi | 2/1.0 | 960 (+5%) | 4mo | $31,000 | $32 | 73 |
| 3302 W Franklin St | 0.36mi | 3/1.0 (+1) | 960 (+5%) | 2mo | $50,000 | $52 | 68 |
| 2507 Riggs Ave | 0.63mi | 2/1.0 | 896 (-2%) | 4mo | $45,100 | $50 | 64 |
| 3306 W Franklin St | 0.36mi | 3/2.0 (+1) | 960 (+5%) | 2mo | $51,500 | $54 | 64 |
| 2534 W Franklin St | 0.56mi | 3/1.0 (+1) | 928 (+2%) | 5mo | $24,000 | $26 | 62 |
| 335 N Grantley St | 0.56mi | 2/2.0 | 840 (-8%) | 2mo | $85,000 | $101 | 55 |
| 2952 Presstman St | 0.63mi | 3/1.0 (+1) | 980 (+8%) | 1mo | $60,000 | $61 | 52 |
| 3315 Presstman St | 0.65mi | 2/1.0 | 988 (+8%) | 5mo | $110,000 | $111 | 52 |
| 119 Hilton St | 0.64mi | 2/2.0 | 1,040 (+14%) | 0mo | $211,000 | $203 | 43 |
| 23 N Morley St | 0.66mi | 3/1.0 (+1) | 1,041 (+14%) | 6mo | $85,000 | $82 | 36 |
Match score weights: distance 35% · size 25% · config 20% · recency 20%. Top-matched comps best support the ARV.
Projected returns pro-forma
-3.0% appreciation · 6.1% rent growth · sell at horizon
- IRR
- 45.7%
- Equity multiple
- 3.08×
- Total profit
- $34,936
- Equity at exit
- $8,946
- IRR
- 53.0%
- Equity multiple
- 7.09×
- Total profit
- $102,279
- Equity at exit
- $5,188
Cash invested: $16,800 (down + closing). Projections, not guarantees.
Landlord ↔ Tenant lean methodology
- Overall (CITY)
- 12 Strongly Tenant-Friendly
- State Maryland
- 27 Tenant-Leaning · D+14
- County
- — inherits STATE
- City Baltimore
- 12 Strongly Tenant-Friendly · D+58
ZIP-level market 21216
- Rents YoY
- 6.1%
- Active inventory
- 252
- Price-to-rent
- 3.5×
Monthly cashflow live
- Estimated rent
- $1,426 high interval (Pro) →
- Mortgage (P&I)
- −$315
- Tax from tax record
- −$159 /mo · $1,905/yr
- Insurance
- −$25
- HOA
- −$0
- Vacancy / Maint / Mgmt
- −$299
- Net cashflow
- $628
Break-even live
Sensitivity live
| Price | -10% $662 | -5% $645 | +0% $628 | +5% $611 | +10% $594 |
|---|---|---|---|---|---|
| Rent | -10% $515 | -5% $572 | +0% $628 | +5% $684 | +10% $741 |
| Rate | -1.0pp $658 | -0.5pp $643 | base $628 | +0.5pp $612 | +1.0pp $597 |
UW: 25.0% down · 7.5% · 30yr · 1.5% tax · 5.0% vac · 8.0% maint · 8.0% mgmt
Financing live
Cash to close
- Down payment
- $15,000
- Closing costs
- $1,800
- Reserves months
- —
- Total cash needed
- —
Loan-product check · same deal, 3 products live
Conventional
25% down · 7.5% · 30yr
- Down + closing
- —
- Monthly P&I
- —
- Monthly cashflow
- —
- DSCR
- —
- Eligible?
- —
Personal DTI + credit; lowest rate.
DSCR
20% down · 8.5% · 30yr
- Down + closing
- —
- Monthly P&I
- —
- Monthly cashflow
- —
- DSCR
- —
- Eligible?
- —
No personal income docs; deal must DSCR.
Hard money
10% down · 12.0% · 12mo
- Down + closing
- —
- Monthly P&I
- —
- Monthly cashflow
- —
- DSCR
- —
- Eligible?
- —
Short-term bridge; refi at stabilization.
Rent comps 40 comps
| Address | Beds | Baths | Sqft | Rent | $/sqft | DOM | Units | Dist |
|---|---|---|---|---|---|---|---|---|
| 709 Denison St Baltimore, MD | 2.0 | 2.0 | 840 | $1,630 | $1.94 | 25d | 1 | 0.30mi |
| 1042 Ellicott Dr Baltimore, MD | 2.0 | 1.0 | 900 | $1,450 | $1.61 | 45d | 1 | 0.31mi |
| 787 N Grantley St Baltimore, MD | 3.0 | 1.0 | 1116 | $1,575 | $1.41 | 25d | 1 | 0.40mi |
| 600 Linnard St Baltimore, MD | 1.0 | 1.0 | 600 | $1,300 | $2.17 | 45d | 1 | 0.48mi |
| 3607 W Lexington St Baltimore, MD | 3.0 | 2.0 | 1050 | $1,895 | $1.80 | 6d | 1 | 0.63mi |
| 3706 W Franklin St Unit 1 Baltimore, MD | 2.0 | 1.0 | 735 | $1,100 | $1.50 | 6d | 1 | 0.63mi |
| 3310 Elbert St Baltimore, MD | 2.0 | 1.0 | 920 | $1,550 | $1.68 | 25d | 1 | 0.67mi |
| 3127 Baker St Baltimore, MD | 3.0 | 1.0 | 1000 | $1,300 | $1.30 | 45d | 1 | 0.67mi |
| 2301 Riggs Ave Baltimore, MD | 3.0 | 2.0 | 1072 | $1,600 | $1.49 | 25d | 1 | 0.81mi |
| 2516 Hollins St Baltimore, MD | 3.0 | 2.0 | 1100 | $1,700 | $1.55 | 45d | 1 | 0.86mi |
| 3003 W North Ave Baltimore, MD | 1.0–2.0 | 1.0 | 841 | $935 | $1.11 | 3d | 3 | 0.88mi |
| 62 N Gorman Ave Baltimore, MD | 3.0 | 2.0 | 1100 | $2,500 | $2.27 | 19d | 1 | 0.90mi |
| 1307 Wildwood Pkwy Baltimore, MD | 2.0 | 1.0 | 725 | $1,295 | $1.79 | 45d | 1 | 0.90mi |
| 4103 Mountwood Rd Baltimore, MD | 3.0 | 2.0 | 1030 | $1,700 | $1.65 | 45d | 1 | 0.93mi |
| 4103 Stokes Dr Apt 1 Baltimore, MD | 2.0 | 1.0 | 725 | $1,095 | $1.51 | 45d | 1 | 0.98mi |
| 1216 N Augusta Ave Baltimore, MD | 3.0 | 1.0 | 1024 | $1,550 | $1.51 | 25d | 1 | 0.99mi |
| 1617 Moreland Ave Baltimore, MD | 2.0 | 1.0 | 900 | $1,450 | $1.61 | 25d | 1 | 1.00mi |
| 2636 W North Ave Baltimore, MD | 2.0–3.0 | 1.0–2.0 | 975 | $1,300 | $1.33 | 6d | 1 | 1.03mi |
| 332 S Franklintown Rd Unit 2 Baltimore, MD | 2.0 | 1.0 | 776 | $795 | $1.02 | 25d | 1 | 1.05mi |
| 2540 Frederick Ave Baltimore, MD | 3.0 | 1.0 | 1075 | $1,400 | $1.30 | 25d | 1 | 1.08mi |
| 3508 Clifton Ave Unit A1 Baltimore, MD | 1.0 | 1.0 | 600 | $899 | $1.50 | 4d | 1 | 1.15mi |
| 2826 Windsor Ave Unit A5 Baltimore, MD | 1.0 | 1.0 | 600 | $999 | $1.67 | 25d | 1 | 1.15mi |
| 3017 Poplar Ter Baltimore, MD | 2.0 | 1.0 | 880 | $1,349 | $1.53 | 25d | 1 | 1.15mi |
| 3514 Clifton Ave Baltimore, MD | 2.0 | 1.0 | 925 | $1,199 | $1.30 | 45d | 1 | 1.17mi |
| 3514 Clifton Ave Unit 21 Baltimore, MD | 2.0 | 1.0 | 925 | $1,150 | $1.24 | 45d | 1 | 1.17mi |
| 4018 Massachusetts Ave Baltimore, MD | 3.0 | 1.0 | 1050 | $1,400 | $1.33 | 25d | 1 | 1.18mi |
| 2657 Lehman St Unit 1 Baltimore, MD | 2.0 | 1.0 | 1056 | $1,000 | $0.95 | 45d | 1 | 1.21mi |
| 1918 W Baltimore St Baltimore, MD | 2.0–3.0 | 1.0–2.0 | 857 | $1,375 | $1.60 | 45d | 1 | 1.22mi |
| 3407 Elgin Ave Unit 5 Baltimore, MD | 2.0 | 1.0 | 800 | $1,250 | $1.56 | 45d | 1 | 1.22mi |
| 2 S Woodington Rd Baltimore, MD | 2.0 | 1.0 | 856 | $1,160 | $1.36 | 16d | 1 | 1.23mi |
| 2 S Woodington Rd Baltimore, MD | 1.0 | 1.0 | 620 | $1,310 | $2.11 | 45d | 1 | 1.23mi |
| 2 S Woodington Rd Baltimore, MD | 1.0 | 1.0 | 620 | $1,135 | $1.83 | 6d | 1 | 1.23mi |
| 2 N Woodington Rd Baltimore, MD | 1.0–2.0 | 1.0 | 738 | $1,335 | $1.81 | 4d | 5 | 1.23mi |
| 2210 Roslyn Ave Unit 8 Baltimore, MD | 1.0 | 1.0 | 600 | $975 | $1.62 | 4d | 1 | 1.28mi |
| 4215 Connecticut Ave Baltimore, MD | 1.0 | 1.0 | 625 | $950 | $1.52 | 25d | 1 | 1.29mi |
| 304 Collins Ave Unit 1 Baltimore, MD | 1.0 | 1.0 | 845 | $1,600 | $1.89 | 45d | 1 | 1.33mi |
| 304 Collins Ave Unit 2 Baltimore, MD | 3.0 | 1.0 | 1016 | $2,100 | $2.07 | 45d | 1 | 1.33mi |
| 4520 Scarlet Oak Ln Baltimore, MD | 2.0 | 1.0 | 1025 | $1,500 | $1.46 | 45d | 1 | 1.34mi |
| 1722 N Monroe St Baltimore, MD | 3.0 | 1.5 | 1000 | $1,350 | $1.35 | 25d | 1 | 1.36mi |
| 1930 N Payson St Baltimore, MD | 2.0 | 2.0 | 980 | $1,500 | $1.53 | 25d | 1 | 1.39mi |
Listing history 19 events
-
2026-06-21days on market $60,000 Active 29 DOM
-
2026-06-18days on market $60,000 Active 26 DOM
-
2026-06-17days on market $60,000 Active 25 DOM
-
2026-06-16days on market $60,000 Active 24 DOM
-
2026-06-15days on market $60,000 Active 23 DOM
-
2026-06-13days on market $60,000 Active 21 DOM
-
2026-06-09days on market $60,000 Active 17 DOM
-
2026-06-08days on market $60,000 Active 16 DOM
-
2026-06-07days on market $60,000 Active 15 DOM
-
2026-06-04days on market $60,000 Active 12 DOM
-
2026-06-03days on market $60,000 Active 11 DOM
-
2026-06-02days on market $60,000 Active 10 DOM
-
2026-06-01days on market $60,000 Active 9 DOM
-
2026-05-31days on market $60,000 Active 8 DOM
-
2026-05-23$60,000 Active
-
2018-11-15soldstatus $355,000
-
2018-11-02soldstatus $6,500
-
2018-11-02$6,500
-
1990-12-03soldstatus $10,500
ⓘ Source: listings_history table (triggers on properties + properties_extension) + one-shot
backfill from property_details.listing_events for pre-trigger history.
Tax reassessment forecast MD · Partial reset (capped growth)
- Current annual tax
- $1,905 · $159/mo
- Projected year-2 tax
- $1,905 · $159/mo
- Expected delta
- $0/yr ($0/mo · -0.0%)
ⓘ Screening estimate from a state-policy table — verify with the county assessor before closing.
Climate risk First Street
- Flood 1/10 Low FEMA zone X (unshaded) · 0% chance over 30 yrs
- Wildfire 1/10 Low
- Heat 7/10 Severe 7 d/yr ≥103°F today · 15 d/yr by 30 yrs out
- Wind 6/10 Major 27% chance of damaging wind over 30 yrs
- Air quality 3/10 Moderate 3 unhealthy d/yr today · 4 by 30 yrs out
Nearby sold comps map
Loading sold comps map…
Walkable amenities ~0.75 mi
Loading nearby amenities…
Taxation est. · year 1
- Rental income
- $17,110
- − Mortgage interest
- −$3,361
- − Property taxes
- −$1,905
- − Insurance
- −$300
- − Repairs & maintenance
- −$1,369
- − Management
- −$1,369
- − Depreciation
- −$1,745
- Taxable income
- $7,061
- Est. tax owed @ 24.0%
- −$1,695
- After-tax cash flow
- $5,842/yr
For passive investors: Depreciation is non-cash, so a rental often shows a tax loss while cash-flowing — sheltering income. Rental losses are passive: they offset passive income freely, and up to $25,000/yr can offset ordinary (W-2) income if you actively participate and your MAGI is under $100k (phasing out to $0 by $150k); unused losses carry forward. On sale, claimed depreciation is recaptured at up to 25%, and gains may owe capital-gains tax (a 1031 exchange can defer both). Figures are a year-1 estimate at your 24.0% rate — not tax advice; consult a CPA.
Schools (NCES district)
- District
- Baltimore City Public Schools
- NCES district ID
- 2400090
- Math proficiency
- 7% ▼ -9.00%
- Reading proficiency
- 16% ▼ -5.00%
- Median HH income
- $42,108
- Composite
- 10.08/100
- National rank
- #9805
- State rank
- #24 of 24 in MD
Livability — Baltimore
- Score
- 76/100
- State rank
- #90
- US rank
- #3396
Category grades
Schools grade is shown separately in the Schools card above.
Census & demographics
- Census place
- Baltimore, MD
- County
- Baltimore City · 558,601 people
- City population
- 588,727
- Metro
- Baltimore-Columbia-Towson, MD
- Population (ZIP)
- 29,426
- Household income
- $42,031
- Rent vs Own
- Severe rent burden
- 2264.0
Population outlook (Baltimore County) Hauer SSP2
- Today (2025)
- 624,249 people
- By 2030
- 621,541 · -0.4%
- By 2040
- 609,756 · -2.3%
- By 2050
- 597,249 · -4.3%
- By 2075
- 552,236 · -11.5%
- By 2100
- 513,934 · -17.7%
Race, ethnicity, and origin ACS 2023
- Neighborhood character
- Predominantly Black (91%)
- Race & ethnicity
- Black 91% Hispanic / Latino 4% Two or more races 3% White 2%
- Foreign-born
- 3% · Canada
- Languages at home
- 96% English-only · Spanish 3% French/Haitian/Cajun 1%
Political lean MEDSL · Baltimore
- 2024 margin
- Solid D (+73.0) · D 85.2% · R 12.2% · Other 2.6%
- 2008→2024 swing
- -2.5pp toward R · 2008: 75.5pp · 2024: 73.0pp
- All cycles
- 2024: D+73.0 2020: D+76.6 2016: D+74.6 2012: D+76.4 2008: D+75.5
Not yet ingested
- Civics
- —
Market trends
- HPI YoY
- ▼ -107.42%
- Current HPI
- 164.3933
- Rent YoY
- ▲ 6.10%
- Metro
- Baltimore-Columbia-Towson, MD
- State GDP YoY
- ▲ 2.97%
- F500 in state
- 12
Industry mix (Fortune 500 HQ in MD)
| Industry | F500 HQs | Revenue |
|---|---|---|
| Aerospace / Defense | 1 | $71B |
|
||
| Utilities | 1 | $25B |
|
||
| Hotels | 1 | $24B |
|
||
| Consumer Goods | 1 | $7B |
|
||
| Real Estate | 1 | $6B |
|
||
| Chemicals | 1 | $2B |
|
||
Price history
+471.4% since first listed5 events — show timeline
- 2026-05-23 Listed $60,000 BRIGHT MLS
- 2018-11-15 Sold (Public Records) $355,000 Public Records
- 2018-11-02 Listed $6,500 BRIGHT MLS
- 2018-11-02 Sold (MLS) $6,500 BRIGHT MLS
- 1990-12-03 Sold (Public Records) $10,500 Public Records
Property tax history
+5.6%/yrLatest (2025): $1,905 · +12.2% YoY. Source: county tax records.
Cash-flow waterfall
monthlySold comps — $/sqft
last 12 mo · ≤1 miLoading sold comps…