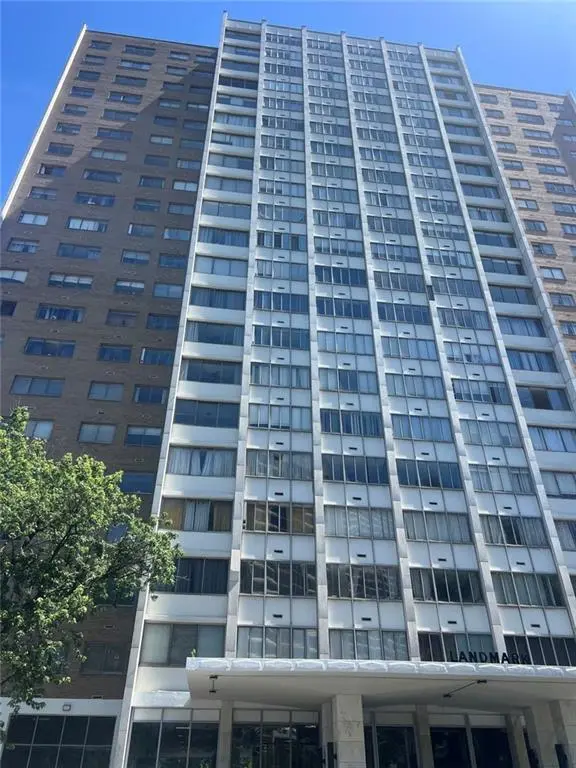
215 Piedmont Ave NE #1906 · Atlanta, GA
Flood risk No data
- FEMA flood zone
- —
- Chance of flooding over 30 yrs
- —
- Est. flood insurance / yr
- —
Fire risk No data
- Est. fire insurance / yr
- —
Heat risk No data
- Hot days now (above threshold)
- —
- Hot days in 30 yrs
- —
Wind risk No data
- Chance of severe wind over 30 yrs
- —
Air-quality risk No data
- Unhealthy air days now
- —
- Unhealthy air days in 30 yrs
- —
Risk factors via First Street. Map © Google.
Why this score? — see what drove the D grade
The composite is a weighted blend of 9 inputs, each scored 0–100. Each bar is that input's sub-score; the figure is the points it added to the 100-point composite (weight × sub-score).
- Cash flow +10.8/30.0
- 1% rule +10.0/10.0
- ARV discount +7.5/15.0
- Livability +4.2/5.0
- DSCR +3.1/10.0
- Rent growth +2.8/5.0
- Schools +2.7/10.0
- Condition / age +2.5/5.0
- Appreciation +0.0/10.0
$150,000
🖨 Deal sheet 📄 Offer letter ✓ Due diligence
Listing remarks MLS
Downtown Atlanta location near I-75/I-85 Great area in the heart of Atlanta. Conveniently located in the center of it all. A must-see to truly appreciate. All units in this building ending in 6 feature an interior sunroom. Property sold as-is.
Key facts
- Interior sunroom
- 2 parking spots
- Built 1963
Tags
Property features AI
Finance
- Financial info: Part of a one-unit community (single unit in building)
- HOA & community: Has association; Association amenities include cable TV, electricity, gas, grounds maintenance, pest control, security, swimming, tennis, and water
Exterior
- Parking: On-street parking (open); 2 total parking spaces
- Security: Association provides security
- Utilities: Public water; Public sewer; Electricity available; Water available; Sewer available
- Home design: Condominium; One level
- Construction: Stone construction; Other roof
- Exterior features: Other exterior features; City street frontage; Paved road access
Interior
- Kitchen: Walk-in pantry; Solid surface countertops
- Bedrooms: 2 main-level bedrooms
- Flooring: Other flooring
- Bathrooms: 2 full bathrooms; Master bathroom with separate tub and shower
- Heating & cooling: Forced air heating; Central air conditioning
- Interior features: Two or more common walls (attached unit); Other interior features
- Laundry & utility: Laundry features: other
Neighborhood map
What this means for you Summary
Snapshot
- This is a 2-bed/2.0-bath condo listed at $150k.
Deal economics
- At list price, monthly cash flow is $-70 ($-837/yr) — negative.
- The deal already cash-flows at list — no discount required.
- Meets the 1% rule at list price ($2k rent vs $150k).
- Cap rate 5.7% vs local median 3.1% in Atlanta — top-decile yield for the area; either an underpriced asset or a hidden risk that comps aren't pricing in. Stress-test before assuming the spread holds.
Location & tenants
- Location reads 83/100 on livability (#6 in GA, #919 nationally) — a professional / high-income tenant draw. Strengths: amenities A+, commute A+, housing A+; Watch: cost of living C-.
- Atlanta Public Schools (urban): math 28% / reading 35% proficiency, ranked #80 of 174 in GA (top 46%) — families likely to look elsewhere, expect single-tenant / working-renter base with shorter leases; 71% free/reduced lunch — lower-income household profile, screen leases tightly.
- Zoned schools: Centennial Place Academy (Charter) (math 12% / reading 12%, grade F, #1,041 of 1,228 statewide, top 87%, 804 students, 100% FRL, charter); Midtown High School (math 22% / reading 34%, grade F, #151 of 424 statewide, top 36%, 1,602 students, 19% FRL).
- Market conditions: Rents rising (+1.1%/yr); 317 active listings in the ZIP; 40 comparable units currently listed for rent nearby; rentals at typical pace (median 15d on market — plan ~3-4 weeks tenant-placement turnaround); solid renter incomes; 11,565 units permitted in Fulton County in 2024 (8,159 in 5+ unit buildings).
- This rent runs 33% of the median local income ($86k/yr) — at the standard rent-burdened threshold; future hikes will face affordability resistance.
Forward outlook
- Local home prices are declining (-3.0%/yr); year-one equity from $1k of loan paydown is wiped out by about $4k of value loss. Plan a longer hold.
- Fulton County population projected at +38% by 2050 — long-run rental-demand tailwind backs the buy-and-hold thesis.
Negotiation context
- Only 7 days on market — expect competitive offers; lowballing is unlikely to land.
- 2 sale attempts with the ask held roughly flat each time — persistent listings suggest the price (not the market) is what's stuck; bring a comps-based counter.
- Current owner paid $64k; list at $150k implies a 134% gain — meaningful room to come down on a strong offer.
Risks & watch-outs
- Watch-outs: HOA is 38% of rent.
Questions for the listing agent
- What do current leases actually rent for vs. the listed asking? Can we see a recent rent roll and the last 12 months of T-12 income?
- Built in 1963 — when were the roof, HVAC, electrical panel, plumbing, and water heater last replaced?
- What does the HOA fee cover, when was the last increase, and are there any pending special assessments or reserve-fund shortfalls?
- Any open or pending special assessments — roof, HVAC, plumbing, elevator, façade? What's the per-unit balance and payoff schedule, and is the seller paying it off at close or rolling it to the buyer?
- Is there a deadline driving the sale (1031 exchange, divorce, estate, relocation)? That informs how much negotiation room exists.
- The area grade is low — what's the realistic commute time and amenity access for the typical tenant pool here? Any planned neighborhood developments (good or bad) we should know about?
- What's the average days-on-market for RENTAL listings here right now (not sales)? A rising rental-DOM trend means longer vacancies and softer asking-rent achievability than the comps imply.
- What's the recent tenant-quality profile in this submarket — average credit score on applications, eviction rate, late-payment / NSF rate, and stable-employment percentage? A property-management company in the area should have these aggregated.
- How much new apartment / multifamily construction is in the pipeline within 1–3 miles? Heavy new supply (>2% of stock underway) typically softens rents 12–24 months out; light construction supports rent growth.
Investment metrics
- 1% rule
- 1.55% ✓
- Cap rate
- 5.74%
- Cash-on-cash
- -1.99%
- DSCR
- 0.91
- GRM
- 5.4
CMA / ARV
No comps found within radius.
Projected returns pro-forma
-3.0% appreciation · 1.12% rent growth · sell at horizon
- IRR
- -23.2%
- Equity multiple
- 0.23×
- Total profit
- $-32,502
- Equity at exit
- $22,365
- IRR
- -30.1%
- Equity multiple
- -0.16×
- Total profit
- $-48,792
- Equity at exit
- $12,969
Cash invested: $42,000 (down + closing). Projections, not guarantees.
Landlord ↔ Tenant lean methodology
- Overall (STATE)
- 90 Strongly Landlord-Friendly
- State Georgia
- 90 Strongly Landlord-Friendly · R+3
- County
- — inherits STATE
- City
- — inherits STATE
ZIP-level market 30308
- Rents YoY
- 1.1%
- Active inventory
- 317
- Price-to-rent
- 5.4×
Monthly cashflow live
- Estimated rent
- $2,330 high interval (Pro) →
- Mortgage (P&I)
- −$787
- Tax est. 1.5%
- −$188 /mo · $2,250/yr
- Insurance
- −$62
- HOA est. from 5 same-building comps
- −$874
- Vacancy / Maint / Mgmt
- −$489
- Net cashflow
- $-70
Break-even live
UW: 25.0% down · 7.5% · 30yr · 1.5% tax · 5.0% vac · 8.0% maint · 8.0% mgmt
Financing live
Cash to close
- Down payment
- $37,500
- Closing costs
- $4,500
- Reserves months
- —
- Total cash needed
- —
Loan-product check · same deal, 3 products live
Conventional
25% down · 7.5% · 30yr
- Down + closing
- —
- Monthly P&I
- —
- Monthly cashflow
- —
- DSCR
- —
- Eligible?
- —
Personal DTI + credit; lowest rate.
DSCR
20% down · 8.5% · 30yr
- Down + closing
- —
- Monthly P&I
- —
- Monthly cashflow
- —
- DSCR
- —
- Eligible?
- —
No personal income docs; deal must DSCR.
Hard money
10% down · 12.0% · 12mo
- Down + closing
- —
- Monthly P&I
- —
- Monthly cashflow
- —
- DSCR
- —
- Eligible?
- —
Short-term bridge; refi at stabilization.
Rent comps 40 comps
| Address | Beds | Baths | Sqft | Rent | $/sqft | DOM | Units | Dist |
|---|---|---|---|---|---|---|---|---|
| 215 Piedmont Ave NE Atlanta, GA | 2.0–3.0 | 1.0–2.0 | 1053 | $1,930 | $1.83 | 10d | 3 | 0.02mi |
| 215 Piedmont Ave NE Atlanta, GA | 2.0–3.0 | 1.0–2.0 | 1053 | $1,845 | $1.75 | 4d | 3 | 0.02mi |
| 250 Piedmont Ave NE Atlanta, GA | 1.0–2.0 | 1.0–2.0 | 1110 | $2,536 | $2.28 | 2d | 20 | 0.11mi |
| 161 Peachtree Center Ave NE Unit 2x2 Penthouse Atlanta, GA | 2.0 | 2.0 | 1110 | $3,393 | $3.06 | 15d | 1 | 0.19mi |
| 161 Peachtree Center Ave NE Unit 2X2 Atlanta, GA | 2.0 | 2.0 | 1141 | $2,773 | $2.43 | 15d | 1 | 0.19mi |
| 161 Peachtree Center Ave NE Atlanta, GA | 3.0 | 1.0–3.5 | 1474 | $4,371 | $2.96 | 1d | 27 | 0.23mi |
| 131 Ralph McGill Blvd NE Atlanta, GA | 2.0 | 1.0 | 1350 | $1,495 | $1.11 | 20d | 1 | 0.28mi |
| 131 Ralph McGill Blvd NE Atlanta, GA | 1.0 | 1.0 | 1000 | $1,472 | $1.47 | 16d | 2 | 0.28mi |
| 131 Ralph McGill Blvd NE Atlanta, GA | 1.0 | 1.0 | 1000 | $1,472 | $1.47 | 20d | 2 | 0.28mi |
| 131 Ralph McGill Blvd NE Atlanta, GA | 1.0 | 1.0 | 1000 | $1,450 | $1.45 | 15d | 1 | 0.28mi |
| 131 Ralph McGill Blvd NE Atlanta, GA | 1.0 | 1.0 | 1000 | $1,472 | $1.47 | 22d | 2 | 0.28mi |
| Mc Gill Park Ave #405 Atlanta, GA | 2.0 | 2.0 | 1458 | $3,000 | $2.06 | 24d | 1 | 0.30mi |
| 171 Auburn Ave NE Atlanta, GA | 1.0–2.0 | 1.0–2.0 | 1080 | $2,195 | $2.03 | 1d | 34 | 0.32mi |
| 125 McGill Park Ave NE Atlanta, GA | 1.0 | 1.0 | 1000 | $2,100 | $2.10 | 18d | 1 | 0.34mi |
| 375 Highland Ave NE #606 Atlanta, GA | 2.0 | 2.5 | 1478 | $2,800 | $1.89 | 24d | 1 | 0.39mi |
| 400 Central Park Pl NE Atlanta, GA | 3.0 | 1.0–2.0 | 1013 | $2,469 | $2.44 | 1d | 19 | 0.41mi |
| 375 Ralph McGill Blvd NE Atlanta, GA | 2.0 | 1.0 | 1015 | $1,968 | $1.94 | 24d | 2 | 0.44mi |
| 375 Ralph McGill Blvd NE #1305 Atlanta, GA | 2.0 | 1.0 | 1080 | $1,975 | $1.83 | 14d | 1 | 0.44mi |
| 450 Piedmont Ave NE Atlanta, GA | 1.0–2.0 | 1.0–2.0 | 975 | $2,646 | $2.71 | 1d | 12 | 0.47mi |
| 123 Luckie St NW #1503 Atlanta, GA | 2.0 | 2.0 | 1488 | $3,800 | $2.55 | 24d | 1 | 0.49mi |
| 384 Ralph McGill Blvd NE #410 Atlanta, GA | 3.0 | 3.0 | 1444 | $3,400 | $2.35 | 18d | 1 | 0.50mi |
| 400 W Peachtree St NW #3511 Atlanta, GA | 2.0 | 2.0 | 1075 | $2,950 | $2.74 | 24d | 1 | 0.51mi |
| 400 W Peachtree St NW #1412 Atlanta, GA | 1.0 | 1.0 | 952 | $1,995 | $2.10 | 24d | 1 | 0.51mi |
| 400 W Peachtree St NW #711 Atlanta, GA | 2.0 | 2.0 | 1075 | $2,750 | $2.56 | 24d | 1 | 0.51mi |
| 400 W Peachtree St NW #2504 Atlanta, GA | 2.0 | 2.0 | 1127 | $2,400 | $2.13 | 24d | 1 | 0.51mi |
| 50 Peachtree St NW Atlanta, GA | 1.0 | 1.0 | 817 | $1,422 | $1.74 | 5d | 6 | 0.53mi |
| 45 Ivan Allen Jr Blvd NW #2506 Atlanta, GA | 2.0 | 2.0 | 1587 | $5,750 | $3.62 | 15d | 1 | 0.54mi |
| 433 Highland Ave NE Atlanta, GA | 1.0–2.0 | 1.0–2.0 | 885 | $1,697 | $1.92 | 1d | 13 | 0.55mi |
| 305 Centennial Olympic Park Dr NW Atlanta, GA | 2.0 | 1.0–2.0 | 916 | $2,665 | $2.91 | 1d | 38 | 0.57mi |
| 170 NE BLVD Unit 208E Atlanta, GA | 1.0 | 1.0 | 1290 | $4,000 | $3.10 | 2d | 1 | 0.58mi |
| 32 Peachtree St NW Atlanta, GA | 1.0–2.0 | 1.0–2.0 | 772 | $1,775 | $2.30 | 11d | 1 | 0.58mi |
| 505 Courtland St NE Atlanta, GA | 3.0 | 1.0–2.0 | 982 | $2,942 | $2.99 | 1d | 26 | 0.59mi |
| 20 Marietta St NW Atlanta, GA | 2.0 | 2.0 | 1156 | $1,650 | $1.43 | 22d | 1 | 0.62mi |
| 530 Piedmont Ave NE Atlanta, GA | 1.0–2.0 | 1.0–2.0 | 1034 | $2,372 | $2.29 | 2d | 12 | 0.64mi |
| 369 Centennial Olympic Park Dr NW Atlanta, GA | 2.0 | 1.0–2.0 | 1007 | $2,875 | $2.85 | 3d | 24 | 0.65mi |
| 419 Chamberlain St SE Atlanta, GA | 2.0 | 1.0 | 1050 | $1,433 | $1.36 | 7d | 2 | 0.65mi |
| 419 Parkway Dr NE Atlanta, GA | 2.0 | 2.0 | 1300 | $2,125 | $1.63 | 24d | 1 | 0.65mi |
| 486 Old Wheat St NE Unit C Atlanta, GA | 2.0 | 1.0 | 1386 | $2,500 | $1.80 | 24d | 1 | 0.65mi |
| 357 Auburn Pointe Dr SE Atlanta, GA | 1.0–2.0 | 1.0–2.0 | 917 | $1,644 | $1.79 | 1d | 8 | 0.66mi |
| 220 Renaissance Pkwy NE #2111 Atlanta, GA | 1.0 | 1.0 | 881 | $1,900 | $2.16 | 7d | 1 | 0.66mi |
HOA detail condo
- Monthly dues
- $0 · $0/yr
- Assessments
- None detected in remarks — confirm with the listing agent.
Listing history 7 events
-
2026-06-18days on market $150,000 Active 7 DOM
-
2026-06-17days on market $150,000 Active 6 DOM
-
2026-06-16days on market $150,000 Active 5 DOM
-
2026-06-15days on market $150,000 Active 4 DOM
-
2026-06-13days on market $150,000 Active 2 DOM
-
2026-06-13remarks 243-char remark
-
2026-06-13$150,000 Active 1 DOM
ⓘ Source: listings_history table (triggers on properties + properties_extension) + one-shot
backfill from property_details.listing_events for pre-trigger history.
Nearby sold comps map
Loading sold comps map…
Walkable amenities ~0.75 mi
Loading nearby amenities…
Taxation est. · year 1
- Rental income
- $27,963
- − Mortgage interest
- −$8,402
- − Property taxes
- −$2,250
- − Insurance
- −$750
- − Repairs & maintenance
- −$2,237
- − Management
- −$2,237
- − HOA
- −$10,488
- − Depreciation
- −$4,364
- Taxable loss
- −$2,765
- Est. tax savings @ 24.0%
- +$664
- After-tax cash flow
- $-173/yr
For passive investors: Depreciation is non-cash, so a rental often shows a tax loss while cash-flowing — sheltering income. Rental losses are passive: they offset passive income freely, and up to $25,000/yr can offset ordinary (W-2) income if you actively participate and your MAGI is under $100k (phasing out to $0 by $150k); unused losses carry forward. On sale, claimed depreciation is recaptured at up to 25%, and gains may owe capital-gains tax (a 1031 exchange can defer both). Figures are a year-1 estimate at your 24.0% rate — not tax advice; consult a CPA.
Schools (NCES district)
- District
- Atlanta Public Schools
- NCES district ID
- 1300120
- Math proficiency
- 28% ▼ -6.00%
- Reading proficiency
- 35% ▼ -2.00%
- Median HH income
- $48,306
- Composite
- 27.27/100
- National rank
- #7006
- State rank
- #80 of 174 in GA
Livability — Atlanta
- Score
- 83/100
- State rank
- #6
- US rank
- #919
Category grades
Schools grade is shown separately in the Schools card above.
Census & demographics
- Census place
- Atlanta, GA
- County
- Fulton County · 1,094,430 people
- City population
- 629,525
- Metro
- Atlanta-Sandy Springs-Alpharetta, GA
- Population (ZIP)
- 23,181
- Household income
- $85,693
- Rent vs Own
- Severe rent burden
- 2306.0
Population outlook (Fulton County) Hauer SSP2
- Today (2025)
- 1,203,707 people
- By 2030
- 1,299,706 · +8.0%
- By 2040
- 1,488,256 · +23.6%
- By 2050
- 1,664,580 · +38.3%
- By 2075
- 2,036,072 · +69.2%
- By 2100
- 2,222,402 · +84.6%
Race, ethnicity, and origin ACS 2023
- Neighborhood character
- Diverse neighborhood (Simpson 0.64)
- Race & ethnicity
- White 53% Black 26% Two or more races 10% Hispanic / Latino 7% Asian 7%
- Hispanic origin (detail)
- Mexican 1% Puerto Rican 2%
- Common ancestry
- Italian 4% Romanian 3% Lithuanian 2%
- Foreign-born
- 12% · Canada, South Korea, China
- Languages at home
- 85% English-only · Spanish 6% Other Indo-European 2% Other Asian/Pacific 2%
Political lean MEDSL · Fulton
- 2024 margin
- Solid D (+44.9) · D 71.9% · R 27.0% · Other 1.1%
- 2008→2024 swing
- +9.8pp toward D · 2008: 35.0pp · 2024: 44.9pp
- All cycles
- 2024: D+44.9 2020: D+46.4 2016: D+42.1 2012: D+29.6 2008: D+35.0
Not yet ingested
- Civics
- —
Market trends
- HPI YoY
- ▼ -293.30%
- Current HPI
- 159.9963
- Rent YoY
- ▲ 1.12%
- Metro
- Atlanta-Sandy Springs-Alpharetta, GA
- State GDP YoY
- ▲ 2.66%
- F500 in state
- 28
Industry mix (Fortune 500 HQ in GA)
| Industry | F500 HQs | Revenue |
|---|---|---|
| Paper / Packaging | 2 | $29B |
|
||
| Retail | 1 | $160B |
|
||
| Transportation / Logistics | 1 | $91B |
|
||
| Airlines | 1 | $62B |
|
||
| Consumer Goods | 1 | $47B |
|
||
| Utilities | 1 | $25B |
|
||
Price history
+134.4% since first listed6 events — show timeline
- 2026-06-11 Listed $150,000 FMLS
- 2026-06-11 Listed $150,000 GAMLS
- 2026-06-10 Coming Soon $150,000 GAMLS
- 2026-06-10 Coming Soon $150,000 FMLS
- 1986-11-17 Sold (Public Records) $64,000 Public Records
- 1986-11-17 Sold (Public Records) $64,000 Public Records
Property tax history
-13.3%/yrLatest (2025): $59 · -80.8% YoY. Source: county tax records.
Cash-flow waterfall
monthlySold comps — $/sqft
last 12 mo · ≤1 miLoading sold comps…