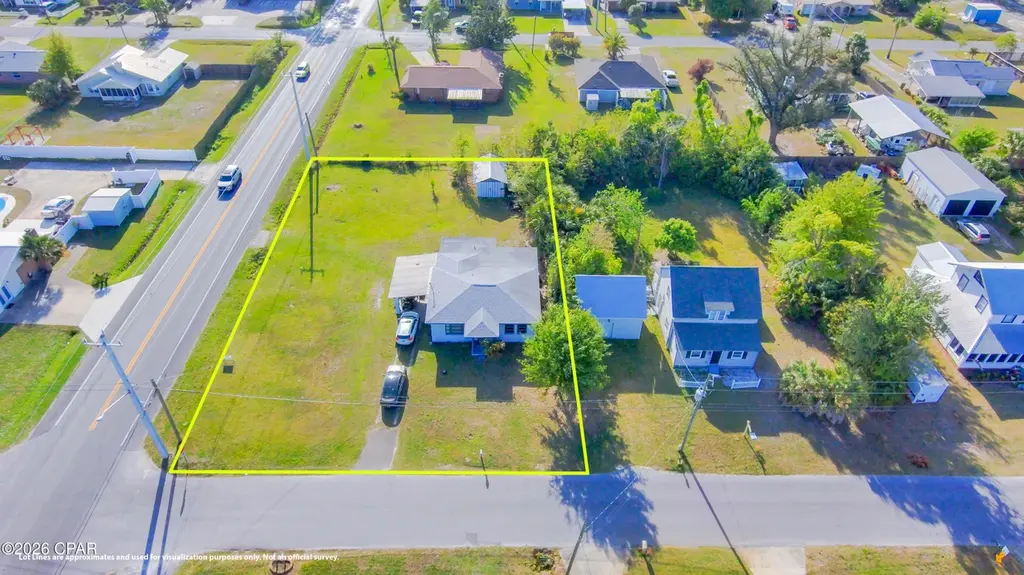
1118 Michigan Ave · Lynn Haven, FL
Flood risk 4/10 · Minor
- FEMA flood zone
- X (unshaded)
- Chance of flooding over 30 yrs
- 0.13%
- Est. flood insurance / yr
- $507 – $1,088
Fire risk 1/10 · Minimal
- Est. fire insurance / yr
- $947 – $1,759
Heat risk 10/10 · Severe
- Hot days now (above 104°F)
- 7 days/yr
- Hot days in 30 yrs
- 21 days/yr
Wind risk 9/10 · Severe
- Chance of severe wind over 30 yrs
- 99.0%
Air-quality risk 1/10 · Minimal
- Unhealthy air days now
- 0 days/yr
- Unhealthy air days in 30 yrs
- 0 days/yr
Risk factors via First Street. Map © Google.
Why this score? — see what drove the B+ grade
The composite is a weighted blend of 9 inputs, each scored 0–100. Each bar is that input's sub-score; the figure is the points it added to the 100-point composite (weight × sub-score).
- Cash flow +29.3/30.0
- ARV discount +15.0/15.0
- DSCR +10.0/10.0
- 1% rule +7.2/10.0
- Schools +4.3/10.0
- Livability +4.0/5.0
- Rent growth +3.1/5.0
- Condition / age +2.5/5.0
- Appreciation +0.0/10.0
$149,900
🖨 Deal sheet 📄 Offer letter ✓ Due diligence
Listing remarks MLS
CASH OR HARD MONEY ONLY | BEST FLIP INVESTMENT OPPORTUNITY IN LYNN HAVEN! Due to the home's current condition, traditional financing will not be considered. Property is being sold strictly AS-IS; seller will make no repairs or concessions. Recently reduced to $169,000, this property is priced aggressively for a quick sale and offers excellent potential for investors or buyers seeking a value-add opportunity. Located in a desirable golf-cart-friendly Lynn Haven neighborhood, this property sits on a 0.34-acre corner lot, providing strong upside for renovation or redevelopment. The existing 1,336 sq ft, 3BR/2BA home (1955) offers a solid footprint ready for transformation. Whether renovating or building new, the lot size and location make this a standout opportunity. Convenient to North Bay, Deer Point Lake boat ramps, parks, Panama Country Club, and just 20 minutes to the Gulf beaches. Property condition may limit financing and certain inspections. A full inspection report is available upon request for serious buyers. Showings by appointment only; do not disturb occupants. Buyer to conduct all due diligence and verify all information. Measurements approximate.
Key facts
- 0.34 acre lot
- Parking
- Built 1955
Neighborhood map
What this means for you Summary
Snapshot
- This is a 3-bed/2.0-bath single-family listed at $150k.
Deal economics
- At list price, monthly cash flow is $525 ($6k/yr) — positive.
- The deal already cash-flows at list — no discount required.
- Meets the 1% rule at list price ($2k rent vs $150k).
- Recommended offer: $136k (9.0% below list) — sets the bar for market timing.
- Cap rate 10.5% vs local median 3.5% in Lynn Haven — top-decile yield for the area; either an underpriced asset or a hidden risk that comps aren't pricing in. Stress-test before assuming the spread holds.
Location & tenants
- Location reads 81/100 on livability (#96 in FL, #1,472 nationally) — a professional / high-income tenant draw. Strengths: crime A+, housing A+, health & safety A+; Watch: amenities D+, commute F.
- Bay (suburban): math 51% / reading 51% proficiency, ranked #29 of 73 in FL (top 40%) — acceptable for families but not a draw, mixed tenant base, ~2y average lease.
- Market conditions: Rents rising (+2.5%/yr); 196 active listings in the ZIP; 3 comparable units currently listed for rent nearby; rentals leasing fast (median 13d on market — plan ~1-2 weeks tenant-placement turnaround); solid renter incomes; 2,473 units permitted in Bay County in 2024 (559 in 5+ unit buildings).
Forward outlook
- Local home prices are declining (-3.0%/yr); year-one equity from $1k of loan paydown is wiped out by about $4k of value loss. Plan a longer hold.
- Bay County population projected at +24% by 2050 — long-run rental-demand tailwind backs the buy-and-hold thesis.
- At projected returns (-3.0% appreciation + 2.5% rent growth), your $42k cash investment doubles in ~9 years — after that, you're playing with house money.
Negotiation context
- It's been on market 95 days — a 9% lower offer ($136k) is reasonable based on typical stale-listing flexibility.
Risks & watch-outs
- Watch-outs: built in 1955 — expect roof / HVAC / electrical / plumbing capex.
- Climate carrying-cost: severe wind risk, 99% chance of damaging wind over 30y; extreme-heat days projected 7→21/yr by 2055 (HVAC capex compounding) — expect insurance premiums to compound above CPI over the hold.
Questions for the listing agent
- It's been on market 95 days. Have you received any prior offers? Is the seller open to a 9% concession, seller financing, or rate buy-down credit?
- Built in 1955 — when were the roof, HVAC, electrical panel, plumbing, and water heater last replaced?
- Why hasn't it sold? Are there any deal-killer items the seller is aware of (foundation, flood, title, zoning, code violations)?
- Is there a deadline driving the sale (1031 exchange, divorce, estate, relocation)? That informs how much negotiation room exists.
- Schools are B-rated — typically a magnet for longer-tenancy family renters. What's the average tenant stay here, and is there a school-zone premium baked into asking?
- What's the average days-on-market for RENTAL listings here right now (not sales)? A rising rental-DOM trend means longer vacancies and softer asking-rent achievability than the comps imply.
- What's the recent tenant-quality profile in this submarket — average credit score on applications, eviction rate, late-payment / NSF rate, and stable-employment percentage? A property-management company in the area should have these aggregated.
- How much new for-sale + rental construction is in the pipeline within 1–3 miles? Heavy new supply typically softens prices + rents 12–24 months out; constrained supply supports both.
Investment metrics
- 1% rule
- 1.22% ✓
- Cap rate
- 10.50%
- Cash-on-cash
- 15.01%
- DSCR
- 1.67
- GRM
- 6.8
CMA / ARV
- ARV (median comp)
- $276,800
- List price
- $149,900
- Delta
- -45.85%
- Verdict
- UNDERPRICED
- Comps
- 20 within 1.0 mi
Show comp detail 12 sales within ~0.75 mi
| Address | Dist | Beds/Ba | Sqft | Sold | Price | $/sf | Match |
|---|---|---|---|---|---|---|---|
| 1209 Georgia Ave | 0.32mi | 3/2.0 | 1,331 (-0%) | 14mo | $303,000 | $228 | 73 |
| 411 E 9th St | 0.32mi | 3/2.0 | 1,356 (+2%) | 15mo | $316,000 | $233 | 70 |
| 911 New York Ave | 0.33mi | 3/2.0 | 1,378 (+3%) | 13mo | $248,600 | $180 | 69 |
| 504 E Pine Forest Dr | 0.71mi | 3/2.0 | 1,320 (-1%) | 2mo | $265,000 | $201 | 63 |
| 201 E 8th St | 0.37mi | 3/2.0 | 1,274 (-5%) | 15mo | $280,000 | $220 | 62 |
| 1010 Wyoming Ave | 0.70mi | 3/2.0 | 1,330 (-0%) | 21mo | $243,000 | $183 | 49 |
| 703 Michigan Ave | 0.46mi | 2/2.0 (-1) | 1,203 (-10%) | 12mo | $140,000 | $116 | 47 |
| 808 Tennessee Ave | 0.65mi | 3/2.0 | 1,232 (-8%) | 13mo | $276,500 | $224 | 46 |
| 402 E 19th St | 0.66mi | 3/2.0 | 1,416 (+6%) | 20mo | $304,900 | $215 | 43 |
| 1308 Carolina Ave | 0.70mi | 3/1.0 | 1,420 (+6%) | 18mo | $235,000 | $165 | 37 |
| 520 Pennsylvania Ave | 0.60mi | 3/2.0 | 1,504 (+13%) | 20mo | $309,900 | $206 | 34 |
| 1802 Minnesota Ave | 0.65mi | 4/2.0 (+1) | 1,473 (+10%) | 19mo | $273,500 | $186 | 32 |
Match score weights: distance 35% · size 25% · config 20% · recency 20%. Top-matched comps best support the ARV.
Projected returns pro-forma
-3.0% appreciation · 2.52% rent growth · sell at horizon
- IRR
- 5.1%
- Equity multiple
- 1.20×
- Total profit
- $8,221
- Equity at exit
- $22,351
- IRR
- 14.1%
- Equity multiple
- 2.11×
- Total profit
- $46,461
- Equity at exit
- $12,961
Cash invested: $41,972 (down + closing). Projections, not guarantees.
Landlord ↔ Tenant lean methodology
- Overall (STATE)
- 87 Strongly Landlord-Friendly
- State Florida
- 87 Strongly Landlord-Friendly · R+3
- County
- — inherits STATE
- City
- — inherits STATE
ZIP-level market 32444
- Home prices YoY
- -29.1%
- Rents YoY
- 2.5%
- Active inventory
- 196
- Price-to-rent
- 6.8×
Monthly cashflow live
- Estimated rent
- $1,835 medium interval (Pro) →
- Mortgage (P&I)
- −$786
- Tax from tax record
- −$76 /mo · $913/yr
- Insurance
- −$62
- HOA
- −$0
- Vacancy / Maint / Mgmt
- −$385
- Net cashflow
- $525
Break-even live
UW: 25.0% down · 7.5% · 30yr · 1.5% tax · 5.0% vac · 8.0% maint · 8.0% mgmt
Financing live
Cash to close
- Down payment
- $37,475
- Closing costs
- $4,497
- Reserves months
- —
- Total cash needed
- —
Loan-product check · same deal, 3 products live
Conventional
25% down · 7.5% · 30yr
- Down + closing
- —
- Monthly P&I
- —
- Monthly cashflow
- —
- DSCR
- —
- Eligible?
- —
Personal DTI + credit; lowest rate.
DSCR
20% down · 8.5% · 30yr
- Down + closing
- —
- Monthly P&I
- —
- Monthly cashflow
- —
- DSCR
- —
- Eligible?
- —
No personal income docs; deal must DSCR.
Hard money
10% down · 12.0% · 12mo
- Down + closing
- —
- Monthly P&I
- —
- Monthly cashflow
- —
- DSCR
- —
- Eligible?
- —
Short-term bridge; refi at stabilization.
Rent comps 3 comps
| Address | Beds | Baths | Sqft | Rent | $/sqft | DOM | Units | Dist |
|---|---|---|---|---|---|---|---|---|
| 1307 Pennsylvania Ave Unit 1 Lynn Haven, FL | 3.0 | 1.0 | 1256 | $1,500 | $1.19 | 13d | 1 | 0.17mi |
| 2305 Minnesota Ave Lynn Haven, FL | 4.0 | 2.0 | 1692 | $1,950 | $1.15 | 13d | 1 | 1.20mi |
| 1713 Jakes Dr Panama City, FL | 3.0 | 2.5 | 1576 | $2,250 | $1.43 | 21d | 1 | 1.44mi |
Listing history 21 events
-
2026-06-18days on market $149,900 Active 95 DOM
-
2026-06-17days on market $149,900 Active 94 DOM
-
2026-06-16days on market $149,900 Active 93 DOM
-
2026-06-15days on market $149,900 Active 92 DOM
-
2026-06-14days on market $149,900 Active 90 DOM
-
2026-06-13days on market $149,900 Active 89 DOM
-
2026-06-10pricedays on market $149,900 Active 87 DOM
-
2026-06-09days on market $150,000 Active 86 DOM
-
2026-06-08days on market $150,000 Active 85 DOM
-
2026-06-07days on market $150,000 Active 84 DOM
-
2026-06-05days on market $150,000 Active 81 DOM
-
2026-06-03days on market $150,000 Active 80 DOM
-
2026-06-03price $150,000 Active 79 DOM
-
2026-06-02days on market $169,000 Active 79 DOM
-
2026-06-01days on market $169,000 Active 78 DOM
-
2026-05-31days on market $169,000 Active 77 DOM
-
2026-05-30days on market $169,000 Active 76 DOM
-
2026-04-13price $169,000 1176-char remark
Show marketing remark (1176 chars)
CASH OR HARD MONEY ONLY | BEST FLIP INVESTMENT OPPORTUNITY IN LYNN HAVEN! Due to the home's current condition, traditional financing will not be considered. Property is being sold strictly AS-IS; seller will make no repairs or concessions. Recently reduced to $169,000, this property is priced aggressively for a quick sale and offers excellent potential for investors or buyers seeking a value-add opportunity. Located in a desirable golf-cart-friendly Lynn Haven neighborhood, this property sits on a 0.34-acre corner lot, providing strong upside for renovation or redevelopment. The existing 1,336 sq ft, 3BR/2BA home (1955) offers a solid footprint ready for transformation. Whether renovating or building new, the lot size and location make this a standout opportunity. Convenient to North Bay, Deer Point Lake boat ramps, parks, Panama Country Club, and just 20 minutes to the Gulf beaches. Property condition may limit financing and certain inspections. A full inspection report is available upon request for serious buyers. Showings by appointment only; do not disturb occupants. Buyer to conduct all due diligence and verify all information. Measurements approximate.
-
2026-04-01price $169,900 1176-char remark
Show marketing remark (1176 chars)
CASH OR HARD MONEY ONLY | BEST FLIP INVESTMENT OPPORTUNITY IN LYNN HAVEN! Due to the home's current condition, traditional financing will not be considered. Property is being sold strictly AS-IS; seller will make no repairs or concessions. Recently reduced to $169,000, this property is priced aggressively for a quick sale and offers excellent potential for investors or buyers seeking a value-add opportunity. Located in a desirable golf-cart-friendly Lynn Haven neighborhood, this property sits on a 0.34-acre corner lot, providing strong upside for renovation or redevelopment. The existing 1,336 sq ft, 3BR/2BA home (1955) offers a solid footprint ready for transformation. Whether renovating or building new, the lot size and location make this a standout opportunity. Convenient to North Bay, Deer Point Lake boat ramps, parks, Panama Country Club, and just 20 minutes to the Gulf beaches. Property condition may limit financing and certain inspections. A full inspection report is available upon request for serious buyers. Showings by appointment only; do not disturb occupants. Buyer to conduct all due diligence and verify all information. Measurements approximate.
-
2026-03-19price $185,000 1176-char remark
Show marketing remark (1176 chars)
CASH OR HARD MONEY ONLY | BEST FLIP INVESTMENT OPPORTUNITY IN LYNN HAVEN! Due to the home's current condition, traditional financing will not be considered. Property is being sold strictly AS-IS; seller will make no repairs or concessions. Recently reduced to $169,000, this property is priced aggressively for a quick sale and offers excellent potential for investors or buyers seeking a value-add opportunity. Located in a desirable golf-cart-friendly Lynn Haven neighborhood, this property sits on a 0.34-acre corner lot, providing strong upside for renovation or redevelopment. The existing 1,336 sq ft, 3BR/2BA home (1955) offers a solid footprint ready for transformation. Whether renovating or building new, the lot size and location make this a standout opportunity. Convenient to North Bay, Deer Point Lake boat ramps, parks, Panama Country Club, and just 20 minutes to the Gulf beaches. Property condition may limit financing and certain inspections. A full inspection report is available upon request for serious buyers. Showings by appointment only; do not disturb occupants. Buyer to conduct all due diligence and verify all information. Measurements approximate.
-
2026-03-15$189,000 Active 1176-char remark
Show marketing remark (1176 chars)
CASH OR HARD MONEY ONLY | BEST FLIP INVESTMENT OPPORTUNITY IN LYNN HAVEN! Due to the home's current condition, traditional financing will not be considered. Property is being sold strictly AS-IS; seller will make no repairs or concessions. Recently reduced to $169,000, this property is priced aggressively for a quick sale and offers excellent potential for investors or buyers seeking a value-add opportunity. Located in a desirable golf-cart-friendly Lynn Haven neighborhood, this property sits on a 0.34-acre corner lot, providing strong upside for renovation or redevelopment. The existing 1,336 sq ft, 3BR/2BA home (1955) offers a solid footprint ready for transformation. Whether renovating or building new, the lot size and location make this a standout opportunity. Convenient to North Bay, Deer Point Lake boat ramps, parks, Panama Country Club, and just 20 minutes to the Gulf beaches. Property condition may limit financing and certain inspections. A full inspection report is available upon request for serious buyers. Showings by appointment only; do not disturb occupants. Buyer to conduct all due diligence and verify all information. Measurements approximate.
ⓘ Source: listings_history table (triggers on properties + properties_extension) + one-shot
backfill from property_details.listing_events for pre-trigger history.
Tax reassessment forecast FL · Resets to sale price
- Current annual tax
- $913 · $76/mo
- Projected year-2 tax
- $1,244 · $104/mo
- Expected delta
- +$331/yr (+$28/mo · 36.3%)
ⓘ Screening estimate from a state-policy table — verify with the county assessor before closing.
Climate risk First Street
- Flood 4/10 Moderate FEMA zone X (unshaded) · 13% chance over 30 yrs
- Wildfire 1/10 Low
- Heat 10/10 Extreme 7 d/yr ≥104°F today · 21 d/yr by 30 yrs out
- Wind 9/10 Extreme 99% chance of damaging wind over 30 yrs
- Air quality 1/10 Low 0 unhealthy d/yr today · 0 by 30 yrs out
Nearby sold comps map
Loading sold comps map…
Walkable amenities ~0.75 mi
Loading nearby amenities…
Taxation est. · year 1
- Rental income
- $22,019
- − Mortgage interest
- −$8,397
- − Property taxes
- −$913
- − Insurance
- −$750
- − Repairs & maintenance
- −$1,762
- − Management
- −$1,762
- − Depreciation
- −$4,361
- Taxable income
- $4,076
- Est. tax owed @ 24.0%
- −$978
- After-tax cash flow
- $5,321/yr
For passive investors: Depreciation is non-cash, so a rental often shows a tax loss while cash-flowing — sheltering income. Rental losses are passive: they offset passive income freely, and up to $25,000/yr can offset ordinary (W-2) income if you actively participate and your MAGI is under $100k (phasing out to $0 by $150k); unused losses carry forward. On sale, claimed depreciation is recaptured at up to 25%, and gains may owe capital-gains tax (a 1031 exchange can defer both). Figures are a year-1 estimate at your 24.0% rate — not tax advice; consult a CPA.
Schools (NCES district)
- District
- Bay
- NCES district ID
- 1200090
- Math proficiency
- 51% ▼ -8.00%
- Reading proficiency
- 51% ▼ -7.00%
- Median HH income
- $47,740
- Composite
- 43.41/100
- National rank
- #3014
- State rank
- #29 of 73 in FL
Livability — Lynn Haven
- Score
- 81/100
- State rank
- #96
- US rank
- #1472
Category grades
Schools grade is shown separately in the Schools card above.
Census & demographics
- Census place
- Lynn Haven, FL
- County
- Bay County · 163,593 people
- City population
- 21,459
- Metro
- Panama City, FL
- Population (ZIP)
- 21,459
- Household income
- $83,160
- Rent vs Own
- Severe rent burden
- 430.0
Population outlook (Bay County) Hauer SSP2
- Today (2025)
- 206,264 people
- By 2030
- 217,740 · +5.6%
- By 2040
- 238,738 · +15.7%
- By 2050
- 255,545 · +23.9%
- By 2075
- 288,295 · +39.8%
- By 2100
- 288,638 · +39.9%
Race, ethnicity, and origin ACS 2023
- Neighborhood character
- Predominantly White (75%)
- Race & ethnicity
- White 75% Two or more races 11% Hispanic / Latino 10% Black 6% Asian 3%
- Hispanic origin (detail)
- Mexican 2% Puerto Rican 2%
- Common ancestry
- Lithuanian 3% Romanian 3% Serbian 2%
- Foreign-born
- 10% · Canada, Vietnam, South Korea
- Languages at home
- 87% English-only · Spanish 8% Russian/Polish/Slavic 1% Other Indo-European 1%
Political lean MEDSL · Bay
- 2024 margin
- Solid R (+47.4) · D 25.8% · R 73.1% · Other 1.1%
- 2008→2024 swing
- -6.6pp toward R · 2008: -40.7pp · 2024: -47.4pp
- All cycles
- 2024: R+47.4 2020: R+43.5 2016: R+46.3 2012: R+43.6 2008: R+40.7
Not yet ingested
- Civics
- —
Market trends
- HPI YoY
- ▼ -108.08%
- Current HPI
- 263.5418
- Rent YoY
- ▲ 2.52%
- Metro
- Panama City, FL
- State GDP YoY
- ▲ 3.28%
- F500 in state
- 36
Industry mix (Fortune 500 HQ in FL)
| Industry | F500 HQs | Revenue |
|---|---|---|
| Industrial Technology | 2 | $29B |
|
||
| Insurance | 2 | $17B |
|
||
| Retail | 1 | $60B |
|
||
| Technology Distribution | 1 | $58B |
|
||
| Homebuilding | 1 | $35B |
|
||
| Technology Manufacturing | 1 | $35B |
|
||
Price history
-10.6% since first listed4 events — show timeline
- 2026-04-13 Price Changed $169,000 CPARMLS
- 2026-04-01 Price Changed $169,900 CPARMLS
- 2026-03-19 Price Changed $185,000 CPARMLS
- 2026-03-15 Listed $189,000 CPARMLS
Property tax history
+15.6%/yrLatest (2025): $913 · +5.7% YoY. Source: county tax records.
Cash-flow waterfall
monthlySold comps — $/sqft
last 12 mo · ≤1 miLoading sold comps…