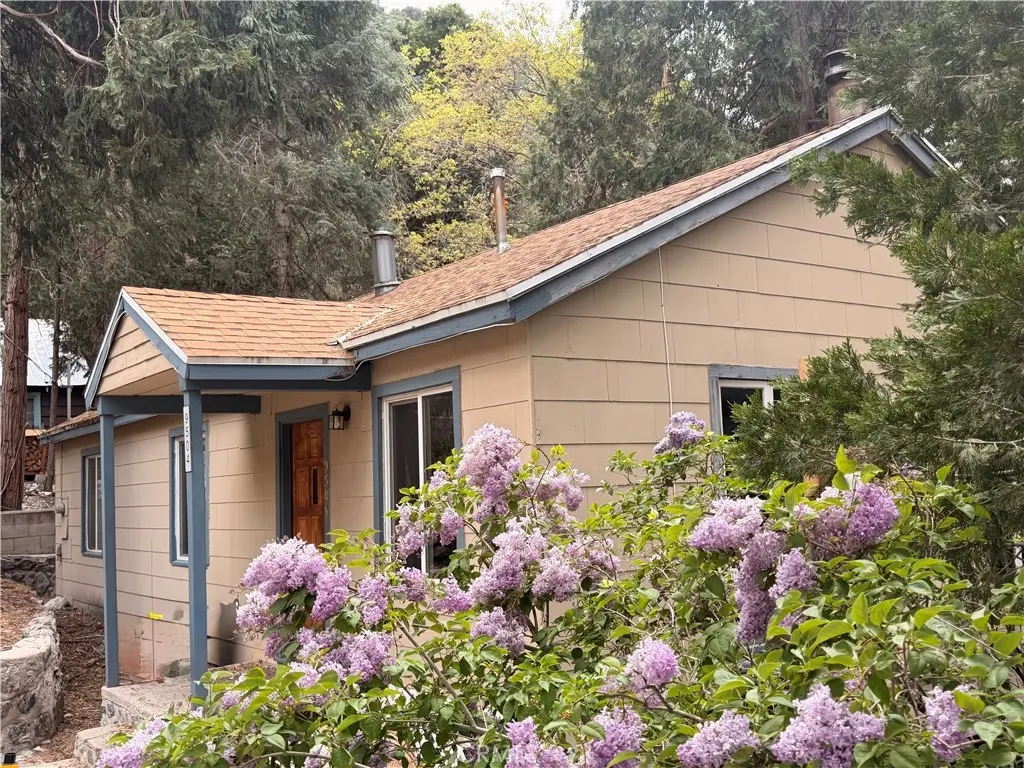
9504 Summit · Oak Glen, CA
Flood risk 3/10 · Minor
- FEMA flood zone
- X (unshaded)
- Chance of flooding over 30 yrs
- 0.2%
- Est. flood insurance / yr
- $507 – $1,088
Fire risk 8/10 · Major
- Est. fire insurance / yr
- $659 – $1,223
Heat risk 2/10 · Minimal
- Hot days now (above 82°F)
- 14 days/yr
- Hot days in 30 yrs
- 38 days/yr
Wind risk 1/10 · Minimal
- Chance of severe wind over 30 yrs
- —
Air-quality risk 10/10 · Severe
- Unhealthy air days now
- 42 days/yr
- Unhealthy air days in 30 yrs
- 50 days/yr
Risk factors via First Street. Map © Google.
Why this score? — see what drove the D grade
The composite is a weighted blend of 9 inputs, each scored 0–100. Each bar is that input's sub-score; the figure is the points it added to the 100-point composite (weight × sub-score).
- ARV discount +11.9/15.0
- Appreciation +10.0/10.0
- Cash flow +6.1/30.0
- Schools +4.7/10.0
- Rent growth +2.5/5.0
- Condition / age +2.5/5.0
- Livability +2.0/5.0
- 1% rule +0.8/10.0
- DSCR +0.5/10.0
$349,000
🖨 Deal sheet 📄 Offer letter ✓ Due diligence
Listing remarks MLS
Best Deal on The Market! This 3 bedroom 2 bath home has sooo much to offer! Peak a Boo View of Southern California's Tallest Year 'round Waterfall, Big Falls. Enter into large living room with efficient wood burning stove, to stave off Winters Chill. Large Kitchen and dining area divide living room and Bedrooms. Living room has new laminate flooring. 2 main level bedrooms and full bath. At rear of home separate sitting room, full bath and loft bedroom with pedestal for cozy sleeping area. Rear yard partially fenced for your fur babies. If you're an avid hiker this is the place to be, just feet from The Vivian Trail Head and sitting directly in the San Gorgonio Wilderness. Escape the City heat and come to Forest Falls where the Air is Clean the water is fresh and a better way of life, make the change today!
Key facts
- Loft bedroom
- 6,000 sq ft lot
- Built 1959
Tags
Neighborhood map
What this means for you Summary
Snapshot
- This is a 2-bed/1.0-bath single-family listed at $349k.
Deal economics
- At list price, monthly cash flow is $-645 ($-8k/yr) — negative.
- To cash-flow at today's rent, offer at most $235k (32.6% below list).
- To meet the 1% rule (rent ≥ 1% of price), the offer needs to be $204k (41.6% below list).
- Recommended offer: $204k (41.6% below list) — sets the bar for 1% rule.
Location & tenants
- Location reads 40/100 on livability (#1,386 in CA) — a working-class tenant base; expect higher turnover. Strengths: housing A+, crime A; Watch: schools D, amenities F, commute F.
- Redlands Unified (urban): math 44% / reading 57% proficiency, ranked #390 of 1,400 in CA (top 28%) — acceptable for families but not a draw, mixed tenant base, ~2y average lease.
- Market conditions: 21 active listings in the ZIP; 5,458 units permitted in San Bernardino County in 2024 (1,500 in 5+ unit buildings).
Forward outlook
- In year one you build about $37k of equity ($2k loan paydown + $35k appreciation (10.0% local appreciation)).
- San Bernardino County population projected at +15% by 2050 — modest demand growth; plan on rents tracking national, not racing it.
- By year 2, paydown + projected appreciation supports a ~$60k cash-out refi (75% LTV) — recoverable capital for the next deal without selling this one.
Negotiation context
- It's been on market 106 days — a 9% lower offer ($318k) is reasonable based on typical stale-listing flexibility.
- 3 sale attempts since 22y ago with the ask held roughly flat each time — persistent listings suggest the price (not the market) is what's stuck; bring a comps-based counter.
- Current owner paid $197k; list at $349k implies a 77% gain — meaningful room to come down on a strong offer.
Risks & watch-outs
- Watch-outs: built in 1959 — expect roof / HVAC / electrical / plumbing capex.
- Climate carrying-cost: severe wildfire risk — expect insurance premiums to compound above CPI over the hold.
Questions for the listing agent
- What do current leases actually rent for vs. the listed asking? Can we see a recent rent roll and the last 12 months of T-12 income?
- It's been on market 106 days. Have you received any prior offers? Is the seller open to a 42% concession, seller financing, or rate buy-down credit?
- Built in 1959 — when were the roof, HVAC, electrical panel, plumbing, and water heater last replaced?
- Why hasn't it sold? Are there any deal-killer items the seller is aware of (foundation, flood, title, zoning, code violations)?
- Is there a deadline driving the sale (1031 exchange, divorce, estate, relocation)? That informs how much negotiation room exists.
- Schools are D-rated, which usually means shorter tenancies and higher turnover. Who's the typical renter profile here, and what's been the actual vacancy rate?
- The area grade is low — what's the realistic commute time and amenity access for the typical tenant pool here? Any planned neighborhood developments (good or bad) we should know about?
- What's the average days-on-market for RENTAL listings here right now (not sales)? A rising rental-DOM trend means longer vacancies and softer asking-rent achievability than the comps imply.
- What's the recent tenant-quality profile in this submarket — average credit score on applications, eviction rate, late-payment / NSF rate, and stable-employment percentage? A property-management company in the area should have these aggregated.
- How much new for-sale + rental construction is in the pipeline within 1–3 miles? Heavy new supply typically softens prices + rents 12–24 months out; constrained supply supports both.
Investment metrics
- 1% rule
- 0.58% ✗
- Cap rate
- 4.08%
- Cash-on-cash
- -7.91%
- DSCR
- 0.65
- GRM
- 14.3
CMA / ARV
- ARV (median comp)
- $386,440
- List price
- $349,000
- Delta
- -9.69%
- Verdict
- FAIR
- Comps
- 20 within 1.0 mi
Show comp detail 9 sales within ~0.75 mi
| Address | Dist | Beds/Ba | Sqft | Sold | Price | $/sf | Match |
|---|---|---|---|---|---|---|---|
| 9376 Dogwood Ln | 0.16mi | 2/2.0 | 1,414 (+2%) | 7mo | $310,000 | $219 | 79 |
| 41524 Alder Dr | 0.11mi | 2/2.0 | 1,458 (+5%) | 11mo | $465,000 | $319 | 73 |
| 41163 Pine Dr | 0.43mi | 2/1.0 | 1,400 (+1%) | 12mo | $359,000 | $256 | 68 |
| 9544 Snow Drift Dr | 0.06mi | 3/1.0 (+1) | 1,188 (-14%) | 10mo | $268,500 | $226 | 61 |
| 9412 Spring Dr | 0.34mi | 2/1.0 | 1,242 (-10%) | 13mo | $336,000 | $271 | 56 |
| 9405 Canyon Dr | 0.37mi | 2/2.0 | 1,308 (-6%) | 20mo | $391,000 | $299 | 53 |
| 41062 Pine Dr | 0.56mi | 3/2.0 (+1) | 1,504 (+9%) | 3mo | $420,000 | $279 | 48 |
| 40969 Spruce Dr | 0.65mi | 2/1.0 | 1,229 (-11%) | 17mo | $350,000 | $285 | 37 |
| 40930 Maple Dr | 0.69mi | 2/2.0 | 1,300 (-6%) | 20mo | $445,000 | $342 | 37 |
Match score weights: distance 35% · size 25% · config 20% · recency 20%. Top-matched comps best support the ARV.
Projected returns pro-forma
10.0% appreciation · 3.0% rent growth · sell at horizon
- IRR
- 18.7%
- Equity multiple
- 2.52×
- Total profit
- $148,959
- Equity at exit
- $314,407
- IRR
- 17.3%
- Equity multiple
- 5.82×
- Total profit
- $470,808
- Equity at exit
- $678,030
Cash invested: $97,720 (down + closing). Projections, not guarantees.
Landlord ↔ Tenant lean methodology
- Overall (STATE)
- 18 Strongly Tenant-Friendly
- State California
- 18 Strongly Tenant-Friendly · D+13
- County
- — inherits STATE
- City
- — inherits STATE
ZIP-level market 92339
- Home prices YoY
- 9.8%
- Active inventory
- 21
- Price-to-rent
- 14.3×
Monthly cashflow live
- Estimated rent
- $2,037 medium interval (Pro) →
- Mortgage (P&I)
- −$1,830
- Tax from tax record
- −$278 /mo · $3,339/yr
- Insurance
- −$145
- HOA
- −$0
- Vacancy / Maint / Mgmt
- −$428
- Net cashflow
- $-645
Break-even live
UW: 25.0% down · 7.5% · 30yr · 1.5% tax · 5.0% vac · 8.0% maint · 8.0% mgmt
Financing live
Cash to close
- Down payment
- $87,250
- Closing costs
- $10,470
- Reserves months
- —
- Total cash needed
- —
Loan-product check · same deal, 3 products live
Conventional
25% down · 7.5% · 30yr
- Down + closing
- —
- Monthly P&I
- —
- Monthly cashflow
- —
- DSCR
- —
- Eligible?
- —
Personal DTI + credit; lowest rate.
DSCR
20% down · 8.5% · 30yr
- Down + closing
- —
- Monthly P&I
- —
- Monthly cashflow
- —
- DSCR
- —
- Eligible?
- —
No personal income docs; deal must DSCR.
Hard money
10% down · 12.0% · 12mo
- Down + closing
- —
- Monthly P&I
- —
- Monthly cashflow
- —
- DSCR
- —
- Eligible?
- —
Short-term bridge; refi at stabilization.
Listing history 24 events
-
2026-06-18days on market $349,000 Active 106 DOM
-
2026-06-17days on market $349,000 Active 105 DOM
-
2026-06-16days on market $349,000 Active 104 DOM
-
2026-06-15days on market $349,000 Active 103 DOM
-
2026-06-13days on market $349,000 Active 101 DOM
-
2026-06-13days on market $349,000 Active 100 DOM
-
2026-06-09days on market $349,000 Active 97 DOM
-
2026-06-08days on market $349,000 Active 96 DOM
-
2026-06-07days on market $349,000 Active 95 DOM
-
2026-06-04days on market $349,000 Active 92 DOM
-
2026-06-03days on market $349,000 Active 91 DOM
-
2026-06-02days on market $349,000 Active 90 DOM
-
2026-06-01days on market $349,000 Active 89 DOM
-
2026-05-31days on market $349,000 Active 88 DOM
-
2026-03-04$349,000 Active 821-char remark
Show marketing remark (821 chars)
Best Deal on The Market! This 3 bedroom 2 bath home has sooo much to offer! Peak a Boo View of Southern California's Tallest Year 'round Waterfall, Big Falls. Enter into large living room with efficient wood burning stove, to stave off Winters Chill. Large Kitchen and dining area divide living room and Bedrooms. Living room has new laminate flooring. 2 main level bedrooms and full bath. At rear of home separate sitting room, full bath and loft bedroom with pedestal for cozy sleeping area. Rear yard partially fenced for your fur babies. If you're an avid hiker this is the place to be, just feet from The Vivian Trail Head and sitting directly in the San Gorgonio Wilderness. Escape the City heat and come to Forest Falls where the Air is Clean the water is fresh and a better way of life, make the change today!
-
2021-12-17historical
-
2021-10-14price $325,000
-
2021-08-08price $338,000
-
2021-03-28$339,000 Active
-
2004-06-11soldstatus $197,000
-
2004-06-11$195,000
-
2004-05-28soldstatus $197,000
-
1990-02-13soldstatus $97,000
-
1986-08-29soldstatus $68,500
ⓘ Source: listings_history table (triggers on properties + properties_extension) + one-shot
backfill from property_details.listing_events for pre-trigger history.
Tax reassessment forecast CA · Resets to sale price
- Current annual tax
- $3,339 · $278/mo
- Projected year-2 tax
- $3,339 · $278/mo
- Expected delta
- $0/yr ($0/mo · 0.0%)
ⓘ Screening estimate from a state-policy table — verify with the county assessor before closing.
Climate risk First Street
- Flood 3/10 Moderate FEMA zone X (unshaded) · 20% chance over 30 yrs
- Wildfire 8/10 Severe
- Heat 2/10 Low 14 d/yr ≥82°F today · 38 d/yr by 30 yrs out
- Wind 1/10 Low
- Air quality 10/10 Extreme 42 unhealthy d/yr today · 50 by 30 yrs out
Nearby sold comps map
Loading sold comps map…
Walkable amenities ~0.75 mi
Loading nearby amenities…
Taxation est. · year 1
- Rental income
- $24,445
- − Mortgage interest
- −$19,549
- − Property taxes
- −$3,339
- − Insurance
- −$1,745
- − Repairs & maintenance
- −$1,956
- − Management
- −$1,956
- − Depreciation
- −$10,153
- Taxable loss
- −$14,252
- Est. tax savings @ 24.0%
- +$3,420
- After-tax cash flow
- $-4,314/yr
For passive investors: Depreciation is non-cash, so a rental often shows a tax loss while cash-flowing — sheltering income. Rental losses are passive: they offset passive income freely, and up to $25,000/yr can offset ordinary (W-2) income if you actively participate and your MAGI is under $100k (phasing out to $0 by $150k); unused losses carry forward. On sale, claimed depreciation is recaptured at up to 25%, and gains may owe capital-gains tax (a 1031 exchange can defer both). Figures are a year-1 estimate at your 24.0% rate — not tax advice; consult a CPA.
Schools (NCES district)
- District
- Redlands Unified
- NCES district ID
- 0632070
- Math proficiency
- 44% ▼ -1.00%
- Reading proficiency
- 57% ▼ -2.00%
- Median HH income
- $67,959
- Composite
- 46.88/100
- National rank
- #5185
- State rank
- #390 of 1400 in CA
Livability — Oak Glen
- Score
- 40/100
- State rank
- #1386
- US rank
- #27266
Category grades
Schools grade is shown separately in the Schools card above.
Census & demographics
- Population (ZIP)
- 1,277
Population outlook (San Bernardino County) Hauer SSP2
- Today (2025)
- 2,300,329 people
- By 2030
- 2,378,907 · +3.4%
- By 2040
- 2,523,137 · +9.7%
- By 2050
- 2,642,388 · +14.9%
- By 2075
- 2,880,769 · +25.2%
- By 2100
- 2,909,436 · +26.5%
Race, ethnicity, and origin ACS 2023
- Neighborhood character
- Diverse neighborhood (Simpson 0.60)
- Race & ethnicity
- White 57% Hispanic / Latino 27% Two or more races 21%
- Hispanic origin (detail)
- Mexican 22% Puerto Rican 1%
- Common ancestry
- Italian 3% Slovak 3% Iranian 1%
- Foreign-born
- 6% · Canada
- Languages at home
- 93% English-only · Spanish 7%
Political lean MEDSL · San Bernardino
- 2024 margin
- Toss-up / Even · D 47.5% · R 49.7% · Other 2.8%
- 2008→2024 swing
- -8.5pp toward R · 2008: 6.3pp · 2024: -2.1pp
- All cycles
- 2024: R+2.1 2020: D+10.7 2016: D+9.8 2012: D+5.4 2008: D+6.3
Not yet ingested
- Civics
- —
Market trends
- HPI YoY
- ▲ 26.65%
- Current HPI
- 298.6731
- Rent YoY
- —
- Metro
- —
- State GDP YoY
- ▲ 3.21%
- F500 in state
- 116
Industry mix (Fortune 500 HQ in CA)
| Industry | F500 HQs | Revenue |
|---|---|---|
| Technology | 27 | $1,492B |
|
||
| Financial Services | 3 | $174B |
|
||
| Retail | 3 | $44B |
|
||
| Insurance | 3 | $26B |
|
||
| Media / Entertainment | 2 | $115B |
|
||
| Pharmaceuticals / Biotech | 2 | $62B |
|
||
Price history
+409.5% since first listed10 events — show timeline
- 2026-03-04 Listed $349,000 CRMLS
- 2021-12-17 Listing Removed — CRMLS
- 2021-10-14 Price Changed $325,000 CRMLS
- 2021-08-08 Price Changed $338,000 CRMLS
- 2021-03-28 Listed $339,000 CRMLS
- 2004-06-11 Listed $195,000 CRMLS
- 2004-06-11 Sold (MLS) $197,000 CRMLS
- 2004-05-28 Sold (Public Records) $197,000 Public Records
- 1990-02-13 Sold (Public Records) $97,000 Public Records
- 1986-08-29 Sold (Public Records) $68,500 Public Records
Property tax history
+2.1%/yrLatest (2025): $3,339 · +7.4% YoY. Source: county tax records.
Cash-flow waterfall
monthlySold comps — $/sqft
last 12 mo · ≤1 miLoading sold comps…