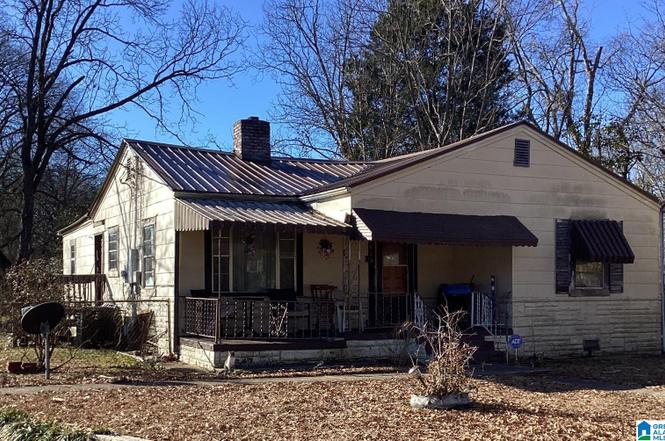
5613 Cairo Ave · Birmingham, AL
Flood risk 1/10 · Minimal
- FEMA flood zone
- X (unshaded)
- Chance of flooding over 30 yrs
- 0.0%
- Est. flood insurance / yr
- $507 – $1,088
Fire risk 4/10 · Minor
- Est. fire insurance / yr
- $916 – $1,700
Heat risk 7/10 · Major
- Hot days now (above 108°F)
- 7 days/yr
- Hot days in 30 yrs
- 20 days/yr
Wind risk 6/10 · Moderate
- Chance of severe wind over 30 yrs
- 27.0%
Air-quality risk 3/10 · Minor
- Unhealthy air days now
- 2 days/yr
- Unhealthy air days in 30 yrs
- 5 days/yr
Risk factors via First Street. Map © Google.
Why this score? — see what drove the B+ grade
The composite is a weighted blend of 9 inputs, each scored 0–100. Each bar is that input's sub-score; the figure is the points it added to the 100-point composite (weight × sub-score).
- Cash flow +30.0/30.0
- ARV discount +15.0/15.0
- 1% rule +10.0/10.0
- DSCR +10.0/10.0
- Livability +3.4/5.0
- Appreciation +2.6/10.0
- Condition / age +2.5/5.0
- Rent growth +2.1/5.0
- Schools +0.9/10.0
$33,500
🖨 Deal sheet 📄 Offer letter ✓ Due diligence
Listing remarks
This 3 BR, 2 BA investment property is a diamond in the rough, ready for a full clean-out and some TLC. Featuring a spacious living room, a functional kitchen with ample potential for updates and a cozy den area perfect for additional living space or an office. The bathrooms are in need of updating but provide a great foundation for modern renovations. With vision and effort, this property could be transformed into a beautiful rental or resale opportunity. Contracts are subject to court approval.
Key facts
- Functional kitchen
- Modern renovations
- Cozy den area
Tags
Neighborhood map
What this means for you Summary
Snapshot
- This is a 2-bed/1.0-bath single-family listed at $34k.
Deal economics
- At list price, monthly cash flow is $573 ($7k/yr) — positive.
- The deal already cash-flows at list — no discount required.
- Meets the 1% rule at list price ($1k rent vs $34k).
- Recommended offer: $31k (6.0% below list) — sets the bar for market timing.
- Cap rate 26.8% vs local median 6.2% in Birmingham — top-decile yield for the area; either an underpriced asset or a hidden risk that comps aren't pricing in. Stress-test before assuming the spread holds.
Location & tenants
- Location reads 67/100 on livability (#78 in AL) — a middle-class / working-renter tenant base. Strengths: commute A+, cost of living A+, housing A+; Watch: amenities C-, crime F, employment F.
- Birmingham City (urban): math 4% / reading 20% proficiency, ranked #116 of 129 in AL (top 90%) — low school quality limits family demand, transient renter base, plan for 1-2y turnover; 82% free/reduced lunch — lower-income household profile, screen leases tightly.
- Zoned schools: Oxmoor K5 (math 2% / reading 12%, grade F, #601 of 627 statewide, top 98%, 478 students, 85% FRL); Wenonah High School (math 2% / reading 2%, grade F, #291 of 305 statewide, top 100%, 656 students, 85% FRL) — zoned schools at 85% FRL track the district average.
- Market conditions: Rents soft (-1.5%/yr); 87 active listings in the ZIP; 40 comparable units currently listed for rent nearby; rentals at typical pace (median 24d on market — plan ~3-4 weeks tenant-placement turnaround); 40% of comp listings sitting > 30 days — soft ceiling on asking rent; 2,114 units permitted in Jefferson County in 2024 (556 in 5+ unit buildings).
Forward outlook
- Local home prices are declining (-3.0%/yr); year-one equity from $232 of loan paydown is wiped out by about $1k of value loss. Plan a longer hold.
- Jefferson County population projected to shrink 4% by 2050 — rents likely to lag national; underwrite the cash flow, not the appreciation.
- At projected returns (-3.0% appreciation + 0.0% rent growth), your $9k cash investment doubles in ~2 years — after that, you're playing with house money.
Negotiation context
- It's been on market 70 days — a 6% lower offer ($31k) is reasonable based on typical stale-listing flexibility.
- Current owner paid $23k; 46% above their basis — modest negotiation headroom, anchor on the comps not their cost.
Risks & watch-outs
- Watch-outs: property tax is 2.7% of price; built in 1952 — expect roof / HVAC / electrical / plumbing capex.
- Climate carrying-cost: major wind risk, 27% chance of damaging wind over 30y; extreme-heat days projected 7→20/yr by 2055 (HVAC capex compounding) — expect insurance premiums to compound above CPI over the hold.
Questions for the listing agent
- It's been on market 70 days. Have you received any prior offers? Is the seller open to a 6% concession, seller financing, or rate buy-down credit?
- Built in 1952 — when were the roof, HVAC, electrical panel, plumbing, and water heater last replaced?
- Property tax is high relative to price — has the assessment been appealed recently, and will the sale trigger a re-assessment?
- Why hasn't it sold? Are there any deal-killer items the seller is aware of (foundation, flood, title, zoning, code violations)?
- Is there a deadline driving the sale (1031 exchange, divorce, estate, relocation)? That informs how much negotiation room exists.
- Schools are F-rated, which usually means shorter tenancies and higher turnover. Who's the typical renter profile here, and what's been the actual vacancy rate?
- Crime grade is F in this area — have there been break-ins, vandalism, or insurance claims at this property in the last 3 years? What carrier currently insures it and at what premium?
- What's the average days-on-market for RENTAL listings here right now (not sales)? A rising rental-DOM trend means longer vacancies and softer asking-rent achievability than the comps imply.
- What's the recent tenant-quality profile in this submarket — average credit score on applications, eviction rate, late-payment / NSF rate, and stable-employment percentage? A property-management company in the area should have these aggregated.
- How much new for-sale + rental construction is in the pipeline within 1–3 miles? Heavy new supply typically softens prices + rents 12–24 months out; constrained supply supports both.
Investment metrics
- 1% rule
- 3.17% ✓
- Cap rate
- 26.82%
- Cash-on-cash
- 73.32%
- DSCR
- 4.26
- GRM
- 2.6
CMA / ARV
- ARV (on-the-fly)
- $61,320
- Comps found
- 9
Show comp detail 9 sales within ~0.75 mi
| Address | Dist | Beds/Ba | Sqft | Sold | Price | $/sf | Match |
|---|---|---|---|---|---|---|---|
| 5121 Molton Gray Dr | 0.03mi | 2/1.0 | 1,040 (+2%) | 13mo | $33,500 | $32 | 85 |
| 1845 Collier Dr | 0.58mi | 2/1.0 | 1,016 (-1%) | 9mo | $43,500 | $43 | 64 |
| 510 Basie Ave | 0.54mi | 3/2.0 (+1) | 1,032 (+1%) | 4mo | $75,000 | $73 | 61 |
| 5741 King Dr | 0.50mi | 3/1.0 (+1) | 1,009 (-1%) | 14mo | $45,000 | $45 | 58 |
| 1841 Stone Rd | 0.61mi | 3/1.0 (+1) | 992 (-3%) | 4mo | $60,000 | $60 | 58 |
| 5737 King Dr | 0.49mi | 3/1.5 (+1) | 1,056 (+3%) | 15mo | $43,000 | $41 | 52 |
| 724 Illinois Rd | 0.75mi | 3/1.5 (+1) | 1,008 (-1%) | 8mo | $110,000 | $109 | 49 |
| 1022 Herring St | 0.70mi | 3/1.0 (+1) | 1,000 (-2%) | 14mo | $139,000 | $139 | 47 |
| 1808 Collier Dr | 0.68mi | 2/1.0 | 1,174 (+15%) | 11mo | $83,000 | $71 | 34 |
Match score weights: distance 35% · size 25% · config 20% · recency 20%. Top-matched comps best support the ARV.
Projected returns pro-forma
-3.0% appreciation · 0.0% rent growth · sell at horizon
- IRR
- 69.5%
- Equity multiple
- 3.98×
- Total profit
- $27,996
- Equity at exit
- $4,995
- IRR
- 72.7%
- Equity multiple
- 7.34×
- Total profit
- $59,499
- Equity at exit
- $2,896
Cash invested: $9,380 (down + closing). Projections, not guarantees.
Landlord ↔ Tenant lean methodology
- Overall (STATE)
- 90 Strongly Landlord-Friendly
- State Alabama
- 90 Strongly Landlord-Friendly · R+15
- County
- — inherits STATE
- City
- — inherits STATE
ZIP-level market 35228
- Home prices YoY
- -3.5%
- Rents YoY
- -1.5%
- Active inventory
- 87
- Price-to-rent
- 2.6×
Monthly cashflow live
- Estimated rent
- $1,062 high interval (Pro) →
- Mortgage (P&I)
- −$176
- Tax from tax record
- −$76 /mo · $918/yr
- Insurance
- −$14
- HOA
- −$0
- Vacancy / Maint / Mgmt
- −$223
- Net cashflow
- $573
Break-even live
UW: 25.0% down · 7.5% · 30yr · 1.5% tax · 5.0% vac · 8.0% maint · 8.0% mgmt
Financing live
Cash to close
- Down payment
- $8,375
- Closing costs
- $1,005
- Reserves months
- —
- Total cash needed
- —
Loan-product check · same deal, 3 products live
Conventional
25% down · 7.5% · 30yr
- Down + closing
- —
- Monthly P&I
- —
- Monthly cashflow
- —
- DSCR
- —
- Eligible?
- —
Personal DTI + credit; lowest rate.
DSCR
20% down · 8.5% · 30yr
- Down + closing
- —
- Monthly P&I
- —
- Monthly cashflow
- —
- DSCR
- —
- Eligible?
- —
No personal income docs; deal must DSCR.
Hard money
10% down · 12.0% · 12mo
- Down + closing
- —
- Monthly P&I
- —
- Monthly cashflow
- —
- DSCR
- —
- Eligible?
- —
Short-term bridge; refi at stabilization.
Rent comps 40 comps
| Address | Beds | Baths | Sqft | Rent | $/sqft | DOM | Units | Dist |
|---|---|---|---|---|---|---|---|---|
| 925 Woodward Rd Birmingham, AL | 2.0 | 2.0 | 1104 | $950 | $0.86 | 43d | 1 | 0.75mi |
| 1721 Collier Dr Birmingham, AL | 2.0 | 1.0 | 925 | $800 | $0.86 | 43d | 1 | 0.75mi |
| 923 Woodward Rd Birmingham, AL | 3.0 | 1.0 | 1273 | $1,200 | $0.94 | 23d | 1 | 0.75mi |
| 36 Wilkes Cir Birmingham, AL | 2.0 | 1.0 | 762 | $875 | $1.15 | 43d | 1 | 0.78mi |
| 537 Grant St Birmingham, AL | 3.0 | 1.0 | 1444 | $1,200 | $0.83 | 23d | 1 | 0.78mi |
| 517 Grant St Birmingham, AL | 3.0 | 1.0 | 912 | $850 | $0.93 | 23d | 1 | 0.80mi |
| 830 Burwell St Birmingham, AL | 3.0 | 1.5 | 1011 | $1,200 | $1.19 | 43d | 1 | 0.90mi |
| 222 4th Ave Birmingham, AL | 3.0 | 1.0 | 1300 | $1,050 | $0.81 | 43d | 1 | 0.91mi |
| 5704 14th St S Bessemer, AL | 2.0 | 2.0 | 1024 | $850 | $0.83 | 15d | 1 | 0.98mi |
| 5709 13th St S Bessemer, AL | 3.0 | 1.0 | 1120 | $1,200 | $1.07 | 43d | 1 | 1.06mi |
| 120 Parkwood St Birmingham, AL | 3.0 | 1.5 | 1224 | $1,150 | $0.94 | 15d | 1 | 1.12mi |
| 6001 Ivy St Birmingham, AL | 3.0 | 1.0 | 906 | $950 | $1.05 | 43d | 1 | 1.14mi |
| 733 Glen Ridge Dr Fairfield, AL | 3.0 | 1.0 | 1225 | $1,378 | $1.12 | 1d | 1 | 1.19mi |
| 520 Brewer Dr Bessemer, AL | 3.0 | 1.0 | 1040 | $1,100 | $1.06 | 3d | 1 | 1.25mi |
| 4029 Walnut Ave SW Birmingham, AL | 2.0 | 1.0 | 1300 | $1,369 | $1.05 | 3d | 1 | 1.28mi |
| 412 Fairfax Dr Unit 400-1 Fairfield, AL | 2.0 | 1.5 | 935 | $1,175 | $1.26 | 2d | 1 | 1.29mi |
| 412 Fairfax Dr Unit 424-10 Fairfield, AL | 3.0 | 1.5 | 1035 | $1,275 | $1.23 | 11d | 1 | 1.29mi |
| 412 Fairfax Dr Unit 400-12 Fairfield, AL | 2.0 | 1.0 | 888 | $915 | $1.03 | 10d | 1 | 1.29mi |
| 412 Fairfax Dr Unit 416-11 Fairfield, AL | 2.0 | 1.5 | 935 | $975 | $1.04 | 2d | 1 | 1.29mi |
| 412 Fairfax Dr Unit 424-3 Fairfield, AL | 3.0 | 1.5 | 1035 | $1,200 | $1.16 | 10d | 1 | 1.29mi |
| 412 Fairfax Dr Unit 436-11 Fairfield, AL | 2.0 | 1.5 | 935 | $910 | $0.97 | 10d | 1 | 1.29mi |
| 412 Fairfax Dr Unit 436-10 Fairfield, AL | 2.0 | 1.0 | 888 | $890 | $1.00 | 10d | 1 | 1.29mi |
| 412 Fairfax Dr Unit 444-12 Fairfield, AL | 2.0 | 1.0 | 888 | $910 | $1.02 | 10d | 1 | 1.29mi |
| 1433 Rayfield Dr Birmingham, AL | 3.0 | 1.0 | 1064 | $950 | $0.89 | 43d | 1 | 1.29mi |
| 4120 George Ave SW Birmingham, AL | 2.0 | 1.0 | 944 | $850 | $0.90 | 23d | 1 | 1.30mi |
| 4009 Grasselli Ave SW Birmingham, AL | 3.0 | 1.0 | 875 | $900 | $1.03 | 23d | 1 | 1.30mi |
| 603 11th Ave Birmingham, AL | 3.0 | 1.0 | 1289 | $1,100 | $0.85 | 43d | 1 | 1.33mi |
| 1441 Creel St Birmingham, AL | 3.0 | 2.0 | 1319 | $1,275 | $0.97 | 3d | 1 | 1.36mi |
| 605 10th Ave Birmingham, AL | 3.0 | 1.0 | 1060 | $850 | $0.80 | 43d | 1 | 1.36mi |
| 1412 Woodward Rd Birmingham, AL | 3.0 | 1.0 | 1220 | $1,203 | $0.99 | 15d | 1 | 1.37mi |
| 407 Fairfax Dr Fairfield, AL | 1.0 | 1.5 | 850 | $1,160 | $1.36 | 43d | 2 | 1.38mi |
| 5912 Owen St Bessemer, AL | 3.0 | 1.5 | 1192 | $1,300 | $1.09 | 43d | 1 | 1.42mi |
| 616 Rutledge Dr Birmingham, AL | 3.0 | 1.0 | 1416 | $1,095 | $0.77 | 21d | 1 | 1.43mi |
| 3729 Pine Ave SW Birmingham, AL | 3.0 | 1.0 | 1067 | $1,100 | $1.03 | 21d | 1 | 1.45mi |
| 806 12th Ave Birmingham, AL | 3.0 | 1.0 | 1262 | $1,075 | $0.85 | 43d | 1 | 1.45mi |
| 3736 Oak Ave SW Birmingham, AL | 3.0 | 2.0 | 984 | $1,050 | $1.07 | 23d | 1 | 1.46mi |
| 608 5th Ave Midfield, AL | 3.0 | 1.0 | 1241 | $795 | $0.64 | 21d | 1 | 1.47mi |
| 546 Selma Rd Bessemer, AL | 3.0 | 1.0 | 888 | $900 | $1.01 | 43d | 1 | 1.47mi |
| 1376 Creel Ct Birmingham, AL | 3.0 | 1.0 | 1008 | $1,000 | $0.99 | 43d | 1 | 1.47mi |
| 3729 Maple Ave SW Birmingham, AL | 3.0 | 2.0 | 1008 | $1,200 | $1.19 | 43d | 1 | 1.49mi |
Listing history 5 events
-
2025-05-06status Pending
-
2025-04-02historical Contingent
-
2025-03-25price $33,500
-
2025-02-24$69,500 Active
-
1995-08-31soldstatus $23,000
ⓘ Source: listings_history table (triggers on properties + properties_extension) + one-shot
backfill from property_details.listing_events for pre-trigger history.
Tax reassessment forecast AL · Resets to sale price
- Current annual tax
- $918 · $76/mo
- Projected year-2 tax
- $918 · $76/mo
- Expected delta
- $0/yr ($0/mo · 0.0%)
ⓘ Screening estimate from a state-policy table — verify with the county assessor before closing.
Climate risk First Street
- Flood 1/10 Low FEMA zone X (unshaded) · 0% chance over 30 yrs
- Wildfire 4/10 Moderate
- Heat 7/10 Severe 7 d/yr ≥108°F today · 20 d/yr by 30 yrs out
- Wind 6/10 Major 27% chance of damaging wind over 30 yrs
- Air quality 3/10 Moderate 2 unhealthy d/yr today · 5 by 30 yrs out
Nearby sold comps map
Loading sold comps map…
Walkable amenities ~0.75 mi
Loading nearby amenities…
Taxation est. · year 1
- Rental income
- $12,748
- − Mortgage interest
- −$1,877
- − Property taxes
- −$918
- − Insurance
- −$168
- − Repairs & maintenance
- −$1,020
- − Management
- −$1,020
- − Depreciation
- −$975
- Taxable income
- $6,772
- Est. tax owed @ 24.0%
- −$1,625
- After-tax cash flow
- $5,252/yr
For passive investors: Depreciation is non-cash, so a rental often shows a tax loss while cash-flowing — sheltering income. Rental losses are passive: they offset passive income freely, and up to $25,000/yr can offset ordinary (W-2) income if you actively participate and your MAGI is under $100k (phasing out to $0 by $150k); unused losses carry forward. On sale, claimed depreciation is recaptured at up to 25%, and gains may owe capital-gains tax (a 1031 exchange can defer both). Figures are a year-1 estimate at your 24.0% rate — not tax advice; consult a CPA.
Schools (NCES district)
- District
- Birmingham City
- NCES district ID
- 0100390
- Math proficiency
- 4% ▼ -17.00%
- Reading proficiency
- 20% ▼ -4.00%
- Median HH income
- $31,988
- Composite
- 9.49/100
- National rank
- #9850
- State rank
- #116 of 129 in AL
Livability — Birmingham
- Score
- 67/100
- State rank
- #78
- US rank
- #10412
Category grades
Schools grade is shown separately in the Schools card above.
Census & demographics
- Census place
- Birmingham, AL
- County
- Jefferson County · 527,445 people
- City population
- 210,422
- Metro
- Birmingham-Hoover, AL
- Population (ZIP)
- 10,216
- Household income
- $50,815
- Rent vs Own
- Severe rent burden
- 456.0
Population outlook (Jefferson County) Hauer SSP2
- Today (2025)
- 669,185 people
- By 2030
- 669,694 · +0.1%
- By 2040
- 661,388 · -1.2%
- By 2050
- 643,086 · -3.9%
- By 2075
- 577,267 · -13.7%
- By 2100
- 474,758 · -29.1%
Race, ethnicity, and origin ACS 2023
- Neighborhood character
- Predominantly Black (89%)
- Race & ethnicity
- Black 89% Hispanic / Latino 5% Two or more races 5% White 5%
- Foreign-born
- 2% · Canada
- Languages at home
- 95% English-only · Spanish 5%
Political lean MEDSL · Jefferson
- 2024 margin
- D (+10.4) · D 54.6% · R 44.2% · Other 1.2%
- 2008→2024 swing
- +5.4pp toward D · 2008: 5.1pp · 2024: 10.4pp
- All cycles
- 2024: D+10.4 2020: D+13.2 2016: D+7.2 2012: D+6.0 2008: D+5.1
Not yet ingested
- Civics
- —
Market trends
- HPI YoY
- ▼ -4.84%
- Current HPI
- 134.8633
- Rent YoY
- ▼ -1.47%
- Metro
- Birmingham-Hoover, AL
- State GDP YoY
- ▲ 2.94%
- F500 in state
- 4
Industry mix (Fortune 500 HQ in AL)
| Industry | F500 HQs | Revenue |
|---|---|---|
| Financial Services | 1 | $8B |
|
||
| Healthcare | 1 | $5B |
|
||
Price history
+45.7% since first listed5 events — show timeline
- 2025-05-06 Pending — Greater Alabama MLS
- 2025-04-02 Contingent — Greater Alabama MLS
- 2025-03-25 Price Changed $33,500 Greater Alabama MLS
- 2025-02-24 Listed $69,500 Greater Alabama MLS
- 1995-08-31 Sold (Public Records) $23,000 Public Records
Property tax history
+3.2%/yrLatest (2025): $918 · +6.9% YoY. Source: county tax records.
Cash-flow waterfall
monthlySold comps — $/sqft
last 12 mo · ≤1 miLoading sold comps…