 Duplex
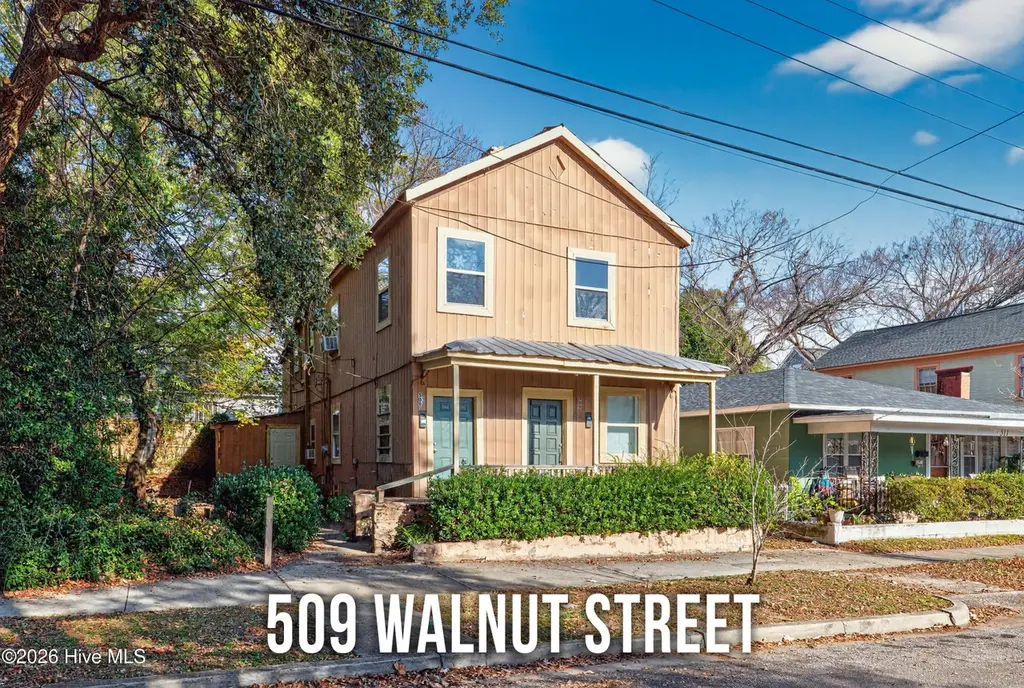
509 Walnut St · Wilmington, NC
Flood risk 1/10 · Minimal
- FEMA flood zone
- X (unshaded)
- Chance of flooding over 30 yrs
- 0.0%
- Est. flood insurance / yr
- $507 – $1,088
Fire risk 4/10 · Minor
- Est. fire insurance / yr
- $906 – $1,684
Heat risk 9/10 · Severe
- Hot days now (above 105°F)
- 7 days/yr
- Hot days in 30 yrs
- 19 days/yr
Wind risk 8/10 · Major
- Chance of severe wind over 30 yrs
- 99.0%
Air-quality risk 2/10 · Minimal
- Unhealthy air days now
- 1 days/yr
- Unhealthy air days in 30 yrs
- 1 days/yr
Risk factors via First Street. Map © Google.
Why this score? — see what drove the C grade
The composite is a weighted blend of 9 inputs, each scored 0–100. Each bar is that input's sub-score; the figure is the points it added to the 100-point composite (weight × sub-score).
- Cash flow +25.5/30.0
- DSCR +8.5/10.0
- ARV discount +7.5/15.0
- 1% rule +5.6/10.0
- Schools +4.3/10.0
- Livability +3.5/5.0
- Condition / age +2.5/5.0
- Rent growth +2.4/5.0
- Appreciation +0.0/10.0
$349,000
🖨 Deal sheet 📄 Offer letter ✓ Due diligence
Multi-family units
County records classify this as Multi-Family (2-4 Unit). Listing-text estimate: 2 units. confirmed
Listing remarks
This prime real estate opportunity in Downtown Wilmington, NC features a duplex with 3 bedrooms and 1.5 bathrooms in one unit and 2 Bedroom and 1 bath in the other. . Located in a high-demand area, this property is ideal for investors seeking robust rental yields or owner-occupants looking to live in one unit while generating income from the other.
Key facts
- 3,223 sq ft lot
- Built 1920
- Listed 74 days
Property features AI
Finance
- Financial info: Income-producing property with multiple rented units (listed rents: 2-bed units ~$880; 3-bed units ~$1,500)
Exterior
- Parking: On-street parking
- Utilities: Public water; Electricity connected; Sewer connected; Water connected
- Home design: Duplex (residential income); Two-story
- Construction: Aluminum siding and frame construction
- Exterior features: Covered front porch; Back yard fencing; Has a view; Shingle roof
Interior
- Kitchen: Electric oven; Refrigerator
- Bedrooms: Multiple units: 2-bedroom and 3-bedroom apartments (unfurnished)
- Flooring: Tile
- Heating & cooling: Baseboard heating (electric); Wall/window air conditioning units
- Interior features: Ceiling fans
- Laundry & utility: Washer hookup
Neighborhood map
What this means for you Summary
Snapshot
- This is a 2 × 3.0-bed/1.5-bath units multifamily listed at $349k.
Deal economics
- At list price, monthly cash flow is $817 ($10k/yr) — positive. Per door: $409/mo.
- The deal already cash-flows at list — no discount required.
- Meets the 1% rule at list price ($4k rent vs $349k).
- Recommended offer: $328k (6.0% below list) — sets the bar for market timing.
- Cap rate 9.1% vs local median 2.6% in Wilmington — top-decile yield for the area; either an underpriced asset or a hidden risk that comps aren't pricing in. Stress-test before assuming the spread holds.
Location & tenants
- Location reads 70/100 on livability (#142 in NC) — a middle-class / working-renter tenant base. Strengths: health & safety A+, cost of living B+, housing B+; Watch: amenities C-, employment C-, crime F.
- New Hanover County Schools (urban): math 48% / reading 53% proficiency, ranked #61 of 178 in NC (top 34%) — acceptable for families but not a draw, mixed tenant base, ~2y average lease.
- Zoned schools: A H Snipes Academy of Arts/Des (math 17% / reading 22%, grade F, #1,242 of 1,410 statewide, top 90%, 377 students, 99% FRL); Williston Middle (math 17% / reading 30%, grade F, #402 of 475 statewide, top 85%, 683 students, 100% FRL); New Hanover High (math 60% / reading 53%, grade C, #261 of 535 statewide, top 49%, 1,466 students, 100% FRL) — zoned schools average 100% FRL vs 42% district-wide (58 pts higher); higher-poverty schools than district average — tighter screening recommended.
- Zoned-school proficiency averages 33% at this address vs 50% district-wide (-17 pts) — the specific schools serving this property underperform the New Hanover County Schools average; the district grade overstates school quality for this exact location.
- Market conditions: Rents soft (-0.5%/yr); 279 active listings in the ZIP; 10 comparable units currently listed for rent nearby; rentals at typical pace (median 21d on market — plan ~3-4 weeks tenant-placement turnaround); 2,581 units permitted in New Hanover County in 2024 (1,185 in 5+ unit buildings).
- At $3,686/mo this rent would consume 76% of the median local household income ($58k/yr) (locally 1696% of renters already pay >50% of income on rent) — very limited rent-growth headroom before tenants either downsize or default.
Forward outlook
- Local home prices are declining (-3.0%/yr); year-one equity from $2k of loan paydown is wiped out by about $10k of value loss. Plan a longer hold.
- New Hanover County population projected at +37% by 2050 — long-run rental-demand tailwind backs the buy-and-hold thesis.
Negotiation context
- It's been on market 74 days — a 6% lower offer ($328k) is reasonable based on typical stale-listing flexibility.
- 2 sale attempts with the ask held roughly flat each time — persistent listings suggest the price (not the market) is what's stuck; bring a comps-based counter.
Risks & watch-outs
- Watch-outs: built in 1920 — expect roof / HVAC / electrical / plumbing capex.
- Climate carrying-cost: severe wind risk, 99% chance of damaging wind over 30y; extreme-heat days projected 7→19/yr by 2055 (HVAC capex compounding) — expect insurance premiums to compound above CPI over the hold.
Questions for the listing agent
- It's been on market 74 days. Have you received any prior offers? Is the seller open to a 6% concession, seller financing, or rate buy-down credit?
- Can we see the unit-by-unit rent roll, current vacancy, and any below-market leases? What's the average tenancy length?
- What capital expenditures (roof, boiler, parking lot, exteriors) have been made in the last 5 years, and what's planned in the next 2?
- Built in 1920 — when were the roof, HVAC, electrical panel, plumbing, and water heater last replaced?
- Why hasn't it sold? Are there any deal-killer items the seller is aware of (foundation, flood, title, zoning, code violations)?
- Is there a deadline driving the sale (1031 exchange, divorce, estate, relocation)? That informs how much negotiation room exists.
- Crime grade is F in this area — have there been break-ins, vandalism, or insurance claims at this property in the last 3 years? What carrier currently insures it and at what premium?
- What's the average days-on-market for RENTAL listings here right now (not sales)? A rising rental-DOM trend means longer vacancies and softer asking-rent achievability than the comps imply.
- What's the recent tenant-quality profile in this submarket — average credit score on applications, eviction rate, late-payment / NSF rate, and stable-employment percentage? A property-management company in the area should have these aggregated.
- How much new apartment / multifamily construction is in the pipeline within 1–3 miles? Heavy new supply (>2% of stock underway) typically softens rents 12–24 months out; light construction supports rent growth.
Investment metrics
- 1% rule
- 1.06% ✓
- Cap rate
- 9.10%
- Cash-on-cash
- 10.03%
- DSCR
- 1.45
- GRM
- 7.9
CMA / ARV
No comps found within radius.
Projected returns pro-forma
-3.0% appreciation · 0.0% rent growth · sell at horizon
- IRR
- -4.4%
- Equity multiple
- 0.84×
- Total profit
- $-15,453
- Equity at exit
- $52,037
- IRR
- 1.8%
- Equity multiple
- 1.12×
- Total profit
- $11,244
- Equity at exit
- $30,175
Cash invested: $97,720 (down + closing). Projections, not guarantees.
Landlord ↔ Tenant lean methodology
- Overall (STATE)
- 85 Strongly Landlord-Friendly
- State North Carolina
- 85 Strongly Landlord-Friendly · R+3
- County
- — inherits STATE
- City
- — inherits STATE
ZIP-level market 28401
- Rents YoY
- -0.5%
- Active inventory
- 279
- Price-to-rent
- 15.8×
Monthly cashflow live
- Estimated rent
- $3,686 high interval (Pro) →
- Mortgage (P&I)
- −$1,830
- Tax from tax record
- −$119 /mo · $1,431/yr
- Insurance
- −$145
- HOA
- −$0
- Vacancy / Maint / Mgmt
- −$774
- Net cashflow
- $817
Break-even live
2-unit breakdown (identical units grouped — click to expand)
| Units | Beds | Baths | Est. rent |
|---|---|---|---|
| 2× units | 3.0 | 1.5 | $3,686 |
| #1 | 3.0 | 1.5 | $1,843 |
| #2 | 3.0 | 1.5 | $1,843 |
| Total (2 units) | $3,686 | ||
UW: 25.0% down · 7.5% · 30yr · 1.5% tax · 5.0% vac · 8.0% maint · 8.0% mgmt
Financing live
Cash to close
- Down payment
- $87,250
- Closing costs
- $10,470
- Reserves months
- —
- Total cash needed
- —
Loan-product check · same deal, 3 products live
Conventional
25% down · 7.5% · 30yr
- Down + closing
- —
- Monthly P&I
- —
- Monthly cashflow
- —
- DSCR
- —
- Eligible?
- —
Personal DTI + credit; lowest rate.
DSCR
20% down · 8.5% · 30yr
- Down + closing
- —
- Monthly P&I
- —
- Monthly cashflow
- —
- DSCR
- —
- Eligible?
- —
No personal income docs; deal must DSCR.
Hard money
10% down · 12.0% · 12mo
- Down + closing
- —
- Monthly P&I
- —
- Monthly cashflow
- —
- DSCR
- —
- Eligible?
- —
Short-term bridge; refi at stabilization.
Rent comps 10 comps
| Address | Beds | Baths | Sqft | Rent | $/sqft | DOM | Units | Dist |
|---|---|---|---|---|---|---|---|---|
| 1015 Rankin St Unit 1 Wilmington, NC | 3.0 | 2.0 | 2000 | $2,600 | $1.30 | 21d | 1 | 0.38mi |
| 305 Harnett St Wilmington, NC | 4.0 | 3.0 | 2158 | $3,350 | $1.55 | 21d | 1 | 0.47mi |
| 901 Nutt St Wilmington, NC | 3.0 | 1.0–3.0 | 1112 | $5,769 | $5.19 | 13d | 24 | 0.55mi |
| 816 Nixon St Apt D Wilmington, NC | 3.0 | 2.0 | 1270 | $1,650 | $1.30 | 21d | 1 | 0.60mi |
| 1045 N Front St Wilmington, NC | 1.0–3.0 | 1.0–2.0 | 1107 | $2,898 | $2.62 | 13d | 19 | 0.63mi |
| 506 S 7th St Wilmington, NC | 3.0 | 1.0 | 1250 | $1,800 | $1.44 | 13d | 1 | 0.82mi |
| 506 S 7th St Wilmington, NC | 3.0 | 1.0 | 1250 | $1,800 | $1.44 | 21d | 1 | 0.82mi |
| 1419 King St Wilmington, NC | 3.0 | 2.5 | 1389 | $2,200 | $1.58 | 21d | 1 | 1.10mi |
| 1009 S 6th St Wilmington, NC | 3.0 | 1.0 | 1482 | $1,650 | $1.11 | 13d | 1 | 1.27mi |
| 1649 King St Wilmington, NC | 4.0 | 2.5 | 1760 | $2,275 | $1.29 | 21d | 1 | 1.28mi |
Listing history 21 events
-
2026-06-18days on market $349,000 Active 74 DOM
-
2026-06-17days on market $349,000 Active 73 DOM
-
2026-06-16days on market $349,000 Active 72 DOM
-
2026-06-15days on market $349,000 Active 71 DOM
-
2026-06-14days on market $349,000 Active 69 DOM
-
2026-06-13days on market $349,000 Active 68 DOM
-
2026-06-10days on market $349,000 Active 66 DOM
-
2026-06-09days on market $349,000 Active 65 DOM
-
2026-06-08days on market $349,000 Active 64 DOM
-
2026-06-07days on market $349,000 Active 63 DOM
-
2026-06-05days on market $349,000 Active 60 DOM
-
2026-06-03days on market $349,000 Active 59 DOM
-
2026-06-03days on market $349,000 Active 58 DOM
-
2026-05-31days on market $349,000 Active 56 DOM
-
2026-05-30days on market $349,000 Active 55 DOM
-
2026-05-23status Active
-
2026-05-08historical Active Under Contract
-
2026-05-04price $349,000
-
2026-04-05$364,000 Active
-
2017-01-11soldstatus $2,655,000
-
1991-11-01soldstatus $117,000
ⓘ Source: listings_history table (triggers on properties + properties_extension) + one-shot
backfill from property_details.listing_events for pre-trigger history.
Tax reassessment forecast NC · Resets to sale price
- Current annual tax
- $1,431 · $119/mo
- Projected year-2 tax
- $2,862 · $238/mo
- Expected delta
- +$1,431/yr (+$119/mo · 100.0%)
ⓘ Screening estimate from a state-policy table — verify with the county assessor before closing.
Climate risk First Street
- Flood 1/10 Low FEMA zone X (unshaded) · 0% chance over 30 yrs
- Wildfire 4/10 Moderate
- Heat 9/10 Extreme 7 d/yr ≥105°F today · 19 d/yr by 30 yrs out
- Wind 8/10 Severe 99% chance of damaging wind over 30 yrs
- Air quality 2/10 Low 1 unhealthy d/yr today · 1 by 30 yrs out
Nearby sold comps map
Loading sold comps map…
Walkable amenities ~0.75 mi
Loading nearby amenities…
Taxation est. · year 1
- Rental income
- $44,232
- − Mortgage interest
- −$19,549
- − Property taxes
- −$1,431
- − Insurance
- −$1,745
- − Repairs & maintenance
- −$3,539
- − Management
- −$3,539
- − Depreciation
- −$10,153
- Taxable income
- $4,277
- Est. tax owed @ 24.0%
- −$1,026
- After-tax cash flow
- $8,779/yr
For passive investors: Depreciation is non-cash, so a rental often shows a tax loss while cash-flowing — sheltering income. Rental losses are passive: they offset passive income freely, and up to $25,000/yr can offset ordinary (W-2) income if you actively participate and your MAGI is under $100k (phasing out to $0 by $150k); unused losses carry forward. On sale, claimed depreciation is recaptured at up to 25%, and gains may owe capital-gains tax (a 1031 exchange can defer both). Figures are a year-1 estimate at your 24.0% rate — not tax advice; consult a CPA.
Schools (NCES district)
- District
- New Hanover County Schools
- NCES district ID
- 3703330
- Math proficiency
- 48% ▼ -3.00%
- Reading proficiency
- 53% ▬ 0.00%
- Median HH income
- $49,406
- Composite
- 43.13/100
- National rank
- #3081
- State rank
- #61 of 178 in NC
Livability — Wilmington
- Score
- 70/100
- State rank
- #142
- US rank
- #8131
Category grades
Schools grade is shown separately in the Schools card above.
Census & demographics
- Census place
- Wilmington, NC
- County
- New Hanover County · 232,153 people
- City population
- 215,355
- Metro
- Wilmington, NC
- Population (ZIP)
- 22,007
- Household income
- $57,968
- Rent vs Own
- Severe rent burden
- 1696.0
Population outlook (New Hanover County) Hauer SSP2
- Today (2025)
- 259,517 people
- By 2030
- 279,586 · +7.7%
- By 2040
- 318,223 · +22.6%
- By 2050
- 354,831 · +36.7%
- By 2075
- 437,158 · +68.5%
- By 2100
- 486,769 · +87.6%
Race, ethnicity, and origin ACS 2023
- Neighborhood character
- Diverse neighborhood (Simpson 0.61)
- Race & ethnicity
- White 52% Black 33% Hispanic / Latino 9% Two or more races 7%
- Hispanic origin (detail)
- Mexican 5% Puerto Rican 1%
- Common ancestry
- Romanian 2% Serbian 2% Lithuanian 2%
- Foreign-born
- 6% · Canada
- Languages at home
- 91% English-only · Spanish 7% Other Indo-European 1%
Political lean MEDSL · New Hanover
- 2024 margin
- Toss-up / Even · D 49.8% · R 49.1% · Other 1.1%
- 2008→2024 swing
- +2.0pp toward D · 2008: -1.4pp · 2024: 0.6pp
- All cycles
- 2024: D+0.6 2020: D+2.1 2016: R+4.1 2012: R+4.7 2008: R+1.4
Not yet ingested
- Civics
- —
Market trends
- HPI YoY
- ▼ -309.34%
- Current HPI
- 293.4396
- Rent YoY
- ▼ -0.52%
- Metro
- Wilmington, NC
- State GDP YoY
- ▲ 3.28%
- F500 in state
- 26
Industry mix (Fortune 500 HQ in NC)
| Industry | F500 HQs | Revenue |
|---|---|---|
| Financial Services | 2 | $213B |
|
||
| Retail | 2 | $95B |
|
||
| Industrial Conglomerate | 1 | $38B |
|
||
| Metals / Steel | 1 | $35B |
|
||
| Utilities | 1 | $30B |
|
||
| Industrial Machinery | 1 | $19B |
|
||
Price history
+198.3% since first listed6 events — show timeline
- 2026-05-23 Relisted — Hive MLS
- 2026-05-08 Contingent — Hive MLS
- 2026-05-04 Price Changed $349,000 Hive MLS
- 2026-04-05 Listed $364,000 Hive MLS
- 2017-01-11 Sold (Public Records) $2,655,000 Public Records
- 1991-11-01 Sold (Public Records) $117,000 Public Records
Property tax history
+0.4%/yrLatest (2025): $1,431 · +14.7% YoY. Source: county tax records.
Cash-flow waterfall
monthlySold comps — $/sqft
last 12 mo · ≤1 miLoading sold comps…