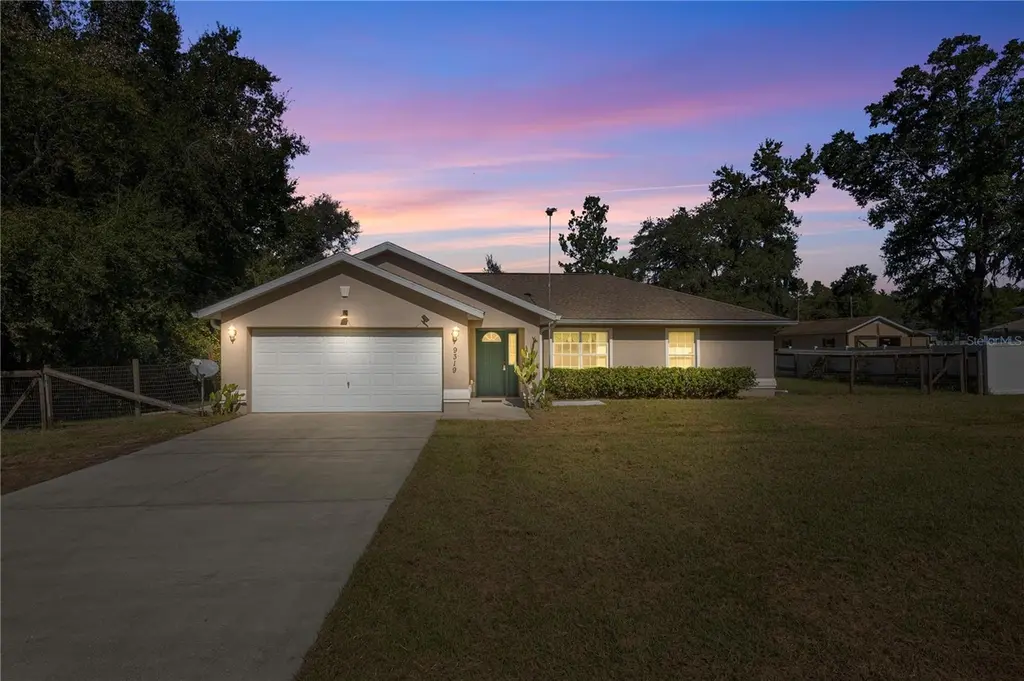
9319 SE 161st Pl · The Villages, FL
Flood risk 9/10 · Severe
- FEMA flood zone
- X (unshaded)
- Chance of flooding over 30 yrs
- 0.99%
- Est. flood insurance / yr
- $507 – $1,088
Fire risk 4/10 · Minor
- Est. fire insurance / yr
- $947 – $1,759
Heat risk 9/10 · Severe
- Hot days now (above 109°F)
- 7 days/yr
- Hot days in 30 yrs
- 21 days/yr
Wind risk 9/10 · Severe
- Chance of severe wind over 30 yrs
- 99.0%
Air-quality risk 3/10 · Minor
- Unhealthy air days now
- 2 days/yr
- Unhealthy air days in 30 yrs
- 2 days/yr
Risk factors via First Street. Map © Google.
Why this score? — see what drove the D grade
The composite is a weighted blend of 9 inputs, each scored 0–100. Each bar is that input's sub-score; the figure is the points it added to the 100-point composite (weight × sub-score).
- ARV discount +14.1/15.0
- Cash flow +10.9/30.0
- Schools +3.6/10.0
- Livability +3.5/5.0
- 1% rule +3.4/10.0
- DSCR +3.2/10.0
- Rent growth +2.5/5.0
- Condition / age +2.5/5.0
- Appreciation +0.0/10.0
$265,000
🖨 Deal sheet (PDF) 📄 Offer letter ✓ Due diligence
Listing remarks MLS
One or more photo(s) has been virtually staged. $10k PRICE DROP!!! Very low price per sq ft!! Welcome to this BEAUTIFUL like-new home in the quiet Orange Blossom Hills subdivision of Summerfield with TONS of square footage and space. This 3 br/2.5 bath home features a split floor plan, decorative crown moulding, granite countertops, and extremely spacious bedrooms. A * huge * bonus room with gorgeous french doors was added to back half of the home with it's own private half bath and entrance! Each bedroom boasts spacious closets for storage. Fully fenced backyard features a concrete patio that has plumbing for a potential outdoor kitchen already! The possibilities are endless. Plenty of space Rain Gutters professionally installed in 2010. Washer and Dryer included in the sale. Refrigerator was purchased Sept 2021.
Key facts
- Private half bath
- Spacious closets
- Split floor plan
Tags
Neighborhood map
What this means for you Summary
Snapshot
- This is a 3-bed/2.0-bath single-family listed at $265k.
Deal economics
- At list price, monthly cash flow is $-183 ($-2k/yr) — negative.
- To cash-flow at today's rent, offer at most $233k (12.2% below list).
- To meet the 1% rule (rent ≥ 1% of price), the offer needs to be $222k (16.2% below list).
- Recommended offer: $222k (16.2% below list) — sets the bar for 1% rule.
Location & tenants
- Location reads 70/100 on livability (#431 in FL) — a middle-class / working-renter tenant base. Strengths: crime A+, housing A, employment B+; Watch: amenities F, commute F, health & safety F.
- Marion (rural): math 42% / reading 43% proficiency, ranked #61 of 73 in FL (top 84%) — families likely to look elsewhere, expect single-tenant / working-renter base with shorter leases; 61% free/reduced lunch — lower-income household profile, screen leases tightly.
- Zoned schools: Harbour View Elementary School (math 41% / reading 38%, grade F, #1,513 of 2,144 statewide, top 73%, 819 students, 71% FRL); Lake Weir Middle School (math 37% / reading 33%, grade F, #416 of 571 statewide, top 74%, 1,207 students, 76% FRL); Belleview High School (math 31% / reading 46%, grade F, #321 of 667 statewide, top 49%, 1,783 students, 56% FRL).
- Market conditions: 713 active listings in the ZIP; 12 comparable units currently listed for rent nearby; rentals at typical pace (median 24d on market — plan ~3-4 weeks tenant-placement turnaround); 7,071 units permitted in Marion County in 2024 (534 in 5+ unit buildings).
- This rent runs 40% of the median local income ($67k/yr) — at the standard rent-burdened threshold; future hikes will face affordability resistance.
Forward outlook
- Local home prices are declining (-3.0%/yr); year-one equity from $2k of loan paydown is wiped out by about $8k of value loss. Plan a longer hold.
- Marion County population projected at +13% by 2050 — modest demand growth; plan on rents tracking national, not racing it.
Negotiation context
- It's been on market 220 days — a 12% lower offer ($233k) is reasonable based on typical stale-listing flexibility.
- 6 sale attempts since 20y ago with the ask held roughly flat each time — persistent listings suggest the price (not the market) is what's stuck; bring a comps-based counter.
- Current owner paid $170k; list at $265k implies a 56% gain — meaningful room to come down on a strong offer.
Risks & watch-outs
- Watch-outs: flood insurance adds $66/mo.
- Climate carrying-cost: severe flood risk; severe wind risk, 99% chance of damaging wind over 30y; extreme-heat days projected 7→21/yr by 2055 (HVAC capex compounding) — expect insurance premiums to compound above CPI over the hold.
Questions for the listing agent
- What do current leases actually rent for vs. the listed asking? Can we see a recent rent roll and the last 12 months of T-12 income?
- It's been on market 220 days. Have you received any prior offers? Is the seller open to a 16% concession, seller financing, or rate buy-down credit?
- What's the actual annual flood-insurance premium (NFIP or private), and is the property in a SFHA with mandatory coverage?
- Why hasn't it sold? Are there any deal-killer items the seller is aware of (foundation, flood, title, zoning, code violations)?
- Is there a deadline driving the sale (1031 exchange, divorce, estate, relocation)? That informs how much negotiation room exists.
- Schools are A-rated — typically a magnet for longer-tenancy family renters. What's the average tenant stay here, and is there a school-zone premium baked into asking?
- The area grade is low — what's the realistic commute time and amenity access for the typical tenant pool here? Any planned neighborhood developments (good or bad) we should know about?
- What's the average days-on-market for RENTAL listings here right now (not sales)? A rising rental-DOM trend means longer vacancies and softer asking-rent achievability than the comps imply.
- What's the recent tenant-quality profile in this submarket — average credit score on applications, eviction rate, late-payment / NSF rate, and stable-employment percentage? A property-management company in the area should have these aggregated.
- How much new for-sale + rental construction is in the pipeline within 1–3 miles? Heavy new supply typically softens prices + rents 12–24 months out; constrained supply supports both.
Investment metrics
- 1% rule
- 0.84% ✗
- Cap rate
- 5.77%
- Cash-on-cash
- -1.88%
- DSCR
- 0.92
- GRM
- 9.9
CMA / ARV
- ARV (median comp)
- $310,637
- List price
- $265,000
- Delta
- -14.69%
- Verdict
- UNDERPRICED
- Comps
- 20 within 1.0 mi
Show comp detail 12 sales within ~0.75 mi
| Address | Dist | Beds/Ba | Sqft | Sold | Price | $/sf | Match |
|---|---|---|---|---|---|---|---|
| 9367 SE 163rd St | 0.17mi | 4/3.0 (+1) | 2,046 (+8%) | 8mo | $340,000 | $166 | 64 |
| 10263 SE 161st St | 0.32mi | 4/2.0 (+1) | 1,828 (-4%) | 19mo | $316,989 | $173 | 58 |
| 15831 SE 89th Ter | 0.47mi | 3/2.0 | 1,806 (-5%) | 16mo | $285,000 | $158 | 56 |
| 9224 SE 168th Cook Pl | 0.75mi | 3/2.0 | 1,788 (-6%) | 1mo | $380,000 | $213 | 54 |
| 9270 SE 157th Pl | 0.37mi | 3/3.0 | 1,630 (-14%) | 1mo | $282,999 | $174 | 54 |
| 9319 SE 157th St | 0.44mi | 3/2.0 | 1,710 (-10%) | 13mo | $295,000 | $173 | 51 |
| 9232 SE 168th Cook Pl | 0.74mi | 3/2.0 | 1,733 (-9%) | 1mo | $355,000 | $205 | 50 |
| 16247 SE 94th Ter | 0.18mi | 4/2.0 (+1) | 2,169 (+14%) | 18mo | $345,950 | $159 | 48 |
| 15664 SE 97th Ave | 0.61mi | 3/2.0 | 1,738 (-9%) | 11mo | $420,000 | $242 | 48 |
| 15642 SE 97th Ave | 0.61mi | 3/2.0 | 1,754 (-8%) | 19mo | $335,000 | $191 | 43 |
| 16356 SE 87th Ave | 0.69mi | 3/2.0 | 1,621 (-15%) | 3mo | $233,000 | $144 | 40 |
| 8660 SE 159th Pl | 0.71mi | 4/2.5 (+1) | 1,716 (-10%) | 8mo | $205,000 | $119 | 37 |
Match score weights: distance 35% · size 25% · config 20% · recency 20%. Top-matched comps best support the ARV.
Projected returns pro-forma
-3.0% appreciation · 3.0% rent growth · sell at horizon
- IRR
- -21.2%
- Equity multiple
- 0.27×
- Total profit
- $-54,469
- Equity at exit
- $39,512
- IRR
- -14.6%
- Equity multiple
- 0.16×
- Total profit
- $-62,003
- Equity at exit
- $22,912
Cash invested: $74,200 (down + closing). Projections, not guarantees.
Landlord ↔ Tenant lean methodology
- Overall (STATE)
- 87 Strongly Landlord-Friendly
- State Florida
- 87 Strongly Landlord-Friendly · R+3
- County
- — inherits STATE
- City
- — inherits STATE
ZIP-level market 34491
- Home prices YoY
- -35.0%
- Active inventory
- 713
- Price-to-rent
- 9.9×
Monthly cashflow live
- Estimated rent
- $2,220 high interval (Pro) →
- Mortgage (P&I)
- −$1,390
- Tax from tax record
- −$370 /mo · $4,437/yr
- Insurance
- −$110
- Flood insurance flood zone
- −$66 /mo · $798/yr
- HOA
- −$0
- Lot rent
- −$0
- Vacancy / Maint / Mgmt
- −$466
- Net cashflow
- $-183
Break-even live
Sensitivity live
| Price | -10% $-33 | -5% $-108 | +0% $-183 | +5% $-258 | +10% $-333 |
|---|---|---|---|---|---|
| Rent | -10% $-358 | -5% $-270 | +0% $-183 | +5% $-95 | +10% $-7 |
| Rate | -1.0pp $-49 | -0.5pp $-115 | base $-183 | +0.5pp $-251 | +1.0pp $-321 |
UW: 25.0% down · 7.5% · 30yr · 1.5% tax · 5.0% vac · 8.0% maint · 8.0% mgmt
Financing live
Cash to close
- Down payment
- $66,250
- Closing costs
- $7,950
- Reserves months
- —
- Total cash needed
- —
Loan-product check · same deal, 3 products live
Conventional
25% down · 7.5% · 30yr
- Down + closing
- —
- Monthly P&I
- —
- Monthly cashflow
- —
- DSCR
- —
- Eligible?
- —
Personal DTI + credit; lowest rate.
DSCR
20% down · 8.5% · 30yr
- Down + closing
- —
- Monthly P&I
- —
- Monthly cashflow
- —
- DSCR
- —
- Eligible?
- —
No personal income docs; deal must DSCR.
Hard money
10% down · 12.0% · 12mo
- Down + closing
- —
- Monthly P&I
- —
- Monthly cashflow
- —
- DSCR
- —
- Eligible?
- —
Short-term bridge; refi at stabilization.
Rent comps 12 comps
| Address | Beds | Baths | Sqft | Rent | $/sqft | DOM | Units | Dist |
|---|---|---|---|---|---|---|---|---|
| 9195 SE 163rd St Summerfield, FL | 3.0 | 2.0 | 1410 | $1,800 | $1.28 | 23d | 1 | 0.18mi |
| 9393 SE 158th Pl Summerfield, FL | 4.0 | 3.0 | 1990 | $2,500 | $1.26 | 23d | 1 | 0.33mi |
| 16475 SE 89th Ter Summerfield, FL | 4.0 | 3.0 | 1942 | $2,700 | $1.39 | 16d | 1 | 0.41mi |
| 9871 SE 161st Lane Rd Unit 0 Summerfield, FL | 4.0 | 2.0 | 1827 | $2,200 | $1.20 | 23d | 1 | 0.60mi |
| 9523 SE 168th Maplesong Ln The Villages, FL | 3.0 | 2.0 | 1265 | $1,975 | $1.56 | 23d | 1 | 0.74mi |
| 8721 SE 157th St Summerfield, FL | 3.0 | 2.0 | 1236 | $1,650 | $1.33 | 23d | 1 | 0.76mi |
| 8364 SE 158th Pl Summerfield, FL | 3.0 | 2.0 | 1374 | $2,000 | $1.46 | 16d | 1 | 0.97mi |
| 8352 SE 158th Pl Summerfield, FL | 3.0 | 2.0 | 1232 | $2,000 | $1.62 | 16d | 1 | 0.99mi |
| 10326 SE 162nd Place Rd Summerfield, FL | 3.0 | 2.0 | 1419 | $2,300 | $1.62 | 16d | 1 | 1.02mi |
| 8198 SE 164th Pl Summerfield, FL | 3.0 | 1.5 | 1965 | $2,650 | $1.35 | 23d | 1 | 1.15mi |
| 17199 SE 97th Ter Summerfield, FL | 3.0 | 2.0 | 1404 | $1,990 | $1.42 | 23d | 1 | 1.16mi |
| 17522 SE 95th Cir Summerfield, FL | 2.0 | 2.0 | 1884 | $1,875 | $1.00 | 23d | 1 | 1.39mi |
Listing history 23 events
-
2026-06-22days on market $265,000 Active 220 DOM
-
2026-06-18days on market $265,000 Active 217 DOM
-
2026-06-17days on market $265,000 Active 216 DOM
-
2026-06-16days on market $265,000 Active 215 DOM
-
2026-06-15days on market $265,000 Active 214 DOM
-
2026-06-14days on market $265,000 Active 212 DOM
-
2026-06-13days on market $265,000 Active 211 DOM
-
2026-06-10days on market $265,000 Active 209 DOM
-
2026-05-31days on market $265,000 Active 208 DOM
-
2026-05-30days on market $265,000 Active 207 DOM
-
2026-04-16price $265,000 827-char remark
Show marketing remark (827 chars)
One or more photo(s) has been virtually staged. $10k PRICE DROP!!! Very low price per sq ft!! Welcome to this BEAUTIFUL like-new home in the quiet Orange Blossom Hills subdivision of Summerfield with TONS of square footage and space. This 3 br/2.5 bath home features a split floor plan, decorative crown moulding, granite countertops, and extremely spacious bedrooms. A * huge * bonus room with gorgeous french doors was added to back half of the home with it's own private half bath and entrance! Each bedroom boasts spacious closets for storage. Fully fenced backyard features a concrete patio that has plumbing for a potential outdoor kitchen already! The possibilities are endless. Plenty of space Rain Gutters professionally installed in 2010. Washer and Dryer included in the sale. Refrigerator was purchased Sept 2021.
-
2026-02-19$275,000 Active 781-char remark
Show marketing remark (781 chars)
One or more photo(s) has been virtually staged. Welcome to this BEAUTIFUL like-new home in the quiet Orange Blossom Hills subdivision of Summerfield with TONS of square footage and space. This 3 br/2.5 bath home features a split floor plan, decorative crown moulding, granite countertops, and extremely spacious bedrooms. A * huge * bonus room with gorgeous french doors was added to back half of the home with it's own private half bath and entrance! Each bedroom boasts spacious closets for storage. Fully fenced backyard features a concrete patio that has plumbing for a potential outdoor kitchen already! The possibilities are endless. Plenty of space Rain Gutters professionally installed in 2010. Washer and Dryer included in the sale. Refrigerator was purchased Sept 2021.
-
2025-11-04$275,000 Active 827-char remark
Show marketing remark (827 chars)
One or more photo(s) has been virtually staged. $10k PRICE DROP!!! Very low price per sq ft!! Welcome to this BEAUTIFUL like-new home in the quiet Orange Blossom Hills subdivision of Summerfield with TONS of square footage and space. This 3 br/2.5 bath home features a split floor plan, decorative crown moulding, granite countertops, and extremely spacious bedrooms. A * huge * bonus room with gorgeous french doors was added to back half of the home with it's own private half bath and entrance! Each bedroom boasts spacious closets for storage. Fully fenced backyard features a concrete patio that has plumbing for a potential outdoor kitchen already! The possibilities are endless. Plenty of space Rain Gutters professionally installed in 2010. Washer and Dryer included in the sale. Refrigerator was purchased Sept 2021.
-
2023-05-31historical
-
2023-05-01price $340,000
-
2022-12-15$349,999 Active
-
2022-12-13historical
-
2022-09-12$385,000 Active
-
2022-08-08historical
-
2022-05-02$425,000 Active
-
2006-11-28soldstatus $170,000
-
2006-11-20soldstatus $170,000
-
2006-06-19$174,900
ⓘ Source: listings_history table (triggers on properties + properties_extension) + one-shot
backfill from property_details.listing_events for pre-trigger history.
Tax reassessment forecast FL · Resets to sale price
- Current annual tax
- $4,437 · $370/mo
- Projected year-2 tax
- $4,437 · $370/mo
- Expected delta
- $0/yr ($0/mo · -0.0%)
ⓘ Screening estimate from a state-policy table — verify with the county assessor before closing.
Climate risk First Street
- Flood 9/10 Extreme FEMA zone X (unshaded) · 99% chance over 30 yrs
- Wildfire 4/10 Moderate
- Heat 9/10 Extreme 7 d/yr ≥109°F today · 21 d/yr by 30 yrs out
- Wind 9/10 Extreme 99% chance of damaging wind over 30 yrs
- Air quality 3/10 Moderate 2 unhealthy d/yr today · 2 by 30 yrs out
Nearby sold comps map
Loading sold comps map…
Walkable amenities ~0.75 mi
Loading nearby amenities…
Taxation est. · year 1
- Rental income
- $26,639
- − Mortgage interest
- −$14,844
- − Property taxes
- −$4,437
- − Insurance
- −$2,122
- − Repairs & maintenance
- −$2,131
- − Management
- −$2,131
- − Depreciation
- −$7,709
- Taxable loss
- −$6,735
- Est. tax savings @ 24.0%
- +$1,617
- After-tax cash flow
- $-574/yr
For passive investors: Depreciation is non-cash, so a rental often shows a tax loss while cash-flowing — sheltering income. Rental losses are passive: they offset passive income freely, and up to $25,000/yr can offset ordinary (W-2) income if you actively participate and your MAGI is under $100k (phasing out to $0 by $150k); unused losses carry forward. On sale, claimed depreciation is recaptured at up to 25%, and gains may owe capital-gains tax (a 1031 exchange can defer both). Figures are a year-1 estimate at your 24.0% rate — not tax advice; consult a CPA.
Schools (NCES district)
- District
- Marion
- NCES district ID
- 1201260
- Math proficiency
- 42% ▼ -7.00%
- Reading proficiency
- 43% ▼ -4.00%
- Median HH income
- $40,015
- Composite
- 35.61/100
- National rank
- #4890
- State rank
- #61 of 73 in FL
Livability — The Villages
- Score
- 70/100
- State rank
- #431
- US rank
- #7363
Category grades
Schools grade is shown separately in the Schools card above.
Census & demographics
- County
- Marion County · 315,796 people
- City population
- 83,973
- Metro
- Ocala, FL
- Population (ZIP)
- 33,318
- Household income
- $66,679
- Rent vs Own
- Severe rent burden
- 256.0
Population outlook (Marion County) Hauer SSP2
- Today (2025)
- 365,905 people
- By 2030
- 376,768 · +3.0%
- By 2040
- 396,555 · +8.4%
- By 2050
- 412,723 · +12.8%
- By 2075
- 446,090 · +21.9%
- By 2100
- 436,193 · +19.2%
Race, ethnicity, and origin ACS 2023
- Neighborhood character
- Predominantly White (77%)
- Race & ethnicity
- White 77% Hispanic / Latino 14% Two or more races 9% Black 4% Asian 2%
- Hispanic origin (detail)
- Mexican 3% Puerto Rican 6% Cuban 1%
- Common ancestry
- Lithuanian 3% Slovak 2% Romanian 2%
- Foreign-born
- 8% · Canada, Vietnam, Jamaica
- Languages at home
- 85% English-only · Spanish 11% Vietnamese 1% French/Haitian/Cajun 1%
Political lean MEDSL · Marion
- 2024 margin
- Solid R (+31.6) · D 33.8% · R 65.5%
- 2008→2024 swing
- -20.0pp toward R · 2008: -11.6pp · 2024: -31.6pp
- All cycles
- 2024: R+31.6 2020: R+25.9 2016: R+26.2 2012: R+16.2 2008: R+11.6
Not yet ingested
- Civics
- —
Market trends
- HPI YoY
- ▼ -107.67%
- Current HPI
- 200.0792
- Rent YoY
- —
- Metro
- Ocala, FL
- State GDP YoY
- ▲ 3.28%
- F500 in state
- 36
Industry mix (Fortune 500 HQ in FL)
| Industry | F500 HQs | Revenue |
|---|---|---|
| Industrial Technology | 2 | $29B |
|
||
| Insurance | 2 | $17B |
|
||
| Retail | 1 | $60B |
|
||
| Technology Distribution | 1 | $58B |
|
||
| Homebuilding | 1 | $35B |
|
||
| Technology Manufacturing | 1 | $35B |
|
||
Price history
+51.5% since first listed13 events — show timeline
- 2026-04-16 Price Changed $265,000 Stellar MLS as Distributed by MLS Grid
- 2026-02-19 Listed $275,000 RACC
- 2025-11-04 Listed $275,000 Stellar MLS as Distributed by MLS Grid
- 2023-05-31 Listing Removed — Stellar MLS as Distributed by MLS Grid
- 2023-05-01 Price Changed $340,000 Stellar MLS as Distributed by MLS Grid
- 2022-12-15 Listed $349,999 Stellar MLS as Distributed by MLS Grid
- 2022-12-13 Listing Removed — Stellar MLS as Distributed by MLS Grid
- 2022-09-12 Listed $385,000 Stellar MLS as Distributed by MLS Grid
- 2022-08-08 Listing Removed — MARMLS
- 2022-05-02 Listed $425,000 MARMLS
- 2006-11-28 Sold (Public Records) $170,000 Public Records
- 2006-11-20 Sold (MLS) $170,000 Stellar MLS as Distributed by MLS Grid
- 2006-06-19 Listed $174,900 Stellar MLS as Distributed by MLS Grid
Property tax history
+7.1%/yrLatest (2025): $4,437 · +9.3% YoY. Source: county tax records.
Cash-flow waterfall
monthlySold comps — $/sqft
last 12 mo · ≤1 miLoading sold comps…