 Duplex
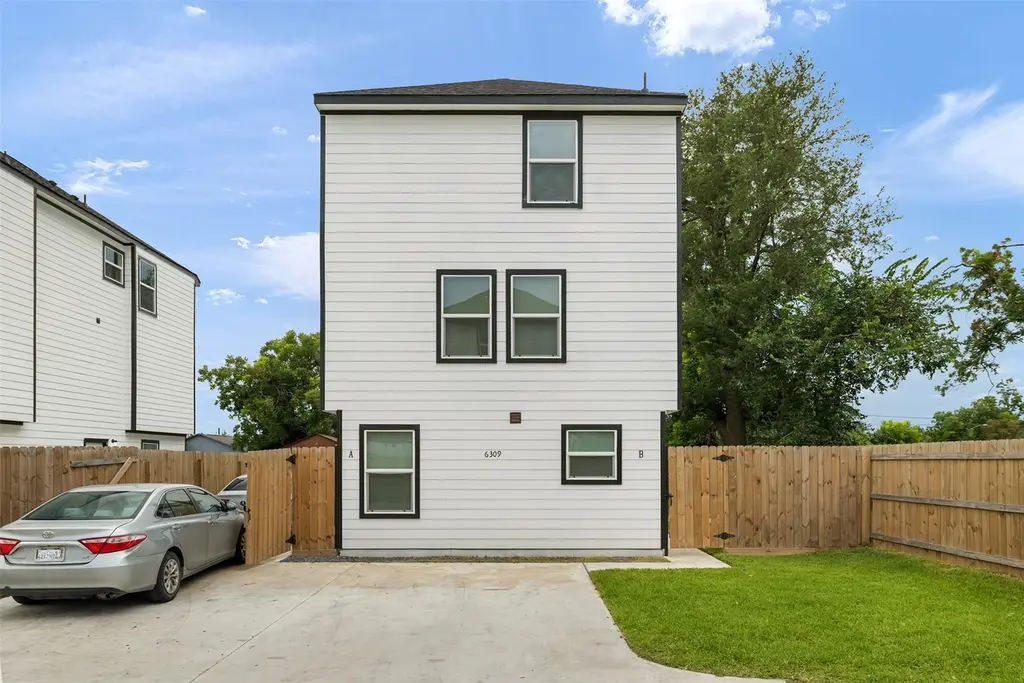
6309 Sandra St · Houston, TX
Flood risk No data
- FEMA flood zone
- —
- Chance of flooding over 30 yrs
- —
- Est. flood insurance / yr
- —
Fire risk No data
- Est. fire insurance / yr
- —
Heat risk No data
- Hot days now (above threshold)
- —
- Hot days in 30 yrs
- —
Wind risk No data
- Chance of severe wind over 30 yrs
- —
Air-quality risk No data
- Unhealthy air days now
- —
- Unhealthy air days in 30 yrs
- —
Risk factors via First Street. Map © Google.
Why this score? — see what drove the C grade
The composite is a weighted blend of 9 inputs, each scored 0–100. Each bar is that input's sub-score; the figure is the points it added to the 100-point composite (weight × sub-score).
- ARV discount +15.0/15.0
- Cash flow +12.7/30.0
- Appreciation +7.6/10.0
- 1% rule +4.6/10.0
- Condition / age +4.0/5.0
- DSCR +3.8/10.0
- Livability +3.7/5.0
- Schools +2.7/10.0
- Rent growth +2.1/5.0
$328,999
🖨 Deal sheet 📄 Offer letter ✓ Due diligence
Multi-family units
County records classify this as Multi-Family (2-4 Unit). Listing-text estimate: 2 units. confirmed
Listing remarks MLS
Modern 2024-built duplex in Houston’s northeast corridor, with both units currently tenant occupied. Ideal for an investors seeking immediate cash flow. Each mirrored unit offers 3 spacious stories, 3 bedrooms, 2 full baths, and a full kitchen with a contemporary layout. Priced competitively to move, don’t miss this turnkey opportunity to add a fresh, income-generating asset to your portfolio.
Key facts
- 3,791 sq ft lot
- Built 2024
- Listed 82 days
Neighborhood map
What this means for you Summary
Snapshot
- This is a 2 × 3-bed/2.0-bath units multifamily listed at $329k. Condition is rated good.
Deal economics
- At list price, monthly cash flow is $-34 ($-405/yr) — negative. Per door: $-17/mo.
- To cash-flow at today's rent, offer at most $323k (1.8% below list).
- To meet the 1% rule (rent ≥ 1% of price), the offer needs to be $316k (4.1% below list).
- Recommended offer: $309k (6.0% below list) — sets the bar for market timing.
- Cap rate 6.2% vs local median 3.2% in Houston — top-decile yield for the area; either an underpriced asset or a hidden risk that comps aren't pricing in. Stress-test before assuming the spread holds.
Location & tenants
- Location reads 74/100 on livability (#184 in TX, #4,771 nationally) — a middle-class / working-renter tenant base. Strengths: amenities A+, cost of living A+, housing A+; Watch: schools D, crime F.
- Houston ISD (urban): math 27% / reading 35% proficiency, ranked #593 of 826 in TX (top 72%) — families likely to look elsewhere, expect single-tenant / working-renter base with shorter leases; 71% free/reduced lunch — lower-income household profile, screen leases tightly.
- Market conditions: Rents soft (-1.6%/yr); 353 active listings in the ZIP; lower-income renter base — watch delinquency; 29,883 units permitted in Harris County in 2024 (8,621 in 5+ unit buildings).
- At $3,155/mo this rent would consume 99% of the median local household income ($38k/yr) (locally 1177% of renters already pay >50% of income on rent) — very limited rent-growth headroom before tenants either downsize or default.
Forward outlook
- In year one you build about $20k of equity ($2k loan paydown + $17k appreciation (5.2% local appreciation)).
- Harris County population projected at +47% by 2050 — long-run rental-demand tailwind backs the buy-and-hold thesis.
- At projected returns (5.2% appreciation + 0.0% rent growth), your $92k cash investment doubles in ~5 years — after that, you're playing with house money.
- By year 2, paydown + projected appreciation supports a ~$31k cash-out refi (75% LTV) — recoverable capital for the next deal without selling this one.
Negotiation context
- It's been on market 82 days — a 6% lower offer ($309k) is reasonable based on typical stale-listing flexibility.
- 4 sale attempts; this cycle's ask has dropped $21k (6%) from the opening price — seller is motivated, your offer sets the floor, not the list.
Questions for the listing agent
- What do current leases actually rent for vs. the listed asking? Can we see a recent rent roll and the last 12 months of T-12 income?
- It's been on market 82 days. Have you received any prior offers? Is the seller open to a 6% concession, seller financing, or rate buy-down credit?
- Can we see the unit-by-unit rent roll, current vacancy, and any below-market leases? What's the average tenancy length?
- What capital expenditures (roof, boiler, parking lot, exteriors) have been made in the last 5 years, and what's planned in the next 2?
- Why hasn't it sold? Are there any deal-killer items the seller is aware of (foundation, flood, title, zoning, code violations)?
- Is there a deadline driving the sale (1031 exchange, divorce, estate, relocation)? That informs how much negotiation room exists.
- Schools are D-rated, which usually means shorter tenancies and higher turnover. Who's the typical renter profile here, and what's been the actual vacancy rate?
- Crime grade is F in this area — have there been break-ins, vandalism, or insurance claims at this property in the last 3 years? What carrier currently insures it and at what premium?
- What's the average days-on-market for RENTAL listings here right now (not sales)? A rising rental-DOM trend means longer vacancies and softer asking-rent achievability than the comps imply.
- What's the recent tenant-quality profile in this submarket — average credit score on applications, eviction rate, late-payment / NSF rate, and stable-employment percentage? A property-management company in the area should have these aggregated.
- How much new apartment / multifamily construction is in the pipeline within 1–3 miles? Heavy new supply (>2% of stock underway) typically softens rents 12–24 months out; light construction supports rent growth.
Investment metrics
- 1% rule
- 0.96% ✗
- Cap rate
- 6.17%
- Cash-on-cash
- -0.44%
- DSCR
- 0.98
- GRM
- 8.7
CMA / ARV
- ARV (median comp)
- $399,174
- List price
- $328,999
- Delta
- -17.58%
- Verdict
- UNDERPRICED
- Comps
- 20 within 1.0 mi
Show comp detail 1 sale within ~0.75 mi
| Address | Dist | Beds/Ba | Sqft | Sold | Price | $/sf | Match |
|---|---|---|---|---|---|---|---|
| 7311 Sandra St | 0.60mi | 6/2.0 | 2,463 (+7%) | 16mo | $419,000 | $170 | 38 |
Match score weights: distance 35% · size 25% · config 20% · recency 20%. Top-matched comps best support the ARV.
Projected returns pro-forma
5.25% appreciation · 0.0% rent growth · sell at horizon
- IRR
- 11.7%
- Equity multiple
- 1.75×
- Total profit
- $69,257
- Equity at exit
- $191,355
- IRR
- 11.7%
- Equity multiple
- 3.10×
- Total profit
- $193,740
- Equity at exit
- $334,391
Cash invested: $92,120 (down + closing). Projections, not guarantees.
Landlord ↔ Tenant lean methodology
- Overall (STATE)
- 87 Strongly Landlord-Friendly
- State Texas
- 87 Strongly Landlord-Friendly · R+5
- County
- — inherits STATE
- City
- — inherits STATE
ZIP-level market 77028
- Home prices YoY
- 2.0%
- Rents YoY
- -1.6%
- Active inventory
- 353
- Price-to-rent
- 17.4×
Monthly cashflow live
- Estimated rent
- $3,155 high interval (Pro) →
- Mortgage (P&I)
- −$1,725
- Tax from tax record
- −$664 /mo · $7,966/yr
- Insurance
- −$137
- HOA
- −$0
- Vacancy / Maint / Mgmt
- −$663
- Net cashflow
- $-34
Break-even live
2-unit breakdown (identical units grouped — click to expand)
| Units | Beds | Baths | Est. rent |
|---|---|---|---|
| 2× units | 3 | 2 | $3,154 |
| #1 | 3 | 2 | $1,577 |
| #2 | 3 | 2 | $1,577 |
| Total (2 units) | $3,155 | ||
UW: 25.0% down · 7.5% · 30yr · 1.5% tax · 5.0% vac · 8.0% maint · 8.0% mgmt
Financing live
Cash to close
- Down payment
- $82,250
- Closing costs
- $9,870
- Reserves months
- —
- Total cash needed
- —
Loan-product check · same deal, 3 products live
Conventional
25% down · 7.5% · 30yr
- Down + closing
- —
- Monthly P&I
- —
- Monthly cashflow
- —
- DSCR
- —
- Eligible?
- —
Personal DTI + credit; lowest rate.
DSCR
20% down · 8.5% · 30yr
- Down + closing
- —
- Monthly P&I
- —
- Monthly cashflow
- —
- DSCR
- —
- Eligible?
- —
No personal income docs; deal must DSCR.
Hard money
10% down · 12.0% · 12mo
- Down + closing
- —
- Monthly P&I
- —
- Monthly cashflow
- —
- DSCR
- —
- Eligible?
- —
Short-term bridge; refi at stabilization.
Listing history 21 events
-
2026-06-17days on market $328,999 Pending 82 DOM
-
2026-06-16days on market $328,999 Pending 81 DOM
-
2026-06-15days on market $328,999 Pending 80 DOM
-
2026-06-13statusdays on market $328,999 Pending 78 DOM
-
2026-06-10days on market $328,999 Active 74 DOM
-
2026-06-08days on market $328,999 Active 73 DOM
-
2026-06-07days on market $328,999 Active 72 DOM
-
2026-06-04days on market $328,999 Active 69 DOM
-
2026-06-01days on market $328,999 Active 66 DOM
-
2026-05-31days on market $328,999 Active 65 DOM
-
2026-04-29price $328,999 408-char remark
Show marketing remark (408 chars)
Modern 2024-built duplex in Houston’s northeast corridor, with both units currently tenant occupied. Ideal for an investors seeking immediate cash flow. Each mirrored unit offers 3 spacious stories, 3 bedrooms, 2 full baths, and a full kitchen with a contemporary layout. Priced competitively to move, don’t miss this turnkey opportunity to add a fresh, income-generating asset to your portfolio.
-
2026-03-27$349,999 Active 408-char remark
Show marketing remark (408 chars)
Modern 2024-built duplex in Houston’s northeast corridor, with both units currently tenant occupied. Ideal for an investors seeking immediate cash flow. Each mirrored unit offers 3 spacious stories, 3 bedrooms, 2 full baths, and a full kitchen with a contemporary layout. Priced competitively to move, don’t miss this turnkey opportunity to add a fresh, income-generating asset to your portfolio.
-
2026-03-19historical
-
2026-01-20historical $1,350
-
2026-01-19$1,350
-
2025-12-10historical $1,550
-
2025-12-02price $1,550
-
2025-11-03$349,999 Active
-
2025-09-28$1,500
-
2024-07-01soldstatus
-
2024-03-22soldstatus
ⓘ Source: listings_history table (triggers on properties + properties_extension) + one-shot
backfill from property_details.listing_events for pre-trigger history.
Tax reassessment forecast TX · Resets to sale price
- Current annual tax
- $7,966 · $664/mo
- Projected year-2 tax
- $7,966 · $664/mo
- Expected delta
- $0/yr ($0/mo · 0.0%)
ⓘ Screening estimate from a state-policy table — verify with the county assessor before closing.
Nearby sold comps map
Loading sold comps map…
Walkable amenities ~0.75 mi
Loading nearby amenities…
Taxation est. · year 1
- Rental income
- $37,860
- − Mortgage interest
- −$18,429
- − Property taxes
- −$7,966
- − Insurance
- −$1,645
- − Repairs & maintenance
- −$3,029
- − Management
- −$3,029
- − Depreciation
- −$9,571
- Taxable loss
- −$5,808
- Est. tax savings @ 24.0%
- +$1,394
- After-tax cash flow
- $989/yr
For passive investors: Depreciation is non-cash, so a rental often shows a tax loss while cash-flowing — sheltering income. Rental losses are passive: they offset passive income freely, and up to $25,000/yr can offset ordinary (W-2) income if you actively participate and your MAGI is under $100k (phasing out to $0 by $150k); unused losses carry forward. On sale, claimed depreciation is recaptured at up to 25%, and gains may owe capital-gains tax (a 1031 exchange can defer both). Figures are a year-1 estimate at your 24.0% rate — not tax advice; consult a CPA.
Condition & rehab AI · 6 photos
This modern 2024-built duplex is in excellent condition with a good condition score of 80. It is currently tenant occupied and ready for immediate cash flow. The property has a good foundation and structure, and the interior and exterior are well-maintained. The highest-ROI updates to increase its value include painting, landscaping, adding smart home features, and upgrading kitchen appliances.
Value-add opportunities
- Both Painting the exterior and interior walls — Fresh paint can enhance curb appeal and interior aesthetics.
- Both Landscaping improvements — A well-maintained yard can increase both resale and rental value.
- Both Adding smart home features — Smart home features can attract tech-savvy buyers and renters.
- Both Upgrading the kitchen appliances — Modern appliances can make the kitchen more appealing to potential buyers and renters.
Renovation cost estimate screening
Value-add ROI direction
- Both Painting the exterior and interior walls — Fresh paint can enhance curb appeal and interior aesthetics. ↑
- Both Landscaping improvements — A well-maintained yard can increase both resale and rental value. ↑
- Both Adding smart home features — Smart home features can attract tech-savvy buyers and renters. ↑
- Both Upgrading the kitchen appliances — Modern appliances can make the kitchen more appealing to potential buyers and renters. ↑
ⓘ Cost ranges are severity-bucket heuristics (US national rule-of-thumb). Get contractor quotes + a written scope before underwriting a rehab budget.
Schools (NCES district)
- District
- Houston ISD
- NCES district ID
- 4823640
- Math proficiency
- 27% ▼ -18.00%
- Reading proficiency
- 35% ▼ -6.00%
- Median HH income
- $46,054
- Composite
- 26.63/100
- National rank
- #7173
- State rank
- #593 of 826 in TX
Livability — Houston
- Score
- 74/100
- State rank
- #184
- US rank
- #4771
Category grades
Schools grade is shown separately in the Schools card above.
Census & demographics
- Census place
- Houston, TX
- County
- Harris County · 4,702,590 people
- City population
- 3,226,434
- Metro
- Houston-The Woodlands-Sugar Land, TX
- Population (ZIP)
- 19,109
- Household income
- $38,357
- Rent vs Own
- Severe rent burden
- 1177.0
Population outlook (Harris County) Hauer SSP2
- Today (2025)
- 5,571,493 people
- By 2030
- 6,089,821 · +9.3%
- By 2040
- 7,142,806 · +28.2%
- By 2050
- 8,185,864 · +46.9%
- By 2075
- 10,574,329 · +89.8%
- By 2100
- 12,109,958 · +117.4%
Race, ethnicity, and origin ACS 2023
- Neighborhood character
- Majority Black (57%)
- Race & ethnicity
- Black 57% Hispanic / Latino 41% Two or more races 15% White 2%
- Hispanic origin (detail)
- Mexican 36%
- Foreign-born
- 13% · Canada
- Languages at home
- 61% English-only · Spanish 38%
Political lean MEDSL · Harris
- 2024 margin
- Lean D (+5.5) · D 52.0% · R 46.4% · Other 1.6%
- 2008→2024 swing
- +3.9pp toward D · 2008: 1.6pp · 2024: 5.5pp
- All cycles
- 2024: D+5.5 2020: D+13.3 2016: D+12.4 2012: D+0.1 2008: D+1.6
Not yet ingested
- Civics
- —
Market trends
- HPI YoY
- ▲ 5.25%
- Current HPI
- 267.7798
- Rent YoY
- ▼ -1.55%
- Metro
- Houston-The Woodlands-Sugar Land, TX
- State GDP YoY
- ▲ 3.95%
- F500 in state
- 110
Industry mix (Fortune 500 HQ in TX)
| Industry | F500 HQs | Revenue |
|---|---|---|
| Energy | 16 | $1,198B |
|
||
| Technology | 5 | $198B |
|
||
| Engineering / Construction | 4 | $72B |
|
||
| Energy Services | 3 | $60B |
|
||
| Utilities | 3 | $41B |
|
||
| Healthcare | 2 | $330B |
|
||
Price history
+21833.3% since first listed11 events — show timeline
- 2026-04-29 Price Changed $328,999 HARMLS
- 2026-03-27 Listed $349,999 HARMLS
- 2026-03-19 Listing Removed — HARMLS
- 2026-01-20 Rental Removed $1,350 HARMLS
- 2026-01-19 Listed for Rent $1,350 HARMLS
- 2025-12-10 Rental Removed $1,550 HARMLS
- 2025-12-02 Price Changed $1,550 HARMLS
- 2025-11-03 Listed $349,999 HARMLS
- 2025-09-28 Listed for Rent $1,500 HARMLS
- 2024-07-01 Sold (Public Records) — Public Records
- 2024-03-22 Sold (Public Records) — Public Records
Property tax history
+1139.8%/yrLatest (2025): $7,966 · +1139.8% YoY. Source: county tax records.
Cash-flow waterfall
monthlySold comps — $/sqft
last 12 mo · ≤1 miLoading sold comps…