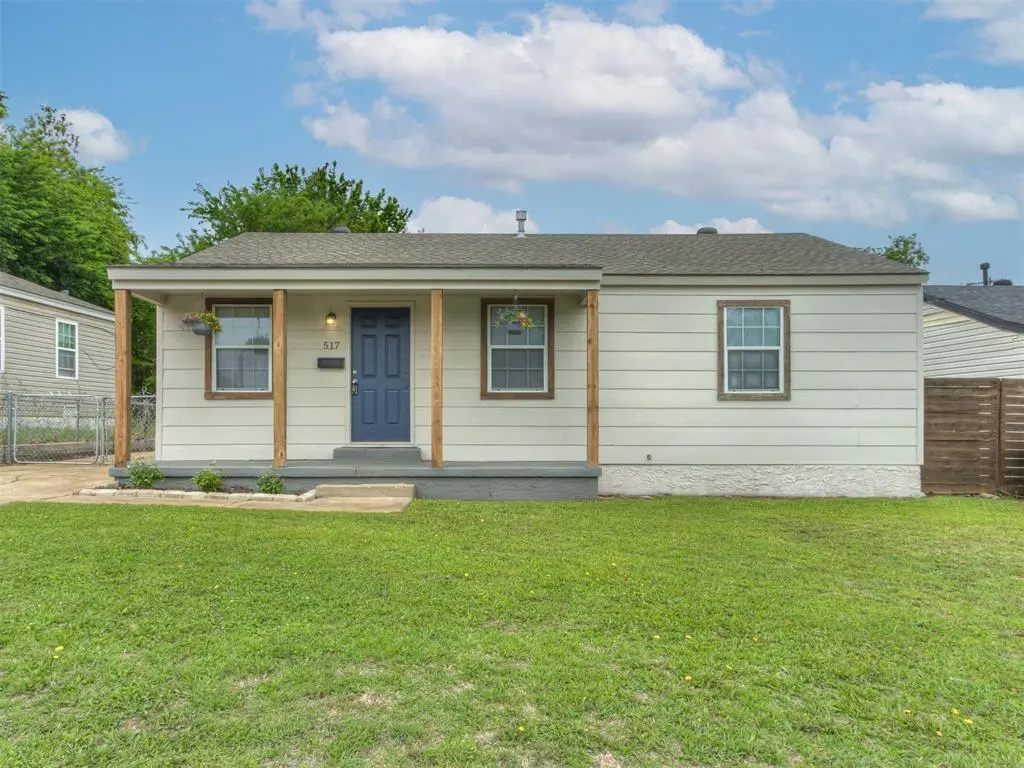
517 E Kerr Dr · Midwest City, OK
Flood risk 1/10 · Minimal
- FEMA flood zone
- X (unshaded)
- Chance of flooding over 30 yrs
- 0.0%
- Est. flood insurance / yr
- $507 – $1,088
Fire risk 1/10 · Minimal
- Est. fire insurance / yr
- $2,463 – $4,575
Heat risk 6/10 · Moderate
- Hot days now (above 107°F)
- 7 days/yr
- Hot days in 30 yrs
- 19 days/yr
Wind risk 2/10 · Minimal
- Chance of severe wind over 30 yrs
- 4.0%
Air-quality risk 2/10 · Minimal
- Unhealthy air days now
- 1 days/yr
- Unhealthy air days in 30 yrs
- 2 days/yr
Risk factors via First Street. Map © Google.
Why this score? — see what drove the D grade
The composite is a weighted blend of 9 inputs, each scored 0–100. Each bar is that input's sub-score; the figure is the points it added to the 100-point composite (weight × sub-score).
- Cash flow +14.9/30.0
- ARV discount +7.5/15.0
- DSCR +4.6/10.0
- 1% rule +4.1/10.0
- Livability +3.6/5.0
- Rent growth +3.2/5.0
- Condition / age +2.5/5.0
- Schools +1.2/10.0
- Appreciation +0.0/10.0
$135,000
🖨 Deal sheet 📄 Offer letter ✓ Due diligence
Listing remarks
Welcome to this charming, move-in ready 3-bedroom, 1-bath home offering comfort, convenience, and everyday functionality. Inside, you’ll find a spacious living room that flows seamlessly into the dining area, creating an inviting space for relaxing or entertaining. Updated cabinets, designer tile backsplash, and solid surface counters in this kitchen. Beautiful luxury vinyl planking flooring extends throughout the living room and all bedrooms, adding warmth and character to the home. Ceiling fans in most rooms provide added comfort. Step outside to a fully fenced backyard, perfect for pets, outdoor activities, or simply enjoying your own private space. Approximately in 2017, updates i
Key facts
- 6,451 sq ft lot
- Garage
- Built 1952
Property features AI
Finance
- Other: Property located in Country Estates addition
- Financial info: Not assumable; Does not apply for loan qualify
- HOA & community: No mandatory association dues
Exterior
- Parking: Concrete parking; 1-car garage
- Utilities: Public utilities
- Home design: Single family residence; One-story; Residential property; Existing property
- Construction: Frame construction; Composition roof; Conventional foundation; Existing (previously built)
- Exterior features: Covered porch; Interior lot
Interior
- Kitchen: Garbage disposal
- Bedrooms: 3 bedrooms
- Flooring: Vinyl flooring
- Bathrooms: 1 full bathroom
- Interior features: Disposal; Smoke alarm
Neighborhood map
What this means for you Summary
Snapshot
- This is a 3-bed/1.0-bath other listed at $135k.
Deal economics
- At list price, monthly cash flow is $39 ($470/yr) — positive.
- The deal already cash-flows at list — no discount required.
- To meet the 1% rule (rent ≥ 1% of price), the offer needs to be $123k (8.8% below list).
- Recommended offer: $123k (8.8% below list) — sets the bar for 1% rule.
Location & tenants
- Location reads 71/100 on livability (#30 in OK) — a middle-class / working-renter tenant base. Strengths: cost of living A+, housing A+, health & safety A; Watch: crime D+, employment D, amenities F.
- Midwest City-Del City (suburban): math 10% / reading 17% proficiency, ranked #231 of 270 in OK (top 86%) — low school quality limits family demand, transient renter base, plan for 1-2y turnover.
- Zoned schools: Country Estates Es (math 12% / reading 17%, grade F, #604 of 845 statewide, top 76%, 335 students, 0% FRL); Midwest City Hs (math 7% / reading 17%, grade F, #359 of 447 statewide, top 80%, 1,368 students, 0% FRL) — zoned schools average 0% FRL vs 57% district-wide (57 pts lower); this property's tenant base skews higher-income than the district average.
- Market conditions: Rents rising (+3.0%/yr); 171 active listings in the ZIP; 40 comparable units currently listed for rent nearby; rentals leasing fast (median 4d on market — plan ~1-2 weeks tenant-placement turnaround); 5,365 units permitted in Oklahoma County in 2024 (569 in 5+ unit buildings).
Forward outlook
- Local home prices are declining (-3.0%/yr); year-one equity from $933 of loan paydown is wiped out by about $4k of value loss. Plan a longer hold.
- Oklahoma County population projected at +41% by 2050 — long-run rental-demand tailwind backs the buy-and-hold thesis.
Negotiation context
- It's been on market 20 days — a 2% lower offer ($133k) is reasonable based on typical stale-listing flexibility.
- Current owner paid $35k; list at $135k implies a 286% gain — meaningful room to come down on a strong offer.
Risks & watch-outs
- Watch-outs: built in 1952 — expect roof / HVAC / electrical / plumbing capex.
- Climate carrying-cost: extreme-heat days projected 7→19/yr by 2055 (HVAC capex compounding) — expect insurance premiums to compound above CPI over the hold.
Questions for the listing agent
- Built in 1952 — when were the roof, HVAC, electrical panel, plumbing, and water heater last replaced?
- Is there a deadline driving the sale (1031 exchange, divorce, estate, relocation)? That informs how much negotiation room exists.
- Schools are D-rated, which usually means shorter tenancies and higher turnover. Who's the typical renter profile here, and what's been the actual vacancy rate?
- Crime grade is D in this area — have there been break-ins, vandalism, or insurance claims at this property in the last 3 years? What carrier currently insures it and at what premium?
- The area grade is low — what's the realistic commute time and amenity access for the typical tenant pool here? Any planned neighborhood developments (good or bad) we should know about?
- What's the average days-on-market for RENTAL listings here right now (not sales)? A rising rental-DOM trend means longer vacancies and softer asking-rent achievability than the comps imply.
- What's the recent tenant-quality profile in this submarket — average credit score on applications, eviction rate, late-payment / NSF rate, and stable-employment percentage? A property-management company in the area should have these aggregated.
- How much new for-sale + rental construction is in the pipeline within 1–3 miles? Heavy new supply typically softens prices + rents 12–24 months out; constrained supply supports both.
Investment metrics
- 1% rule
- 0.91% ✗
- Cap rate
- 6.64%
- Cash-on-cash
- 1.24%
- DSCR
- 1.06
- GRM
- 9.1
CMA / ARV
No comps found within radius.
Projected returns pro-forma
-3.0% appreciation · 2.99% rent growth · sell at horizon
- IRR
- -14.3%
- Equity multiple
- 0.49×
- Total profit
- $-19,375
- Equity at exit
- $20,129
- IRR
- -5.6%
- Equity multiple
- 0.64×
- Total profit
- $-13,634
- Equity at exit
- $11,672
Cash invested: $37,800 (down + closing). Projections, not guarantees.
Landlord ↔ Tenant lean methodology
- Overall (STATE)
- 83 Strongly Landlord-Friendly
- State Oklahoma
- 83 Strongly Landlord-Friendly · R+20
- County
- — inherits STATE
- City
- — inherits STATE
ZIP-level market 73110
- Rents YoY
- 3.0%
- Active inventory
- 171
- Price-to-rent
- 9.1×
Monthly cashflow live
- Estimated rent
- $1,231 high interval (Pro) →
- Mortgage (P&I)
- −$708
- Tax est. 1.5%
- −$169 /mo · $2,025/yr
- Insurance
- −$56
- HOA
- −$0
- Vacancy / Maint / Mgmt
- −$258
- Net cashflow
- $39
Break-even live
UW: 25.0% down · 7.5% · 30yr · 1.5% tax · 5.0% vac · 8.0% maint · 8.0% mgmt
Financing live
Cash to close
- Down payment
- $33,750
- Closing costs
- $4,050
- Reserves months
- —
- Total cash needed
- —
Loan-product check · same deal, 3 products live
Conventional
25% down · 7.5% · 30yr
- Down + closing
- —
- Monthly P&I
- —
- Monthly cashflow
- —
- DSCR
- —
- Eligible?
- —
Personal DTI + credit; lowest rate.
DSCR
20% down · 8.5% · 30yr
- Down + closing
- —
- Monthly P&I
- —
- Monthly cashflow
- —
- DSCR
- —
- Eligible?
- —
No personal income docs; deal must DSCR.
Hard money
10% down · 12.0% · 12mo
- Down + closing
- —
- Monthly P&I
- —
- Monthly cashflow
- —
- DSCR
- —
- Eligible?
- —
Short-term bridge; refi at stabilization.
Rent comps 40 comps
| Address | Beds | Baths | Sqft | Rent | $/sqft | DOM | Units | Dist |
|---|---|---|---|---|---|---|---|---|
| 322 E Kerr Dr Oklahoma City, OK | 3.0 | 1.0 | 1086 | $1,200 | $1.10 | 23d | 1 | 0.16mi |
| 641 E Frolich Dr Oklahoma City, OK | 3.0 | 1.5 | 1032 | $975 | $0.94 | 23d | 1 | 0.25mi |
| 609 E Steed Dr Oklahoma City, OK | 2.0 | 1.0 | 811 | $1,800 | $2.22 | 23d | 1 | 0.25mi |
| 764 E Rose Dr Oklahoma City, OK | 3.0 | 1.0 | 920 | $1,025 | $1.11 | 2d | 1 | 0.35mi |
| 721 E Bouse Dr Oklahoma City, OK | 3.0 | 1.0 | 1002 | $1,225 | $1.22 | 2d | 1 | 0.38mi |
| 8032 E Reno Ave Oklahoma City, OK | 1.0–2.0 | 1.0 | 770 | $850 | $1.10 | 2d | 3 | 0.43mi |
| 312 Bolton Pl Oklahoma City, OK | 3.0 | 1.5 | 756 | $1,099 | $1.45 | 23d | 1 | 0.54mi |
| 121 Gill Dr Oklahoma City, OK | 3.0 | 1.0 | 950 | $1,150 | $1.21 | 1d | 1 | 0.60mi |
| 2105 Maple Dr Midwest City, OK | 3.0 | 2.0 | 1032 | $1,295 | $1.25 | 23d | 1 | 0.63mi |
| 204 Elm St Oklahoma City, OK | 3.0 | 2.0 | 1098 | $1,250 | $1.14 | 23d | 1 | 0.70mi |
| 536 E Northrup Dr Oklahoma City, OK | 2.0 | 1.0 | 858 | $889 | $1.04 | 2d | 1 | 0.71mi |
| 413 E Northrup Dr Oklahoma City, OK | 3.0 | 1.0 | 800 | $1,395 | $1.74 | 2d | 1 | 0.73mi |
| 422 E Northrup Dr Oklahoma City, OK | 3.0 | 1.0 | 819 | $1,395 | $1.70 | 1d | 1 | 0.74mi |
| 327 N Midwest Blvd Unit 205 Midwest City, OK | 2.0 | 1.0 | 920 | $900 | $0.98 | 23d | 1 | 0.77mi |
| 8517 E Reno Ave Oklahoma City, OK | 1.0–2.0 | 1.0–2.0 | 837 | $859 | $1.03 | 4d | 1 | 0.81mi |
| 7122 SE 15th St Oklahoma City, OK | 2.0 | 1.0 | 816 | $1,100 | $1.35 | 4d | 1 | 0.84mi |
| 124 E Northrup Dr Oklahoma City, OK | 4.0 | 1.0 | 1085 | $1,400 | $1.29 | 23d | 1 | 0.87mi |
| 442 Babb Dr Oklahoma City, OK | 2.0 | 2.0 | 920 | $925 | $1.01 | 4d | 1 | 0.90mi |
| 444 1/2 Babb Dr Oklahoma City, OK | 2.0 | 1.0 | 920 | $895 | $0.97 | 4d | 1 | 0.91mi |
| 616 Lions Park Pl Oklahoma City, OK | 2.0 | 1.0 | 906 | $950 | $1.05 | 2d | 1 | 0.92mi |
| 8717 Saint George Way Oklahoma City, OK | 2.0 | 2.0 | 1075 | $1,150 | $1.07 | 23d | 1 | 0.95mi |
| 538 E Indian Dr Oklahoma City, OK | 2.0 | 1.0 | 739 | $920 | $1.24 | 21d | 1 | 1.04mi |
| 8801 Saint George Way Oklahoma City, OK | 3.0 | 2.0 | 1122 | $1,175 | $1.05 | 23d | 1 | 1.04mi |
| 8801 Saint George Way Oklahoma City, OK | 3.0 | 2.0 | 1122 | $1,175 | $1.05 | 10d | 1 | 1.04mi |
| 2904 Treight Creek Ln Midwest City, OK | 2.0 | 2.0 | 984 | $1,495 | $1.52 | 1d | 2 | 1.07mi |
| 3409 Willow Creek Dr Oklahoma City, OK | 3.0 | 1.0 | 932 | $1,050 | $1.13 | 23d | 1 | 1.09mi |
| 3413 Willow Creek Dr Oklahoma City, OK | 3.0 | 1.0 | 872 | $975 | $1.12 | 2d | 1 | 1.10mi |
| 313 W Peach St Oklahoma City, OK | 2.0 | 1.0 | 724 | $975 | $1.35 | 17d | 1 | 1.11mi |
| 317 W Peach St Oklahoma City, OK | 2.0 | 1.0 | 878 | $1,045 | $1.19 | 2d | 1 | 1.12mi |
| 314 W Peach St Midwest City, OK | 2.0 | 1.0 | 736 | $950 | $1.29 | 23d | 1 | 1.13mi |
| 677 Midtown Pl Midwest City, OK | 1.0–2.0 | 1.0–2.0 | 770 | $1,450 | $1.88 | 1d | 1 | 1.17mi |
| 3512 Brookside Dr Oklahoma City, OK | 4.0 | 2.0 | 763 | $1,595 | $2.09 | 1d | 1 | 1.17mi |
| 421 N Key Blvd Oklahoma City, OK | 2.0 | 1.0 | 780 | $900 | $1.15 | 23d | 1 | 1.19mi |
| 3512 N Holman Ct Oklahoma City, OK | 3.0 | 2.0 | 1092 | $1,275 | $1.17 | 2d | 1 | 1.19mi |
| 1111 Jet Dr Oklahoma City, OK | 3.0 | 1.0 | 1067 | $1,095 | $1.03 | 21d | 1 | 1.23mi |
| 1111 Jet Dr Oklahoma City, OK | 3.0 | 1.0 | 1067 | $1,095 | $1.03 | 4d | 1 | 1.23mi |
| 3513 Parkwoods Ln Oklahoma City, OK | 3.0 | 1.5 | 903 | $1,150 | $1.27 | 44d | 1 | 1.24mi |
| 3609 Woodside Dr Midwest City, OK | 3.0 | 1.0 | 858 | $995 | $1.16 | 2d | 1 | 1.26mi |
| 403 N Key Blvd Oklahoma City, OK | 2.0 | 1.0 | 794 | $995 | $1.25 | 4d | 1 | 1.27mi |
| 6608 SE 15th St Oklahoma City, OK | 3.0 | 2.0 | 1103 | $1,425 | $1.29 | 21d | 1 | 1.33mi |
Listing history 4 events
-
2026-04-30status Pending
-
2026-04-18price $135,000
-
2026-04-10$149,900 Active
-
1991-04-02soldstatus $35,000
ⓘ Source: listings_history table (triggers on properties + properties_extension) + one-shot
backfill from property_details.listing_events for pre-trigger history.
Climate risk First Street
- Flood 1/10 Low FEMA zone X (unshaded) · 0% chance over 30 yrs
- Wildfire 1/10 Low
- Heat 6/10 Major 7 d/yr ≥107°F today · 19 d/yr by 30 yrs out
- Wind 2/10 Low 4% chance of damaging wind over 30 yrs
- Air quality 2/10 Low 1 unhealthy d/yr today · 2 by 30 yrs out
Nearby sold comps map
Loading sold comps map…
Walkable amenities ~0.75 mi
Loading nearby amenities…
Taxation est. · year 1
- Rental income
- $14,766
- − Mortgage interest
- −$7,562
- − Property taxes
- −$2,025
- − Insurance
- −$675
- − Repairs & maintenance
- −$1,181
- − Management
- −$1,181
- − Depreciation
- −$3,927
- Taxable loss
- −$1,786
- Est. tax savings @ 24.0%
- +$429
- After-tax cash flow
- $899/yr
For passive investors: Depreciation is non-cash, so a rental often shows a tax loss while cash-flowing — sheltering income. Rental losses are passive: they offset passive income freely, and up to $25,000/yr can offset ordinary (W-2) income if you actively participate and your MAGI is under $100k (phasing out to $0 by $150k); unused losses carry forward. On sale, claimed depreciation is recaptured at up to 25%, and gains may owe capital-gains tax (a 1031 exchange can defer both). Figures are a year-1 estimate at your 24.0% rate — not tax advice; consult a CPA.
Schools (NCES district)
- District
- Midwest City-Del City
- NCES district ID
- 4019950
- Math proficiency
- 10% ▼ -11.00%
- Reading proficiency
- 17% ▼ -8.00%
- Median HH income
- $45,724
- Composite
- 12.09/100
- National rank
- #9658
- State rank
- #231 of 270 in OK
Livability — Midwest City
- Score
- 71/100
- State rank
- #30
- US rank
- #6637
Category grades
Schools grade is shown separately in the Schools card above.
Census & demographics
- Census place
- Midwest City, OK
- County
- Oklahoma County · 771,644 people
- City population
- 57,386
- Metro
- Oklahoma City, OK
- Population (ZIP)
- 32,348
- Household income
- $51,228
- Rent vs Own
- Severe rent burden
- 1440.0
Population outlook (Oklahoma County) Hauer SSP2
- Today (2025)
- 911,875 people
- By 2030
- 982,413 · +7.7%
- By 2040
- 1,130,468 · +24.0%
- By 2050
- 1,288,422 · +41.3%
- By 2075
- 1,711,482 · +87.7%
- By 2100
- 2,088,448 · +129.0%
Race, ethnicity, and origin ACS 2023
- Neighborhood character
- Diverse neighborhood (Simpson 0.63)
- Race & ethnicity
- White 55% Black 25% Two or more races 11% Hispanic / Latino 7% Native American 4% Asian 1%
- Hispanic origin (detail)
- Mexican 5%
- Common ancestry
- Lithuanian 2% Slovak 1% Serbian 1%
- Foreign-born
- 3% · Canada, Vietnam
- Languages at home
- 95% English-only · Spanish 3%
Political lean MEDSL · Oklahoma
- 2024 margin
- Toss-up / Even · D 48.0% · R 49.7% · Other 2.3%
- 2008→2024 swing
- +15.1pp toward D · 2008: -16.8pp · 2024: -1.7pp
- All cycles
- 2024: R+1.7 2020: R+1.1 2016: R+10.5 2012: R+16.7 2008: R+16.8
Not yet ingested
- Civics
- —
Market trends
- HPI YoY
- ▼ -156.25%
- Current HPI
- 257.0791
- Rent YoY
- ▲ 2.99%
- Metro
- Oklahoma City, OK
- State GDP YoY
- ▲ 1.55%
- F500 in state
- 6
Industry mix (Fortune 500 HQ in OK)
| Industry | F500 HQs | Revenue |
|---|---|---|
| Energy | 3 | $48B |
|
||
Price history
+285.7% since first listed4 events — show timeline
- 2026-04-30 Pending — MLSOK
- 2026-04-18 Price Changed $135,000 MLSOK
- 2026-04-10 Listed $149,900 MLSOK
- 1991-04-02 Sold (Public Records) $35,000 Public Records
Property tax history
+1.4%/yrLatest (2025): $265 · +2.5% YoY. Source: county tax records.
Cash-flow waterfall
monthlySold comps — $/sqft
last 12 mo · ≤1 miLoading sold comps…