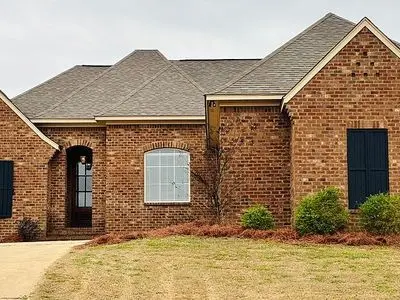
109 Camden Shrs · Madison, MS
Flood risk 1/10 · Minimal
- FEMA flood zone
- X (unshaded)
- Chance of flooding over 30 yrs
- 0.0%
- Est. flood insurance / yr
- $507 – $1,088
Fire risk 1/10 · Minimal
- Est. fire insurance / yr
- $1,241 – $2,305
Heat risk 8/10 · Major
- Hot days now (above 108°F)
- 7 days/yr
- Hot days in 30 yrs
- 21 days/yr
Wind risk 6/10 · Moderate
- Chance of severe wind over 30 yrs
- 76.0%
Air-quality risk 2/10 · Minimal
- Unhealthy air days now
- 0 days/yr
- Unhealthy air days in 30 yrs
- 1 days/yr
Risk factors via First Street. Map © Google.
Why this score? — see what drove the D+ grade
The composite is a weighted blend of 9 inputs, each scored 0–100. Each bar is that input's sub-score; the figure is the points it added to the 100-point composite (weight × sub-score).
- ARV discount +13.6/15.0
- Cash flow +13.5/30.0
- Schools +4.8/10.0
- DSCR +4.1/10.0
- Livability +4.0/5.0
- Rent growth +3.2/5.0
- 1% rule +2.9/10.0
- Condition / age +2.5/5.0
- Appreciation +0.0/10.0
$365,000
🖨 Deal sheet 📄 Offer letter ✓ Due diligence
Listing remarks
Located in the beautiful Lake Caroline community and zoned for highly sought-after Mannsdale Elementary and Germantown schools, this beautiful 4-bedroom, 2.5-bath home offers 2,113 square feet of comfortable living space designed for both. Property Details Please text the number listed for questions or to schedule a visit. 4 Bedrooms 2.5 Bathrooms 2,113 Sq. Ft. Hardwood Floors Throughout Main Areas New Carpet in Secondary Bedrooms Open-Concept Living Covered Outdoor Patio with Fireplace Located in Lake Caroline Zoned for Mannsdale Elementary & amp; Germantown Schools everyday living and entertaining. The home features warm finishes, an open-concept layout, stunning brick architectural
Key facts
- Outdoor living area
- Hardwood floors
- Built 2014
Tags
Neighborhood map
What this means for you Summary
Snapshot
- This is a 4-bed/3.0-bath single-family listed at $365k.
Deal economics
- At list price, monthly cash flow is $12 ($141/yr) — positive.
- The deal already cash-flows at list — no discount required.
- To meet the 1% rule (rent ≥ 1% of price), the offer needs to be $288k (21.2% below list).
- Recommended offer: $288k (21.2% below list) — sets the bar for 1% rule.
- Cap rate 6.3% vs local median 3.7% in Madison — top-decile yield for the area; either an underpriced asset or a hidden risk that comps aren't pricing in. Stress-test before assuming the spread holds.
Location & tenants
- Location reads 81/100 on livability (#4 in MS, #1,556 nationally) — a professional / high-income tenant draw. Strengths: crime A+, employment A+, housing A+; Watch: amenities D-, commute F.
- Madison County School District (rural): math 54% / reading 54% proficiency, ranked #3 of 130 in MS (top 2%) — acceptable for families but not a draw, mixed tenant base, ~2y average lease.
- Market conditions: Rents rising (+2.6%/yr); 628 active listings in the ZIP; 3 comparable units currently listed for rent nearby; rentals lingering (median 44d on market — plan ~5-8 weeks vacancy on turnover, expect pricing pressure); 67% of comp listings sitting > 30 days — soft ceiling on asking rent; high-income renter base; 553 units permitted in Madison County in 2024 (0 in 5+ unit buildings).
Forward outlook
- Local home prices are declining (-3.0%/yr); year-one equity from $3k of loan paydown is wiped out by about $11k of value loss. Plan a longer hold.
- Madison County population projected at +34% by 2050 — long-run rental-demand tailwind backs the buy-and-hold thesis.
Negotiation context
- It's been on market 37 days — a 3% lower offer ($354k) is reasonable based on typical stale-listing flexibility.
- 4 sale attempts since 12y ago with the ask held roughly flat each time — persistent listings suggest the price (not the market) is what's stuck; bring a comps-based counter.
Risks & watch-outs
- Climate carrying-cost: major wind risk, 76% chance of damaging wind over 30y; extreme-heat days projected 7→21/yr by 2055 (HVAC capex compounding) — expect insurance premiums to compound above CPI over the hold.
Questions for the listing agent
- It's been on market 37 days. Have you received any prior offers? Is the seller open to a 21% concession, seller financing, or rate buy-down credit?
- Is there a deadline driving the sale (1031 exchange, divorce, estate, relocation)? That informs how much negotiation room exists.
- Schools are A-rated — typically a magnet for longer-tenancy family renters. What's the average tenant stay here, and is there a school-zone premium baked into asking?
- The area grade is low — what's the realistic commute time and amenity access for the typical tenant pool here? Any planned neighborhood developments (good or bad) we should know about?
- What's the average days-on-market for RENTAL listings here right now (not sales)? A rising rental-DOM trend means longer vacancies and softer asking-rent achievability than the comps imply.
- What's the recent tenant-quality profile in this submarket — average credit score on applications, eviction rate, late-payment / NSF rate, and stable-employment percentage? A property-management company in the area should have these aggregated.
- How much new for-sale + rental construction is in the pipeline within 1–3 miles? Heavy new supply typically softens prices + rents 12–24 months out; constrained supply supports both.
Investment metrics
- 1% rule
- 0.79% ✗
- Cap rate
- 6.33%
- Cash-on-cash
- 0.14%
- DSCR
- 1.01
- GRM
- 10.6
CMA / ARV
- ARV (on-the-fly)
- $422,600
- Comps found
- 12
Show comp detail 12 sales within ~0.75 mi
| Address | Dist | Beds/Ba | Sqft | Sold | Price | $/sf | Match |
|---|---|---|---|---|---|---|---|
| 120 Hampton Chase | 0.53mi | 3/2.5 (-1) | 2,126 (+1%) | 1mo | $199,000 | $94 | 67 |
| 113 Claiborne St | 0.63mi | 4/3.0 | 2,186 (+4%) | 2mo | $389,900 | $178 | 64 |
| 121 Covey Run | 0.32mi | 4/3.0 | 2,395 (+13%) | 1mo | $394,000 | $165 | 62 |
| 102 Hampton Chase | 0.49mi | 3/2.0 (-1) | 2,030 (-4%) | 2mo | $370,000 | $182 | 60 |
| 469 Caroline Blvd | 0.65mi | 4/2.0 | 2,189 (+4%) | 1mo | $423,000 | $193 | 59 |
| 828 Thornberry Rdg | 0.42mi | 4/3.0 | 2,411 (+14%) | 1mo | $533,900 | $221 | 56 |
| 371 Wellstone Pl | 0.66mi | 3/2.0 (-1) | 2,225 (+5%) | 0mo | $479,000 | $215 | 51 |
| 123 Paylors Way | 0.55mi | 4/3.0 | 2,427 (+15%) | 1mo | $485,000 | $200 | 48 |
| 175 Shore View Dr | 0.59mi | 3/2.0 (-1) | 1,906 (-10%) | 1mo | $394,900 | $207 | 46 |
| 384 Wellstone Pl | 0.69mi | 4/5.0 | 2,301 (+9%) | 1mo | $506,000 | $220 | 44 |
| 174 Shore View Dr | 0.62mi | 3/2.0 (-1) | 1,880 (-11%) | 2mo | $364,900 | $194 | 42 |
| 388 Wellstone Pl | 0.69mi | 4/5.0 | 2,384 (+13%) | 2mo | $512,500 | $215 | 36 |
Match score weights: distance 35% · size 25% · config 20% · recency 20%. Top-matched comps best support the ARV.
Projected returns pro-forma
-3.0% appreciation · 2.61% rent growth · sell at horizon
- IRR
- -16.5%
- Equity multiple
- 0.42×
- Total profit
- $-59,640
- Equity at exit
- $54,423
- IRR
- -9.0%
- Equity multiple
- 0.45×
- Total profit
- $-56,026
- Equity at exit
- $31,559
Cash invested: $102,200 (down + closing). Projections, not guarantees.
Landlord ↔ Tenant lean methodology
- Overall (STATE)
- 90 Strongly Landlord-Friendly
- State Mississippi
- 90 Strongly Landlord-Friendly · R+11
- County
- — inherits STATE
- City
- — inherits STATE
ZIP-level market 39110
- Home prices YoY
- -28.3%
- Rents YoY
- 2.6%
- Active inventory
- 628
- Price-to-rent
- 10.6×
Monthly cashflow live
- Estimated rent
- $2,877 medium interval (Pro) →
- Mortgage (P&I)
- −$1,914
- Tax from tax record
- −$195 /mo · $2,337/yr
- Insurance
- −$152
- HOA
- −$0
- Vacancy / Maint / Mgmt
- −$604
- Net cashflow
- $12
Break-even live
UW: 25.0% down · 7.5% · 30yr · 1.5% tax · 5.0% vac · 8.0% maint · 8.0% mgmt
Financing live
Cash to close
- Down payment
- $91,250
- Closing costs
- $10,950
- Reserves months
- —
- Total cash needed
- —
Loan-product check · same deal, 3 products live
Conventional
25% down · 7.5% · 30yr
- Down + closing
- —
- Monthly P&I
- —
- Monthly cashflow
- —
- DSCR
- —
- Eligible?
- —
Personal DTI + credit; lowest rate.
DSCR
20% down · 8.5% · 30yr
- Down + closing
- —
- Monthly P&I
- —
- Monthly cashflow
- —
- DSCR
- —
- Eligible?
- —
No personal income docs; deal must DSCR.
Hard money
10% down · 12.0% · 12mo
- Down + closing
- —
- Monthly P&I
- —
- Monthly cashflow
- —
- DSCR
- —
- Eligible?
- —
Short-term bridge; refi at stabilization.
Rent comps 3 comps
| Address | Beds | Baths | Sqft | Rent | $/sqft | DOM | Units | Dist |
|---|---|---|---|---|---|---|---|---|
| 100 Mason Way Madison, MS | 3.0 | 2.0 | 1614 | $2,600 | $1.61 | 43d | 1 | 0.89mi |
| 108 Buckeye Dr Madison, MS | 4.0 | 3.5 | 2400 | $2,650 | $1.10 | 44d | 1 | 1.31mi |
| 125 Memory Ln Madison, MS | 3.0 | 2.0 | 1838 | $2,800 | $1.52 | 23d | 1 | 1.34mi |
Listing history 27 events
-
2026-06-18days on market $365,000 Active 37 DOM
-
2026-06-17days on market $365,000 Active 36 DOM
-
2026-06-16pricedays on market $365,000 Active 35 DOM
-
2026-06-15days on market $367,000 Active 34 DOM
-
2026-06-14days on market $367,000 Active 32 DOM
-
2026-06-10days on market $367,000 Active 29 DOM
-
2026-06-09days on market $367,000 Active 28 DOM
-
2026-06-08days on market $367,000 Active 27 DOM
-
2026-06-07days on market $367,000 Active 26 DOM
-
2026-06-03days on market $367,000 Active 22 DOM
-
2026-06-02days on market $367,000 Active 21 DOM
-
2026-06-01days on market $367,000 Active 20 DOM
-
2026-05-31days on market $367,000 Active 19 DOM
-
2026-05-30days on market $367,000 Active 18 DOM
-
2026-05-12$367,000 Active 1483-char remark
-
2026-05-07historical
-
2026-03-24price $367,000
-
2026-03-06price $369,000
-
2026-02-17price $371,000
-
2026-01-14price $374,000
-
2025-11-07$380,000 Active
-
2025-11-05historical
-
2025-08-18price $384,900
-
2025-06-30price $387,400
-
2025-05-06$389,900 Active
-
2014-08-01soldstatus
-
2014-05-07$291,900
ⓘ Source: listings_history table (triggers on properties + properties_extension) + one-shot
backfill from property_details.listing_events for pre-trigger history.
Tax reassessment forecast MS · Resets to sale price
- Current annual tax
- $2,337 · $195/mo
- Projected year-2 tax
- $2,884 · $240/mo
- Expected delta
- +$547/yr (+$46/mo · 23.4%)
ⓘ Screening estimate from a state-policy table — verify with the county assessor before closing.
Climate risk First Street
- Flood 1/10 Low FEMA zone X (unshaded) · 0% chance over 30 yrs
- Wildfire 1/10 Low
- Heat 8/10 Severe 7 d/yr ≥108°F today · 21 d/yr by 30 yrs out
- Wind 6/10 Major 76% chance of damaging wind over 30 yrs
- Air quality 2/10 Low 0 unhealthy d/yr today · 1 by 30 yrs out
Nearby sold comps map
Loading sold comps map…
Walkable amenities ~0.75 mi
Loading nearby amenities…
Taxation est. · year 1
- Rental income
- $34,521
- − Mortgage interest
- −$20,446
- − Property taxes
- −$2,337
- − Insurance
- −$1,825
- − Repairs & maintenance
- −$2,762
- − Management
- −$2,762
- − Depreciation
- −$10,618
- Taxable loss
- −$6,228
- Est. tax savings @ 24.0%
- +$1,495
- After-tax cash flow
- $1,635/yr
For passive investors: Depreciation is non-cash, so a rental often shows a tax loss while cash-flowing — sheltering income. Rental losses are passive: they offset passive income freely, and up to $25,000/yr can offset ordinary (W-2) income if you actively participate and your MAGI is under $100k (phasing out to $0 by $150k); unused losses carry forward. On sale, claimed depreciation is recaptured at up to 25%, and gains may owe capital-gains tax (a 1031 exchange can defer both). Figures are a year-1 estimate at your 24.0% rate — not tax advice; consult a CPA.
Schools (NCES district)
- District
- Madison County School District
- NCES district ID
- 2802790
- Math proficiency
- 54% ▼ -7.00%
- Reading proficiency
- 54% ▼ -7.00%
- Median HH income
- $70,579
- Composite
- 48.08/100
- National rank
- #2188
- State rank
- #3 of 130 in MS
Livability — Madison
- Score
- 81/100
- State rank
- #4
- US rank
- #1556
Category grades
Schools grade is shown separately in the Schools card above.
Census & demographics
- County
- Madison County · 75,005 people
- City population
- 50,443
- Metro
- Jackson, MS
- Population (ZIP)
- 50,443
- Household income
- $125,506
- Rent vs Own
- Severe rent burden
- 227.0
Population outlook (Madison County) Hauer SSP2
- Today (2025)
- 122,509 people
- By 2030
- 131,737 · +7.5%
- By 2040
- 148,930 · +21.6%
- By 2050
- 164,300 · +34.1%
- By 2075
- 197,495 · +61.2%
- By 2100
- 211,429 · +72.6%
Race, ethnicity, and origin ACS 2023
- Neighborhood character
- Predominantly White (76%)
- Race & ethnicity
- White 76% Black 15% Asian 4% Two or more races 3% Hispanic / Latino 2%
- Common ancestry
- Italian 6% Slovak 3% Lithuanian 3%
- Foreign-born
- 5% · China, Canada
- Languages at home
- 92% English-only · Spanish 2% Other Indo-European 2% Chinese 1%
Political lean MEDSL · Madison
- 2024 margin
- R (+17.3) · D 40.8% · R 58.0% · Other 1.2%
- 2008→2024 swing
- -1.7pp toward R · 2008: -15.6pp · 2024: -17.3pp
- All cycles
- 2024: R+17.3 2020: R+11.8 2016: R+16.1 2012: R+15.7 2008: R+15.6
Not yet ingested
- Civics
- —
Market trends
- HPI YoY
- ▼ -60.99%
- Current HPI
- 154.6909
- Rent YoY
- ▲ 2.61%
- Metro
- Jackson, MS
- State GDP YoY
- —
- F500 in state
- 0
Price history
+25.0% since first listed14 events — show timeline
- 2026-06-16 Price Changed $365,000 FSBO.com
- 2026-05-12 Listed $367,000 FSBO.com
- 2026-05-07 Listing Removed — MLSU
- 2026-03-24 Price Changed $367,000 MLSU
- 2026-03-06 Price Changed $369,000 MLSU
- 2026-02-17 Price Changed $371,000 MLSU
- 2026-01-14 Price Changed $374,000 MLSU
- 2025-11-07 Listed $380,000 MLSU
- 2025-11-05 Listing Removed — MLSU
- 2025-08-18 Price Changed $384,900 MLSU
- 2025-06-30 Price Changed $387,400 MLSU
- 2025-05-06 Listed $389,900 MLSU
- 2014-08-01 Sold (MLS) — MLSU
- 2014-05-07 Listed $291,900 MLSU
Property tax history
+18.9%/yrLatest (2025): $2,337 · +0.0% YoY. Source: county tax records.
Cash-flow waterfall
monthlySold comps — $/sqft
last 12 mo · ≤1 miLoading sold comps…