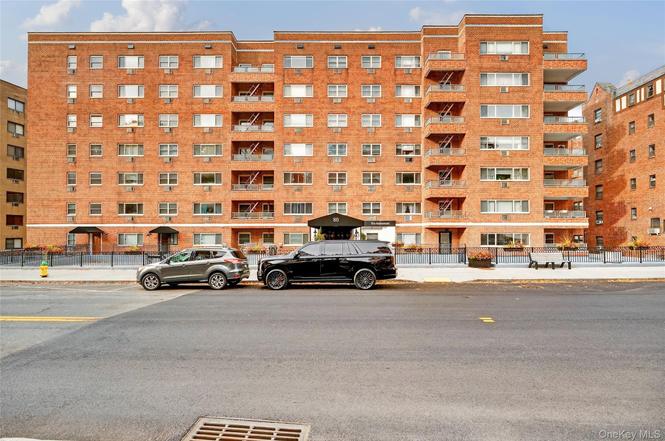
80 E Hartsdale Ave #418 · Greenville, NY
Flood risk 10/10 · Severe
- FEMA flood zone
- X (unshaded)
- Chance of flooding over 30 yrs
- 0.99%
- Est. flood insurance / yr
- $507 – $1,088
Fire risk 1/10 · Minimal
- Est. fire insurance / yr
- $691 – $1,283
Heat risk 6/10 · Moderate
- Hot days now (above 98°F)
- 7 days/yr
- Hot days in 30 yrs
- 15 days/yr
Wind risk 6/10 · Moderate
- Chance of severe wind over 30 yrs
- 27.0%
Air-quality risk 4/10 · Minor
- Unhealthy air days now
- 3 days/yr
- Unhealthy air days in 30 yrs
- 5 days/yr
Risk factors via First Street. Map © Google.
Why this score? — see what drove the B- grade
The composite is a weighted blend of 9 inputs, each scored 0–100. Each bar is that input's sub-score; the figure is the points it added to the 100-point composite (weight × sub-score).
- Cash flow +30.0/30.0
- DSCR +10.0/10.0
- 1% rule +8.8/10.0
- ARV discount +7.5/15.0
- Schools +4.9/10.0
- Livability +3.2/5.0
- Rent growth +2.5/5.0
- Condition / age +2.5/5.0
- Appreciation +0.0/10.0
$270,000
🖨 Deal sheet 📄 Offer letter ✓ Due diligence
Listing remarks
Spacious 2-bedroom co-op offering unbeatable value and convenience in the heart of Hartsdale. This bright and inviting home features a comfortable layout with large living and dining areas, perfect for both relaxing and entertaining. The kitchen is clean and functional, with classic finishes and plenty of cabinet space. Both bedrooms are generously sized with ample closets, providing comfort and flexibility for guests, a home office, or family living. The building is well-maintained, with laundry on every floor, elevator access, and available indoor parking. Ideally located just steps from the Hartsdale Metro-North station, shopping, dining, and parks, this home offers easy commuting and a
Key facts
- Ample closets
- Elevator access
- Garage
Tags
Neighborhood map
What this means for you Summary
Snapshot
- This is a 2-bed/1.0-bath condo listed at $270k.
Deal economics
- At list price, monthly cash flow is $1k ($12k/yr) — positive.
- The deal already cash-flows at list — no discount required.
- Meets the 1% rule at list price ($4k rent vs $270k).
- Recommended offer: $254k (6.0% below list) — sets the bar for market timing.
- Cap rate 11.1% vs local median 3.1% in Greenville — top-decile yield for the area; either an underpriced asset or a hidden risk that comps aren't pricing in. Stress-test before assuming the spread holds.
Location & tenants
- Location reads 65/100 on livability (#713 in NY) — a middle-class / working-renter tenant base. Strengths: crime A+, employment A+; Watch: amenities F, commute F, cost of living F.
- Greenburgh Central School District (suburban): math 51% / reading 55% proficiency, ranked #267 of 590 in NY (top 45%) — acceptable for families but not a draw, mixed tenant base, ~2y average lease.
- Zoned schools: Early Childhood Program (128 students, 0% FRL); Woodlands Middle/High School (math 62% / reading 52%, grade C, #887 of 1,100 statewide, top 82%, 681 students, 66% FRL).
- Market conditions: 156 active listings in the ZIP; 13 comparable units currently listed for rent nearby; rentals at typical pace (median 17d on market — plan ~3-4 weeks tenant-placement turnaround); 954 units permitted in Westchester County in 2024 (649 in 5+ unit buildings).
Forward outlook
- Local home prices are declining (-3.0%/yr); year-one equity from $2k of loan paydown is wiped out by about $8k of value loss. Plan a longer hold.
- Westchester County population projected at +10% by 2050 — modest demand growth; plan on rents tracking national, not racing it.
- At projected returns (-3.0% appreciation + 3.0% rent growth), your $76k cash investment doubles in ~8 years — after that, you're playing with house money.
Negotiation context
- It's been on market 67 days — a 6% lower offer ($254k) is reasonable based on typical stale-listing flexibility.
Risks & watch-outs
- Watch-outs: flood insurance adds $66/mo.
- Climate carrying-cost: severe flood risk; major wind risk, 27% chance of damaging wind over 30y; extreme-heat days projected 7→15/yr by 2055 (HVAC capex compounding) — expect insurance premiums to compound above CPI over the hold.
Questions for the listing agent
- It's been on market 67 days. Have you received any prior offers? Is the seller open to a 6% concession, seller financing, or rate buy-down credit?
- Built in 1964 — when were the roof, HVAC, electrical panel, plumbing, and water heater last replaced?
- What's the actual annual flood-insurance premium (NFIP or private), and is the property in a SFHA with mandatory coverage?
- Any open or pending special assessments — roof, HVAC, plumbing, elevator, façade? What's the per-unit balance and payoff schedule, and is the seller paying it off at close or rolling it to the buyer?
- Why hasn't it sold? Are there any deal-killer items the seller is aware of (foundation, flood, title, zoning, code violations)?
- Is there a deadline driving the sale (1031 exchange, divorce, estate, relocation)? That informs how much negotiation room exists.
- Schools are B-rated — typically a magnet for longer-tenancy family renters. What's the average tenant stay here, and is there a school-zone premium baked into asking?
- What's the average days-on-market for RENTAL listings here right now (not sales)? A rising rental-DOM trend means longer vacancies and softer asking-rent achievability than the comps imply.
- What's the recent tenant-quality profile in this submarket — average credit score on applications, eviction rate, late-payment / NSF rate, and stable-employment percentage? A property-management company in the area should have these aggregated.
- How much new apartment / multifamily construction is in the pipeline within 1–3 miles? Heavy new supply (>2% of stock underway) typically softens rents 12–24 months out; light construction supports rent growth.
Investment metrics
- 1% rule
- 1.38% ✓
- Cap rate
- 11.06%
- Cash-on-cash
- 17.01%
- DSCR
- 1.76
- GRM
- 6.1
CMA / ARV
No comps found within radius.
Projected returns pro-forma
-3.0% appreciation · 3.0% rent growth · sell at horizon
- IRR
- 6.9%
- Equity multiple
- 1.27×
- Total profit
- $20,363
- Equity at exit
- $40,258
- IRR
- 16.3%
- Equity multiple
- 2.33×
- Total profit
- $100,559
- Equity at exit
- $23,345
Cash invested: $75,600 (down + closing). Projections, not guarantees.
Landlord ↔ Tenant lean methodology
- Overall (STATE)
- 15 Strongly Tenant-Friendly
- State New York
- 15 Strongly Tenant-Friendly · D+10
- County
- — inherits STATE
- City
- — inherits STATE
ZIP-level market 10530
- Active inventory
- 156
- Price-to-rent
- 6.1×
Monthly cashflow live
- Estimated rent
- $3,718 high interval (Pro) →
- Mortgage (P&I)
- −$1,416
- Tax est. 1.5%
- −$338 /mo · $4,050/yr
- Insurance
- −$112
- Flood insurance flood zone
- −$66 /mo · $798/yr
- HOA
- −$0
- Vacancy / Maint / Mgmt
- −$781
- Net cashflow
- $1,005
Break-even live
UW: 25.0% down · 7.5% · 30yr · 1.5% tax · 5.0% vac · 8.0% maint · 8.0% mgmt
Financing live
Cash to close
- Down payment
- $67,500
- Closing costs
- $8,100
- Reserves months
- —
- Total cash needed
- —
Loan-product check · same deal, 3 products live
Conventional
25% down · 7.5% · 30yr
- Down + closing
- —
- Monthly P&I
- —
- Monthly cashflow
- —
- DSCR
- —
- Eligible?
- —
Personal DTI + credit; lowest rate.
DSCR
20% down · 8.5% · 30yr
- Down + closing
- —
- Monthly P&I
- —
- Monthly cashflow
- —
- DSCR
- —
- Eligible?
- —
No personal income docs; deal must DSCR.
Hard money
10% down · 12.0% · 12mo
- Down + closing
- —
- Monthly P&I
- —
- Monthly cashflow
- —
- DSCR
- —
- Eligible?
- —
Short-term bridge; refi at stabilization.
Rent comps 13 comps
| Address | Beds | Baths | Sqft | Rent | $/sqft | DOM | Units | Dist |
|---|---|---|---|---|---|---|---|---|
| 140 E Hartsdale Ave Hartsdale, NY | 2.0 | 1.0 | 875 | $2,895 | $3.31 | 22d | 1 | 0.12mi |
| 250 S Central Ave Apt 3I Hartsdale, NY | 2.0 | 1.0 | 1000 | $4,350 | $4.35 | 43d | 1 | 0.48mi |
| 250 S Central Ave Apt 4A Hartsdale, NY | 2.0 | 1.0 | 1289 | $4,350 | $3.37 | 16d | 1 | 0.48mi |
| 250 Central Park Ave Unit 5I Hartsdale, NY | 2.0 | 1.0 | 1000 | $4,550 | $4.55 | 17d | 1 | 0.50mi |
| 250 S Central Ave Hartsdale, NY | 1.0–2.0 | 1.0–2.0 | 1084 | $5,500 | $5.07 | 1d | 1 | 0.51mi |
| 330 Central Park Ave Apt F8 Scarsdale, NY | 2.0 | 2.0 | 1200 | $3,700 | $3.08 | 4d | 1 | 0.71mi |
| 55 Fieldstone Dr Unit 69 Hartsdale, NY | 1.0 | 1.0 | 800 | $2,100 | $2.62 | 11d | 1 | 1.00mi |
| 500 Central Park Ave Scarsdale, NY | 2.0 | 1.5–2.0 | 1231 | $4,425 | $3.59 | 12d | 1 | 1.08mi |
| 9 Ridgeview Ave White Plains, NY | 3.0 | 1.0 | 1500 | $3,500 | $2.33 | 24d | 1 | 1.11mi |
| 400 High Point Dr Unit 206 Hartsdale, NY | 1.0 | 1.0 | 987 | $3,300 | $3.34 | 43d | 1 | 1.27mi |
| 55 McKinley Ave Unit D2-3 White Plains, NY | 1.0 | 1.0 | 809 | $2,400 | $2.97 | 43d | 1 | 1.30mi |
| 57 Bank St Unit 1040035P White Plains, NY | 2.0 | 1.0–2.0 | 726 | $9,348 | $12.88 | 2d | 3 | 1.49mi |
| 55 Bank St White Plains, NY | 2.0 | 1.0–2.0 | 861 | $5,420 | $6.30 | 1d | 23 | 1.50mi |
HOA detail condo
- Monthly dues
- $0 · $0/yr
- Assessments
- None detected in remarks — confirm with the listing agent.
Listing history 3 events
-
2026-01-16status Pending
-
2025-12-06price $270,000
-
2025-11-10$299,999 Active
ⓘ Source: listings_history table (triggers on properties + properties_extension) + one-shot
backfill from property_details.listing_events for pre-trigger history.
Climate risk First Street
- Flood 10/10 Extreme FEMA zone X (unshaded) · 99% chance over 30 yrs
- Wildfire 1/10 Low
- Heat 6/10 Major 7 d/yr ≥98°F today · 15 d/yr by 30 yrs out
- Wind 6/10 Major 27% chance of damaging wind over 30 yrs
- Air quality 4/10 Moderate 3 unhealthy d/yr today · 5 by 30 yrs out
Nearby sold comps map
Loading sold comps map…
Walkable amenities ~0.75 mi
Loading nearby amenities…
Taxation est. · year 1
- Rental income
- $44,620
- − Mortgage interest
- −$15,124
- − Property taxes
- −$4,050
- − Insurance
- −$2,148
- − Repairs & maintenance
- −$3,570
- − Management
- −$3,570
- − Depreciation
- −$7,855
- Taxable income
- $8,305
- Est. tax owed @ 24.0%
- −$1,993
- After-tax cash flow
- $10,068/yr
For passive investors: Depreciation is non-cash, so a rental often shows a tax loss while cash-flowing — sheltering income. Rental losses are passive: they offset passive income freely, and up to $25,000/yr can offset ordinary (W-2) income if you actively participate and your MAGI is under $100k (phasing out to $0 by $150k); unused losses carry forward. On sale, claimed depreciation is recaptured at up to 25%, and gains may owe capital-gains tax (a 1031 exchange can defer both). Figures are a year-1 estimate at your 24.0% rate — not tax advice; consult a CPA.
Schools (NCES district)
- District
- Greenburgh Central School District
- NCES district ID
- 3612720
- Math proficiency
- 51% ▲ 4.00%
- Reading proficiency
- 55% ▲ 5.00%
- Median HH income
- $93,626
- Composite
- 49.43/100
- National rank
- #2005
- State rank
- #267 of 590 in NY
Livability — Greenville
- Score
- 65/100
- State rank
- #713
- US rank
- #13570
Category grades
Schools grade is shown separately in the Schools card above.
Census & demographics
- Census place
- Greenville, NY
- City population
- 3,648
- Population (ZIP)
- 13,955
Population outlook (Westchester County) Hauer SSP2
- Today (2025)
- 1,028,035 people
- By 2030
- 1,051,636 · +2.3%
- By 2040
- 1,098,520 · +6.9%
- By 2050
- 1,136,044 · +10.5%
- By 2075
- 1,196,925 · +16.4%
- By 2100
- 1,175,147 · +14.3%
Race, ethnicity, and origin ACS 2023
- Neighborhood character
- Predominantly White (68%)
- Race & ethnicity
- White 68% Hispanic / Latino 12% Asian 10% Two or more races 9% Black 7%
- Hispanic origin (detail)
- Mexican 2% Puerto Rican 4% Dominican 2%
- Common ancestry
- Romanian 9% Scotch-Irish 5% Italian 2%
- Foreign-born
- 23% · Canada, China, South Korea
- Languages at home
- 71% English-only · Spanish 9% Other Indo-European 6% Russian/Polish/Slavic 5%
Political lean MEDSL · Westchester
- 2024 margin
- Strong D (+26.3) · D 63.1% · R 36.9%
- 2008→2024 swing
- -1.3pp toward R · 2008: 27.6pp · 2024: 26.3pp
- All cycles
- 2024: D+26.3 2020: D+36.3 2016: D+32.8 2012: D+22.2 2008: D+27.6
Not yet ingested
- Civics
- —
Market trends
- HPI YoY
- ▼ -616.16%
- Current HPI
- 320.7324
- Rent YoY
- —
- Metro
- —
- State GDP YoY
- ▲ 2.60%
- F500 in state
- 92
Industry mix (Fortune 500 HQ in NY)
| Industry | F500 HQs | Revenue |
|---|---|---|
| Financial Services | 10 | $950B |
|
||
| Consumer Goods | 9 | $162B |
|
||
| Insurance | 4 | $225B |
|
||
| Telecommunications | 2 | $144B |
|
||
| Pharmaceuticals | 2 | $112B |
|
||
| Media / Entertainment | 2 | $69B |
|
||
Price history
-10.0% since first listed3 events — show timeline
- 2026-01-16 Pending — OneKey® MLS as Distributed by MLS Grid
- 2025-12-06 Price Changed $270,000 OneKey® MLS as Distributed by MLS Grid
- 2025-11-10 Listed $299,999 OneKey® MLS as Distributed by MLS Grid
Cash-flow waterfall
monthlySold comps — $/sqft
last 12 mo · ≤1 miLoading sold comps…