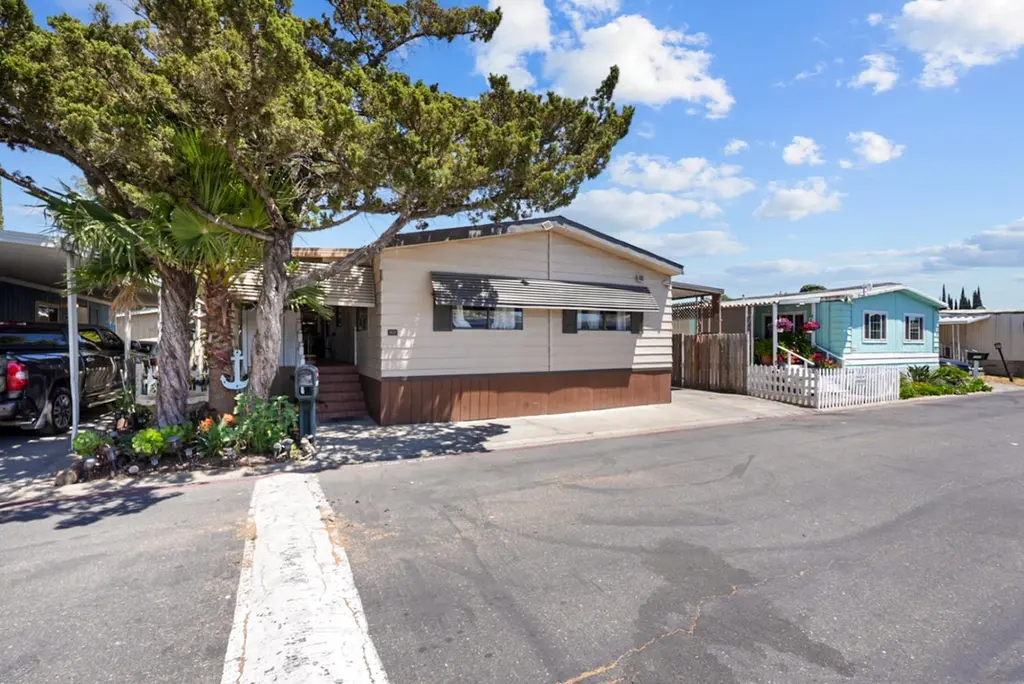
4837 Faith Home Rd #102 · Keyes, CA
Flood risk 1/10 · Minimal
- FEMA flood zone
- X (unshaded)
- Chance of flooding over 30 yrs
- 0.0%
- Est. flood insurance / yr
- $507 – $1,088
Fire risk 6/10 · Moderate
- Est. fire insurance / yr
- $659 – $1,223
Heat risk 7/10 · Major
- Hot days now (above 102°F)
- 7 days/yr
- Hot days in 30 yrs
- 15 days/yr
Wind risk 1/10 · Minimal
- Chance of severe wind over 30 yrs
- —
Air-quality risk 10/10 · Severe
- Unhealthy air days now
- 34 days/yr
- Unhealthy air days in 30 yrs
- 37 days/yr
Risk factors via First Street. Map © Google.
Why this score? — see what drove the C+ grade
The composite is a weighted blend of 9 inputs, each scored 0–100. Each bar is that input's sub-score; the figure is the points it added to the 100-point composite (weight × sub-score).
- Cash flow +30.0/30.0
- 1% rule +10.0/10.0
- DSCR +10.0/10.0
- Schools +2.8/10.0
- Condition / age +2.8/5.0
- Rent growth +2.5/5.0
- Livability +2.3/5.0
- ARV discount +0.0/15.0
- Appreciation +0.0/10.0
$113,999
🖨 Deal sheet 📄 Offer letter ✓ Due diligence
Listing remarks
Nestled in the heart of Ceres Mobile Estates, this spacious all-age communityhome offers comfort, convenience, and potential. Featuring 3 bedrooms and 2 bathrooms, this residence boasts a recently updated flooring. The open-concept living room is bathed in natural light, creating a warm and inviting atmosphere. Located less than a mile fromfreeways, schools, and shopping centers, this home combines peaceful livingwith easy access to amenities. While it awaits your personal touch to completeits charm, the possibilities are endless. Don't miss the opportunity to make this house your home. Schedule a tour today and envision the lifestyle that awaits you at Ceres Mobile Estates!
Key facts
- Natural light
- Updated flooring
- Parking
Tags
Neighborhood map
What this means for you Summary
Snapshot
- This is a 3-bed/2.0-bath manufactured listed at $114k. Condition is rated average.
Deal economics
- At list price, monthly cash flow is $1k ($13k/yr) — positive.
- The deal already cash-flows at list — no discount required.
- Meets the 1% rule at list price ($2k rent vs $114k).
- Recommended offer: $100k (12.0% below list) — sets the bar for market timing.
- Cap rate 17.7% vs local median 4.0% in Keyes — top-decile yield for the area; either an underpriced asset or a hidden risk that comps aren't pricing in. Stress-test before assuming the spread holds.
Location & tenants
- Location reads 46/100 on livability (#1,280 in CA) — a working-class tenant base; expect higher turnover. Strengths: housing A; Watch: schools D, employment D, crime F.
- Ceres Unified (suburban): math 15% / reading 50% proficiency, ranked #303 of 517 in CA (top 59%) — families likely to look elsewhere, expect single-tenant / working-renter base with shorter leases; 69% free/reduced lunch — lower-income household profile, screen leases tightly.
- Market conditions: 87 active listings in the ZIP; 2 comparable units currently listed for rent nearby; solid renter incomes; 923 units permitted in Stanislaus County in 2024 (63 in 5+ unit buildings).
- This rent runs 35% of the median local income ($81k/yr) — at the standard rent-burdened threshold; future hikes will face affordability resistance.
Forward outlook
- Local home prices are declining (-3.0%/yr); year-one equity from $788 of loan paydown is wiped out by about $3k of value loss. Plan a longer hold.
- Stanislaus County population projected at +14% by 2050 — modest demand growth; plan on rents tracking national, not racing it.
- At projected returns (-3.0% appreciation + 3.0% rent growth), your $32k cash investment doubles in ~3 years — after that, you're playing with house money.
Negotiation context
- It's been on market 322 days — a 12% lower offer ($100k) is reasonable based on typical stale-listing flexibility.
Risks & watch-outs
- Climate carrying-cost: major wildfire risk; extreme-heat days projected 7→15/yr by 2055 (HVAC capex compounding) — expect insurance premiums to compound above CPI over the hold.
Questions for the listing agent
- It's been on market 322 days. Have you received any prior offers? Is the seller open to a 12% concession, seller financing, or rate buy-down credit?
- Why hasn't it sold? Are there any deal-killer items the seller is aware of (foundation, flood, title, zoning, code violations)?
- Is there a deadline driving the sale (1031 exchange, divorce, estate, relocation)? That informs how much negotiation room exists.
- Schools are D-rated, which usually means shorter tenancies and higher turnover. Who's the typical renter profile here, and what's been the actual vacancy rate?
- Crime grade is F in this area — have there been break-ins, vandalism, or insurance claims at this property in the last 3 years? What carrier currently insures it and at what premium?
- What's the average days-on-market for RENTAL listings here right now (not sales)? A rising rental-DOM trend means longer vacancies and softer asking-rent achievability than the comps imply.
- What's the recent tenant-quality profile in this submarket — average credit score on applications, eviction rate, late-payment / NSF rate, and stable-employment percentage? A property-management company in the area should have these aggregated.
- How much new for-sale + rental construction is in the pipeline within 1–3 miles? Heavy new supply typically softens prices + rents 12–24 months out; constrained supply supports both.
Investment metrics
- 1% rule
- 2.08% ✓
- Cap rate
- 17.75%
- Cash-on-cash
- 40.91%
- DSCR
- 2.82
- GRM
- 4.0
CMA / ARV
- ARV (median comp)
- $94,999
- List price
- $113,999
- Delta
- 20.00%
- Verdict
- OVERPRICED
- Comps
- 9 within 1.0 mi
Show comp detail 7 sales within ~0.75 mi
| Address | Dist | Beds/Ba | Sqft | Sold | Price | $/sf | Match |
|---|---|---|---|---|---|---|---|
| 4837 Faith Home Rd #132 | 0.10mi | 3/2.0 | 1,200 (0%) | 7mo | $50,000 | $42 | 89 |
| 4837 Faith Home Rd #42 | 0.17mi | 3/2.0 | 1,152 (-4%) | 19mo | $160,000 | $139 | 70 |
| 4837 Faith Home Rd #4 | 0.17mi | 3/2.0 | 1,368 (+14%) | 2mo | $94,999 | $69 | 67 |
| 4812 Esmar Rd #18 | 0.35mi | 3/2.0 | 1,280 (+7%) | 14mo | $116,500 | $91 | 61 |
| 4837 Faith Home Rd #169 | 0.17mi | 2/2.0 (-1) | 1,248 (+4%) | 23mo | $98,000 | $79 | 61 |
| 4837 Faith Home Rd #166 | 0.17mi | 2/2.0 (-1) | 1,344 (+12%) | 10mo | $135,000 | $100 | 59 |
| 4812 Esmar Rd #2 | 0.35mi | 2/2.0 (-1) | 1,344 (+12%) | 8mo | $80,000 | $60 | 52 |
Match score weights: distance 35% · size 25% · config 20% · recency 20%. Top-matched comps best support the ARV.
Projected returns pro-forma
-3.0% appreciation · 3.0% rent growth · sell at horizon
- IRR
- 37.4%
- Equity multiple
- 2.59×
- Total profit
- $50,879
- Equity at exit
- $16,998
- IRR
- 44.0%
- Equity multiple
- 5.19×
- Total profit
- $133,705
- Equity at exit
- $9,857
Cash invested: $31,920 (down + closing). Projections, not guarantees.
Landlord ↔ Tenant lean methodology
- Overall (STATE)
- 18 Strongly Tenant-Friendly
- State California
- 18 Strongly Tenant-Friendly · D+13
- County
- — inherits STATE
- City
- — inherits STATE
ZIP-level market 95307
- Active inventory
- 87
- Price-to-rent
- 4.0×
Monthly cashflow live
- Estimated rent
- $2,375 medium interval (Pro) →
- Mortgage (P&I)
- −$598
- Tax est. 1.5%
- −$142 /mo · $1,710/yr
- Insurance
- −$47
- HOA
- −$0
- Vacancy / Maint / Mgmt
- −$499
- Net cashflow
- $1,088
Break-even live
UW: 25.0% down · 7.5% · 30yr · 1.5% tax · 5.0% vac · 8.0% maint · 8.0% mgmt
Financing live
Cash to close
- Down payment
- $28,500
- Closing costs
- $3,420
- Reserves months
- —
- Total cash needed
- —
Loan-product check · same deal, 3 products live
Conventional
25% down · 7.5% · 30yr
- Down + closing
- —
- Monthly P&I
- —
- Monthly cashflow
- —
- DSCR
- —
- Eligible?
- —
Personal DTI + credit; lowest rate.
DSCR
20% down · 8.5% · 30yr
- Down + closing
- —
- Monthly P&I
- —
- Monthly cashflow
- —
- DSCR
- —
- Eligible?
- —
No personal income docs; deal must DSCR.
Hard money
10% down · 12.0% · 12mo
- Down + closing
- —
- Monthly P&I
- —
- Monthly cashflow
- —
- DSCR
- —
- Eligible?
- —
Short-term bridge; refi at stabilization.
Rent comps 2 comps
| Address | Beds | Baths | Sqft | Rent | $/sqft | DOM | Units | Dist |
|---|---|---|---|---|---|---|---|---|
| 3824 Hollywood Dr Ceres, CA | 3.0 | 2.0 | 1100 | $2,220 | $2.02 | 43d | 1 | 0.26mi |
| 5232 Clark St Keyes, CA | 3.0 | 2.0 | 1133 | $2,200 | $1.94 | 13d | 1 | 0.76mi |
Listing history 16 events
-
2026-06-18days on market $113,999 Active 322 DOM
-
2026-06-17days on market $113,999 Active 321 DOM
-
2026-06-16days on market $113,999 Active 320 DOM
-
2026-06-15days on market $113,999 Active 319 DOM
-
2026-06-14days on market $113,999 Active 317 DOM
-
2026-06-13days on market $113,999 Active 316 DOM
-
2026-06-10days on market $113,999 Active 314 DOM
-
2026-06-09days on market $113,999 Active 313 DOM
-
2026-06-08days on market $113,999 Active 312 DOM
-
2026-06-07days on market $113,999 Active 311 DOM
-
2026-06-05days on market $113,999 Active 308 DOM
-
2026-06-03pricedays on market $113,999 Active 307 DOM
-
2026-06-02days on market $119,000 Active 306 DOM
-
2026-06-01days on market $119,000 Active 305 DOM
-
2026-05-31days on market $119,000 Active 304 DOM
-
2026-05-30days on market $119,000 Active 303 DOM
ⓘ Source: listings_history table (triggers on properties + properties_extension) + one-shot
backfill from property_details.listing_events for pre-trigger history.
Climate risk First Street
- Flood 1/10 Low FEMA zone X (unshaded) · 0% chance over 30 yrs
- Wildfire 6/10 Major
- Heat 7/10 Severe 7 d/yr ≥102°F today · 15 d/yr by 30 yrs out
- Wind 1/10 Low
- Air quality 10/10 Extreme 34 unhealthy d/yr today · 37 by 30 yrs out
Nearby sold comps map
Loading sold comps map…
Walkable amenities ~0.75 mi
Loading nearby amenities…
Taxation est. · year 1
- Rental income
- $28,498
- − Mortgage interest
- −$6,386
- − Property taxes
- −$1,710
- − Insurance
- −$570
- − Repairs & maintenance
- −$2,280
- − Management
- −$2,280
- − Depreciation
- −$3,316
- Taxable income
- $11,957
- Est. tax owed @ 24.0%
- −$2,870
- After-tax cash flow
- $10,190/yr
For passive investors: Depreciation is non-cash, so a rental often shows a tax loss while cash-flowing — sheltering income. Rental losses are passive: they offset passive income freely, and up to $25,000/yr can offset ordinary (W-2) income if you actively participate and your MAGI is under $100k (phasing out to $0 by $150k); unused losses carry forward. On sale, claimed depreciation is recaptured at up to 25%, and gains may owe capital-gains tax (a 1031 exchange can defer both). Figures are a year-1 estimate at your 24.0% rate — not tax advice; consult a CPA.
Condition & rehab AI · 14 photos
This manufactured home in Ceres Mobile Estates requires moderate repairs and maintenance to improve its condition and value. Painting the exterior siding and interior walls, and refinishing the flooring can significantly enhance its appeal and marketability.
Repairs flagged
- Minor Siding — Some wear visible on the exterior siding
- Minor Flooring — Some wear visible on the wooden flooring
- Minor Paint — Some wear visible on the interior walls
Value-add opportunities
- Resale Paint the exterior siding — Fresh paint can enhance curb appeal and property value
- Resale Refinish the wooden flooring — Refinished flooring can improve the home's aesthetic and value
- Resale Paint the interior walls — Fresh paint can make the interior look more inviting and modern
Renovation cost estimate screening
| Repair item | Severity | Est. cost |
|---|---|---|
| Siding · Some wear visible on the exterior siding | Minor | $500–3,000 |
| Flooring · Some wear visible on the wooden flooring | Minor | $500–3,000 |
| Paint · Some wear visible on the interior walls | Minor | $500–3,000 |
| Total estimated repair cost · 3 items | $1,500–9,000 |
Value-add ROI direction
- Resale Paint the exterior siding — Fresh paint can enhance curb appeal and property value ↑
- Resale Refinish the wooden flooring — Refinished flooring can improve the home's aesthetic and value ↑
- Resale Paint the interior walls — Fresh paint can make the interior look more inviting and modern ↑
ⓘ Cost ranges are severity-bucket heuristics (US national rule-of-thumb). Get contractor quotes + a written scope before underwriting a rehab budget.
Schools (NCES district)
- District
- Ceres Unified
- NCES district ID
- 0608130
- Math proficiency
- 15% ▼ -9.00%
- Reading proficiency
- 50% ▲ 12.00%
- Median HH income
- $48,178
- Composite
- 27.96/100
- National rank
- #6858
- State rank
- #303 of 517 in CA
Livability — Keyes
- Score
- 46/100
- State rank
- #1280
- US rank
- #26476
Category grades
Schools grade is shown separately in the Schools card above.
Census & demographics
- Census place
- Keyes, CA
- County
- Stanislaus County · 445,786 people
- City population
- 3,939
- Metro
- Modesto, CA
- Population (ZIP)
- 46,310
- Household income
- $80,627
- Rent vs Own
- Severe rent burden
- 1102.0
Population outlook (Stanislaus County) Hauer SSP2
- Today (2025)
- 579,493 people
- By 2030
- 598,000 · +3.2%
- By 2040
- 630,930 · +8.9%
- By 2050
- 658,300 · +13.6%
- By 2075
- 712,363 · +22.9%
- By 2100
- 719,805 · +24.2%
Race, ethnicity, and origin ACS 2023
- Neighborhood character
- Majority Hispanic (64%)
- Race & ethnicity
- Hispanic / Latino 64% Two or more races 34% White 23% Asian 8% Black 1%
- Hispanic origin (detail)
- Mexican 61%
- Common ancestry
- Russian 3% Lithuanian 1% Italian 1%
- Foreign-born
- 27% · Canada, China
- Languages at home
- 41% English-only · Spanish 49% Other Indo-European 7% Arabic 1%
Political lean MEDSL · Stanislaus
- 2024 margin
- R (+11.0) · D 43.2% · R 54.2% · Other 2.6%
- 2008→2024 swing
- -12.7pp toward R · 2008: 1.7pp · 2024: -11.0pp
- All cycles
- 2024: R+11.0 2020: D+0.8 2016: D+0.6 2012: D+0.7 2008: D+1.7
Not yet ingested
- Civics
- —
Market trends
- HPI YoY
- ▼ -362.75%
- Current HPI
- 307.5192
- Rent YoY
- —
- Metro
- Modesto, CA
- State GDP YoY
- ▲ 3.21%
- F500 in state
- 116
Industry mix (Fortune 500 HQ in CA)
| Industry | F500 HQs | Revenue |
|---|---|---|
| Technology | 27 | $1,492B |
|
||
| Financial Services | 3 | $174B |
|
||
| Retail | 3 | $44B |
|
||
| Insurance | 3 | $26B |
|
||
| Media / Entertainment | 2 | $115B |
|
||
| Pharmaceuticals / Biotech | 2 | $62B |
|
||
Cash-flow waterfall
monthlySold comps — $/sqft
last 12 mo · ≤1 miLoading sold comps…