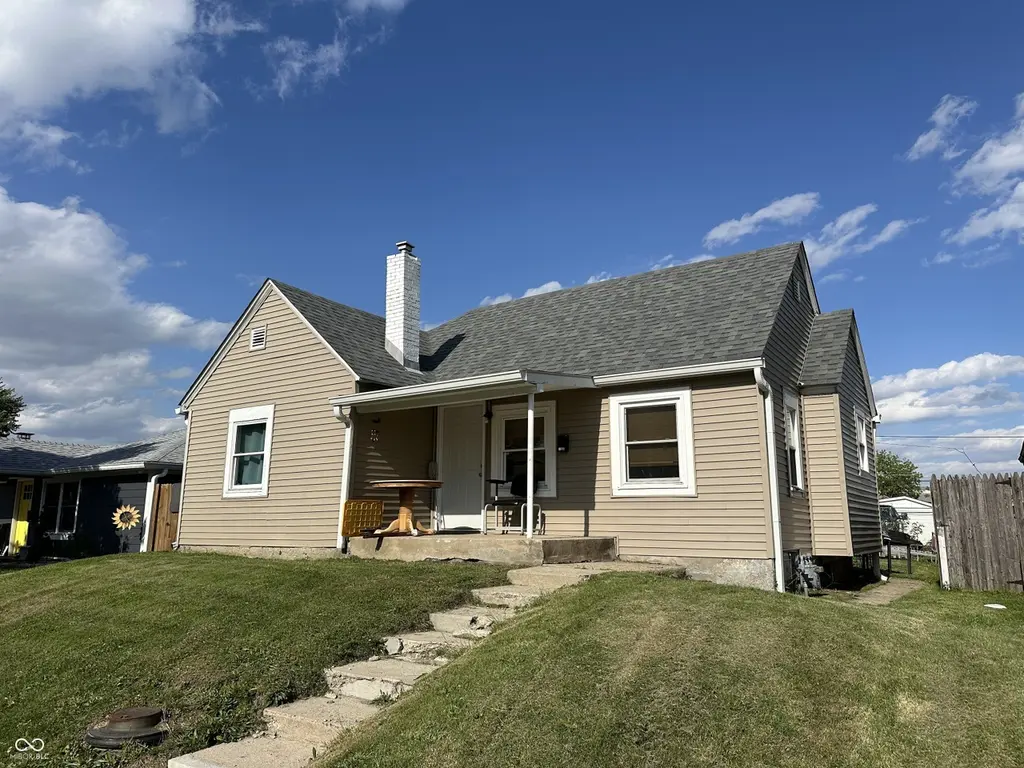
109 S 3rd Ave · Beech Grove, IN
Flood risk 1/10 · Minimal
- FEMA flood zone
- X (unshaded)
- Chance of flooding over 30 yrs
- 0.0%
- Est. flood insurance / yr
- $473 – $860
Fire risk 1/10 · Minimal
- Est. fire insurance / yr
- $717 – $1,331
Heat risk 4/10 · Minor
- Hot days now (above 102°F)
- 7 days/yr
- Hot days in 30 yrs
- 19 days/yr
Wind risk 2/10 · Minimal
- Chance of severe wind over 30 yrs
- 0.0%
Air-quality risk 3/10 · Minor
- Unhealthy air days now
- 2 days/yr
- Unhealthy air days in 30 yrs
- 3 days/yr
Risk factors via First Street. Map © Google.
Why this score? — see what drove the D grade
The composite is a weighted blend of 9 inputs, each scored 0–100. Each bar is that input's sub-score; the figure is the points it added to the 100-point composite (weight × sub-score).
- ARV discount +15.0/15.0
- Cash flow +11.4/30.0
- 1% rule +3.4/10.0
- DSCR +3.3/10.0
- Livability +3.2/5.0
- Rent growth +2.5/5.0
- Condition / age +2.5/5.0
- Schools +1.9/10.0
- Appreciation +0.0/10.0
$120,000
🖨 Deal sheet (PDF) 📄 Offer letter ✓ Due diligence
Listing remarks MLS
This home could be an excellent buy for either a family or investor. Home has been well maintained and at that price is will not last long.
Key facts
- Covered front porch
- 5,314 sq ft lot
- Garage
Tags
Property features AI
Finance
- Other: Property sits on approximately 0.12 acres
Exterior
- Parking: Detached 1-car garage
- Utilities: Public water; Municipal sewer connected
- Home design: Single family residence; Attached property; One story
- Construction: Vinyl siding; Block foundation
- Exterior features: Covered patio/porch
Interior
- Kitchen: Electric oven; Refrigerator
- Bedrooms: 2 bedrooms on the main level
- Bathrooms: 1 full bathroom on the main level
- Heating & cooling: Forced air heating; Central air conditioning
- Interior features: Electric oven; Refrigerator; Covered patio/porch; Basement present
- Laundry & utility: Solid waste service available
Neighborhood map
What this means for you Summary
Snapshot
- This is a 2-bed/1.0-bath single-family listed at $120k.
Deal economics
- At list price, monthly cash flow is $-42 ($-507/yr) — negative.
- To cash-flow at today's rent, offer at most $113k (6.2% below list).
- To meet the 1% rule (rent ≥ 1% of price), the offer needs to be $101k (15.9% below list).
- Recommended offer: $101k (15.9% below list) — sets the bar for 1% rule.
- Cap rate 5.9% vs local median 4.4% in Beech Grove — top-decile yield for the area; either an underpriced asset or a hidden risk that comps aren't pricing in. Stress-test before assuming the spread holds.
Location & tenants
- Location reads 63/100 on livability (#418 in IN) — a middle-class / working-renter tenant base. Strengths: cost of living A+, housing A+; Watch: health & safety C-, amenities F, commute F.
- Beech Grove City Schools (suburban): math 17% / reading 29% proficiency, ranked #269 of 301 in IN (top 89%) — low school quality limits family demand, transient renter base, plan for 1-2y turnover.
- Zoned schools: Hornet Park Elementary School (456 students, 75% FRL); Beech Grove Middle School (math 13% / reading 24%, grade F, #276 of 330 statewide, top 84%, 476 students, 78% FRL); Beech Grove Sr High School (math 17% / reading 47%, grade F, #295 of 369 statewide, top 82%, 918 students, 71% FRL) — zoned schools average 75% FRL vs 58% district-wide (17 pts higher); higher-poverty schools than district average — tighter screening recommended.
- Market conditions: 75 active listings in the ZIP; 4 comparable units currently listed for rent nearby; rentals lingering (median 46d on market — plan ~5-8 weeks vacancy on turnover, expect pricing pressure); 50% of comp listings sitting > 30 days — soft ceiling on asking rent; 1,906 units permitted in Marion County in 2024 (621 in 5+ unit buildings).
Forward outlook
- Local home prices are declining (-3.0%/yr); year-one equity from $830 of loan paydown is wiped out by about $4k of value loss. Plan a longer hold.
- Marion County population projected at +18% by 2050 — long-run rental-demand tailwind backs the buy-and-hold thesis.
Negotiation context
- It's been on market 38 days — a 3% lower offer ($116k) is reasonable based on typical stale-listing flexibility.
- 4 sale attempts since 23y ago with the ask held roughly flat each time — persistent listings suggest the price (not the market) is what's stuck; bring a comps-based counter.
- Current owner paid $36k; list at $120k implies a 233% gain — meaningful room to come down on a strong offer.
Risks & watch-outs
- Watch-outs: built in 1940 — expect roof / HVAC / electrical / plumbing capex.
Questions for the listing agent
- What do current leases actually rent for vs. the listed asking? Can we see a recent rent roll and the last 12 months of T-12 income?
- It's been on market 38 days. Have you received any prior offers? Is the seller open to a 16% concession, seller financing, or rate buy-down credit?
- Built in 1940 — when were the roof, HVAC, electrical panel, plumbing, and water heater last replaced?
- Is there a deadline driving the sale (1031 exchange, divorce, estate, relocation)? That informs how much negotiation room exists.
- Schools are F-rated, which usually means shorter tenancies and higher turnover. Who's the typical renter profile here, and what's been the actual vacancy rate?
- The area grade is low — what's the realistic commute time and amenity access for the typical tenant pool here? Any planned neighborhood developments (good or bad) we should know about?
- What's the average days-on-market for RENTAL listings here right now (not sales)? A rising rental-DOM trend means longer vacancies and softer asking-rent achievability than the comps imply.
- What's the recent tenant-quality profile in this submarket — average credit score on applications, eviction rate, late-payment / NSF rate, and stable-employment percentage? A property-management company in the area should have these aggregated.
- How much new for-sale + rental construction is in the pipeline within 1–3 miles? Heavy new supply typically softens prices + rents 12–24 months out; constrained supply supports both.
Investment metrics
- 1% rule
- 0.84% ✗
- Cap rate
- 5.87%
- Cash-on-cash
- -1.51%
- DSCR
- 0.93
- GRM
- 9.9
CMA / ARV
- ARV (median comp)
- $192,733
- List price
- $120,000
- Delta
- -37.74%
- Verdict
- UNDERPRICED
- Comps
- 20 within 1.0 mi
Show comp detail 6 sales within ~0.75 mi
| Address | Dist | Beds/Ba | Sqft | Sold | Price | $/sf | Match |
|---|---|---|---|---|---|---|---|
| 141 N 6th Ave | 0.41mi | 2/1.0 | 720 (+6%) | 3mo | $135,000 | $188 | 68 |
| 67 S 3rd Ave | 0.08mi | 2/1.0 | 775 (+14%) | 7mo | $170,000 | $219 | 67 |
| 515 Fletcher Ln | 0.37mi | 2/1.0 | 720 (+6%) | 9mo | $175,000 | $243 | 65 |
| 90 N 6th Ave | 0.34mi | 2/1.0 | 775 (+14%) | 14mo | $188,000 | $243 | 48 |
| 110 S 11th Ave S | 0.55mi | 2/1.0 | 630 (-7%) | 22mo | $127,500 | $202 | 45 |
| 311 N 8th Ave | 0.64mi | 2/1.0 | 768 (+13%) | 19mo | $160,000 | $208 | 32 |
Match score weights: distance 35% · size 25% · config 20% · recency 20%. Top-matched comps best support the ARV.
Projected returns pro-forma
-3.0% appreciation · 3.0% rent growth · sell at horizon
- IRR
- -18.8%
- Equity multiple
- 0.34×
- Total profit
- $-22,114
- Equity at exit
- $17,892
- IRR
- -11.2%
- Equity multiple
- 0.33×
- Total profit
- $-22,632
- Equity at exit
- $10,375
Cash invested: $33,600 (down + closing). Projections, not guarantees.
Landlord ↔ Tenant lean methodology
- Overall (STATE)
- 90 Strongly Landlord-Friendly
- State Indiana
- 90 Strongly Landlord-Friendly · R+11
- County
- — inherits STATE
- City
- — inherits STATE
ZIP-level market 46107
- Home prices YoY
- -29.1%
- Active inventory
- 75
- Price-to-rent
- 9.9×
Monthly cashflow live
- Estimated rent
- $1,010 medium interval (Pro) →
- Mortgage (P&I)
- −$629
- Tax from tax record
- −$160 /mo · $1,926/yr
- Insurance
- −$50
- HOA
- −$0
- Vacancy / Maint / Mgmt
- −$212
- Net cashflow
- $-42
Break-even live
Sensitivity live
| Price | -10% $26 | -5% $-8 | +0% $-42 | +5% $-76 | +10% $-110 |
|---|---|---|---|---|---|
| Rent | -10% $-122 | -5% $-82 | +0% $-42 | +5% $-2 | +10% $38 |
| Rate | -1.0pp $18 | -0.5pp $-12 | base $-42 | +0.5pp $-73 | +1.0pp $-105 |
UW: 25.0% down · 7.5% · 30yr · 1.5% tax · 5.0% vac · 8.0% maint · 8.0% mgmt
Financing live
Cash to close
- Down payment
- $30,000
- Closing costs
- $3,600
- Reserves months
- —
- Total cash needed
- —
Loan-product check · same deal, 3 products live
Conventional
25% down · 7.5% · 30yr
- Down + closing
- —
- Monthly P&I
- —
- Monthly cashflow
- —
- DSCR
- —
- Eligible?
- —
Personal DTI + credit; lowest rate.
DSCR
20% down · 8.5% · 30yr
- Down + closing
- —
- Monthly P&I
- —
- Monthly cashflow
- —
- DSCR
- —
- Eligible?
- —
No personal income docs; deal must DSCR.
Hard money
10% down · 12.0% · 12mo
- Down + closing
- —
- Monthly P&I
- —
- Monthly cashflow
- —
- DSCR
- —
- Eligible?
- —
Short-term bridge; refi at stabilization.
Rent comps 4 comps
| Address | Beds | Baths | Sqft | Rent | $/sqft | DOM | Units | Dist |
|---|---|---|---|---|---|---|---|---|
| 82 N 5th Ave Beech Grove, IN | 1.0 | 1.0 | 500 | $950 | $1.90 | 9d | 1 | 0.26mi |
| 64 N 6th Ave Apt 2 Beech Grove, IN | 1.0 | 1.0 | 550 | $825 | $1.50 | 14d | 1 | 0.28mi |
| 68 N 7th Ave #2 Beech Grove, IN | 1.0 | 1.0 | 600 | $825 | $1.38 | 45d | 1 | 0.33mi |
| 120 N 9th Ave Beech Grove, IN | 1.0 | 1.0 | 500 | $850 | $1.70 | 45d | 1 | 0.48mi |
Listing history 22 events
-
2026-06-21days on market $120,000 Active 38 DOM
-
2026-06-18days on market $120,000 Active 35 DOM
-
2026-06-17days on market $120,000 Active 34 DOM
-
2026-06-16days on market $120,000 Active 33 DOM
-
2026-06-15days on market $120,000 Active 32 DOM
-
2026-06-13days on market $120,000 Active 30 DOM
-
2026-06-13days on market $120,000 Active 29 DOM
-
2026-06-09days on market $120,000 Active 26 DOM
-
2026-06-08days on market $120,000 Active 25 DOM
-
2026-06-07days on market $120,000 Active 24 DOM
-
2026-06-03days on market $120,000 Active 20 DOM
-
2026-06-02days on market $120,000 Active 19 DOM
-
2026-06-01days on market $120,000 Active 18 DOM
-
2026-05-31days on market $120,000 Active 17 DOM
-
2026-05-12$120,000 Active 519-char remark
-
2017-06-02soldstatus $36,000 Sold 139-char remark
Show marketing remark (139 chars)
This home could be an excellent buy for either a family or investor. Home has been well maintained and at that price is will not last long.
-
2017-05-10status Pending 139-char remark
Show marketing remark (139 chars)
This home could be an excellent buy for either a family or investor. Home has been well maintained and at that price is will not last long.
-
2017-05-02$40,000 Active 139-char remark
Show marketing remark (139 chars)
This home could be an excellent buy for either a family or investor. Home has been well maintained and at that price is will not last long.
-
2004-12-31historical
-
2004-06-25$55,900
-
2003-08-25historical
-
2003-02-27$69,900
ⓘ Source: listings_history table (triggers on properties + properties_extension) + one-shot
backfill from property_details.listing_events for pre-trigger history.
Tax reassessment forecast IN · Partial reset (capped growth)
- Current annual tax
- $1,926 · $160/mo
- Projected year-2 tax
- $1,926 · $160/mo
- Expected delta
- $0/yr ($0/mo · 0.0%)
ⓘ Screening estimate from a state-policy table — verify with the county assessor before closing.
Climate risk First Street
- Flood 1/10 Low FEMA zone X (unshaded) · 0% chance over 30 yrs
- Wildfire 1/10 Low
- Heat 4/10 Moderate 7 d/yr ≥102°F today · 19 d/yr by 30 yrs out
- Wind 2/10 Low 0% chance of damaging wind over 30 yrs
- Air quality 3/10 Moderate 2 unhealthy d/yr today · 3 by 30 yrs out
Nearby sold comps map
Loading sold comps map…
Walkable amenities ~0.75 mi
Loading nearby amenities…
Taxation est. · year 1
- Rental income
- $12,115
- − Mortgage interest
- −$6,722
- − Property taxes
- −$1,926
- − Insurance
- −$600
- − Repairs & maintenance
- −$969
- − Management
- −$969
- − Depreciation
- −$3,491
- Taxable loss
- −$2,562
- Est. tax savings @ 24.0%
- +$615
- After-tax cash flow
- $108/yr
For passive investors: Depreciation is non-cash, so a rental often shows a tax loss while cash-flowing — sheltering income. Rental losses are passive: they offset passive income freely, and up to $25,000/yr can offset ordinary (W-2) income if you actively participate and your MAGI is under $100k (phasing out to $0 by $150k); unused losses carry forward. On sale, claimed depreciation is recaptured at up to 25%, and gains may owe capital-gains tax (a 1031 exchange can defer both). Figures are a year-1 estimate at your 24.0% rate — not tax advice; consult a CPA.
Schools (NCES district)
- District
- Beech Grove City Schools
- NCES district ID
- 1800450
- Math proficiency
- 17% ▼ -8.00%
- Reading proficiency
- 29% ▼ -6.00%
- Median HH income
- $38,775
- Composite
- 19.28/100
- National rank
- #8802
- State rank
- #269 of 301 in IN
Livability — Beech Grove
- Score
- 63/100
- State rank
- #418
- US rank
- #15174
Category grades
Schools grade is shown separately in the Schools card above.
Census & demographics
- Census place
- Beech Grove, IN
- County
- Marion County · 998,460 people
- City population
- 13,020
- Metro
- Indianapolis-Carmel-Anderson, IN
- Population (ZIP)
- 13,020
- Household income
- $56,799
- Rent vs Own
- Severe rent burden
- 326.0
Population outlook (Marion County) Hauer SSP2
- Today (2025)
- 1,025,572 people
- By 2030
- 1,065,727 · +3.9%
- By 2040
- 1,141,577 · +11.3%
- By 2050
- 1,208,920 · +17.9%
- By 2075
- 1,367,288 · +33.3%
- By 2100
- 1,438,201 · +40.2%
Race, ethnicity, and origin ACS 2023
- Neighborhood character
- Predominantly White (88%)
- Race & ethnicity
- White 88% Hispanic / Latino 6% Two or more races 4% Black 2%
- Hispanic origin (detail)
- Mexican 4%
- Common ancestry
- Slovak 3% Romanian 2% Iranian 2%
- Foreign-born
- 3% · Canada, Jamaica
- Languages at home
- 97% English-only · Spanish 2% Other Indo-European 1%
Political lean MEDSL · Marion
- 2024 margin
- Strong D (+27.7) · D 63.0% · R 35.3% · Other 1.7%
- 2008→2024 swing
- -0.7pp no change · 2008: 28.4pp · 2024: 27.7pp
- All cycles
- 2024: D+27.7 2020: D+29.1 2016: D+22.8 2012: D+22.2 2008: D+28.4
Not yet ingested
- Civics
- —
Market trends
- HPI YoY
- ▼ -112.00%
- Current HPI
- 272.2969
- Rent YoY
- —
- Metro
- Indianapolis-Carmel-Anderson, IN
- State GDP YoY
- ▲ 2.90%
- F500 in state
- 18
Industry mix (Fortune 500 HQ in IN)
| Industry | F500 HQs | Revenue |
|---|---|---|
| Industrial Machinery | 2 | $37B |
|
||
| Healthcare | 1 | $177B |
|
||
| Pharmaceuticals | 1 | $45B |
|
||
| Metals / Steel | 1 | $18B |
|
||
| Agriculture | 1 | $17B |
|
||
| Packaging | 1 | $12B |
|
||
Price history
+71.7% since first listed8 events — show timeline
- 2026-05-12 Listed $120,000 MIBOR as Distributed by MLS Grid
- 2017-06-02 Sold (MLS) $36,000 MIBOR as Distributed by MLS Grid
- 2017-05-10 Pending — MIBOR as Distributed by MLS Grid
- 2017-05-02 Listed $40,000 MIBOR as Distributed by MLS Grid
- 2004-12-31 Listing Removed — MIBOR as Distributed by MLS Grid
- 2004-06-25 Listed $55,900 MIBOR as Distributed by MLS Grid
- 2003-08-25 Listing Removed — MIBOR as Distributed by MLS Grid
- 2003-02-27 Listed $69,900 MIBOR as Distributed by MLS Grid
Property tax history
+5.5%/yrLatest (2025): $1,926 · +11.1% YoY. Source: county tax records.
Cash-flow waterfall
monthlySold comps — $/sqft
last 12 mo · ≤1 miLoading sold comps…