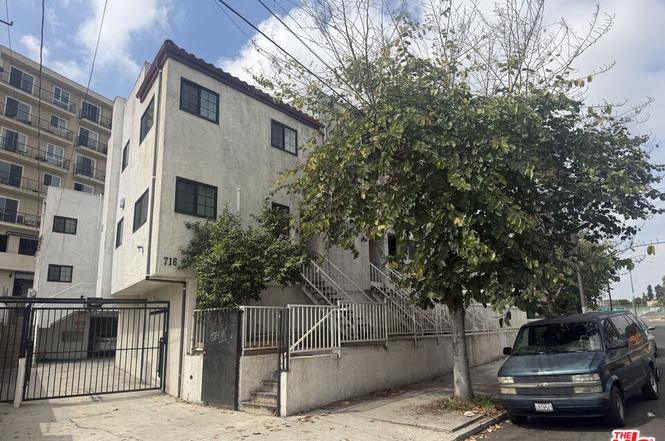
716 New Depot St Unit F · Los Angeles, CA
Flood risk 5/10 · Moderate
- FEMA flood zone
- X (unshaded)
- Chance of flooding over 30 yrs
- 0.24%
- Est. flood insurance / yr
- $507 – $1,088
Fire risk 1/10 · Minimal
- Est. fire insurance / yr
- $659 – $1,223
Heat risk 6/10 · Moderate
- Hot days now (above 93°F)
- 7 days/yr
- Hot days in 30 yrs
- 21 days/yr
Wind risk 1/10 · Minimal
- Chance of severe wind over 30 yrs
- —
Air-quality risk 6/10 · Moderate
- Unhealthy air days now
- 11 days/yr
- Unhealthy air days in 30 yrs
- 12 days/yr
Risk factors via First Street. Map © Google.
Why this score? — see what drove the D- grade
The composite is a weighted blend of 9 inputs, each scored 0–100. Each bar is that input's sub-score; the figure is the points it added to the 100-point composite (weight × sub-score).
- Cash flow +8.1/30.0
- ARV discount +7.5/15.0
- Appreciation +3.6/10.0
- Schools +3.6/10.0
- Livability +3.4/5.0
- 1% rule +2.6/10.0
- Condition / age +2.5/5.0
- Rent growth +2.3/5.0
- DSCR +2.1/10.0
$326,000
🖨 Deal sheet (PDF) 📄 Offer letter ✓ Due diligence
Listing remarks
Probate Sale! Estate of Chao Min Chen. ALL CASH SALE! Buyer must provide 10% Cashiers Check payable to the ESTATE OF CHAO MIN CHEN and Proof of Funds! This property is subject to confirmation and overbidding, the listing price is the minimum overbid, court date and time is June 18th, 2026 at 8:30 am in Department 418 at 111 North Hill Street, Los Angeles, CA 90012. This 2 bed; 2 bath Condominium built in 1989 features +/-802 Sq Ft of living space, APN: 5407-007-045. The owner passed away on the Property. The property is located near Chinatown. There is major water damage throughout the home. This is a major fixer. This Property is offered together with improvements thereon as is, where is,
Key facts
- $217 HOA
- Parking
- Pool
Property features AI
Finance
- Other: Zoning: LAR4
- Financial info: Listing marketed as Probate
- HOA & community: Annual HOA fee of $2,600; Association does not allow pets; Complex name: a; Complex contains 1 unit
Exterior
- Parking: One covered parking space; Garage described as 'Other'
- Home design: Residential condominium, attached; Entry on level 1; Unit located on first floor
- Construction: Attached construction
- Exterior features: Community pool described as 'Other Pool (See Remarks)'
Interior
- Flooring: Other flooring
- Bathrooms: Two full bathrooms
- Heating & cooling: Other heating; Other cooling
- Interior features: One-level layout; Additional room (unspecified)
- Laundry & utility: Laundry setup described as 'Other (See Remarks)'
Neighborhood map
What this means for you Summary
Snapshot
- This is a 2-bed/2.0-bath condo listed at $326k.
Deal economics
- At list price, monthly cash flow is $-320 ($-4k/yr) — negative.
- To cash-flow at today's rent, offer at most $270k (17.3% below list).
- To meet the 1% rule (rent ≥ 1% of price), the offer needs to be $248k (23.8% below list).
- Recommended offer: $248k (23.8% below list) — sets the bar for 1% rule.
- Cap rate 5.1% vs local median 2.1% in Los Angeles — top-decile yield for the area; either an underpriced asset or a hidden risk that comps aren't pricing in. Stress-test before assuming the spread holds.
Location & tenants
- Location reads 68/100 on livability (#273 in CA) — a middle-class / working-renter tenant base. Strengths: amenities A+, commute A+, employment B; Watch: health & safety C-, crime F, cost of living F.
- Los Angeles Unified (urban): math 29% / reading 54% proficiency, ranked #223 of 517 in CA (top 43%) — families likely to look elsewhere, expect single-tenant / working-renter base with shorter leases; 67% free/reduced lunch — lower-income household profile, screen leases tightly.
- Zoned schools: Castelar Street Elementary (584 students, 85% FRL); Florence Nightingale Middle (790 students, 93% FRL); Ramon C. Cortines School of Visual And Performing Arts (math 18% / reading 62%, grade F, #514 of 1,170 statewide, top 44%, 1,171 students, 69% FRL) — zoned schools average 82% FRL vs 67% district-wide (15 pts higher); higher-poverty schools than district average — tighter screening recommended.
- Market conditions: Rents soft (-0.9%/yr); 109 active listings in the ZIP; 40 comparable units currently listed for rent nearby; rentals at typical pace (median 17d on market — plan ~3-4 weeks tenant-placement turnaround); 19,697 units permitted in Los Angeles County in 2024 (9,426 in 5+ unit buildings).
- This rent runs 45% of the median local income ($67k/yr) — at the standard rent-burdened threshold; future hikes will face affordability resistance.
Forward outlook
- Local home prices are declining (-2.7%/yr); year-one equity from $2k of loan paydown is wiped out by about $9k of value loss. Plan a longer hold.
- Los Angeles County population projected at +9% by 2050 — modest demand growth; plan on rents tracking national, not racing it.
Negotiation context
- It's been on market 63 days — a 6% lower offer ($306k) is reasonable based on typical stale-listing flexibility.
- Current owner paid $125k; list at $326k implies a 161% gain — meaningful room to come down on a strong offer.
Risks & watch-outs
- Climate carrying-cost: moderate flood risk; extreme-heat days projected 7→21/yr by 2055 (HVAC capex compounding) — expect insurance premiums to compound above CPI over the hold.
Questions for the listing agent
- What do current leases actually rent for vs. the listed asking? Can we see a recent rent roll and the last 12 months of T-12 income?
- It's been on market 63 days. Have you received any prior offers? Is the seller open to a 24% concession, seller financing, or rate buy-down credit?
- What does the HOA fee cover, when was the last increase, and are there any pending special assessments or reserve-fund shortfalls?
- Any open or pending special assessments — roof, HVAC, plumbing, elevator, façade? What's the per-unit balance and payoff schedule, and is the seller paying it off at close or rolling it to the buyer?
- Why hasn't it sold? Are there any deal-killer items the seller is aware of (foundation, flood, title, zoning, code violations)?
- Is there a deadline driving the sale (1031 exchange, divorce, estate, relocation)? That informs how much negotiation room exists.
- Schools are D-rated, which usually means shorter tenancies and higher turnover. Who's the typical renter profile here, and what's been the actual vacancy rate?
- Crime grade is F in this area — have there been break-ins, vandalism, or insurance claims at this property in the last 3 years? What carrier currently insures it and at what premium?
- The area grade is low — what's the realistic commute time and amenity access for the typical tenant pool here? Any planned neighborhood developments (good or bad) we should know about?
- What's the average days-on-market for RENTAL listings here right now (not sales)? A rising rental-DOM trend means longer vacancies and softer asking-rent achievability than the comps imply.
- What's the recent tenant-quality profile in this submarket — average credit score on applications, eviction rate, late-payment / NSF rate, and stable-employment percentage? A property-management company in the area should have these aggregated.
- How much new apartment / multifamily construction is in the pipeline within 1–3 miles? Heavy new supply (>2% of stock underway) typically softens rents 12–24 months out; light construction supports rent growth.
Investment metrics
- 1% rule
- 0.76% ✗
- Cap rate
- 5.12%
- Cash-on-cash
- -4.20%
- DSCR
- 0.81
- GRM
- 10.9
CMA / ARV
No comps found within radius.
Projected returns pro-forma
-2.71% appreciation · 0.0% rent growth · sell at horizon
- IRR
- -24.4%
- Equity multiple
- 0.16×
- Total profit
- $-76,429
- Equity at exit
- $52,834
- IRR
- -28.4%
- Equity multiple
- -0.28×
- Total profit
- $-117,253
- Equity at exit
- $35,499
Cash invested: $91,280 (down + closing). Projections, not guarantees.
Landlord ↔ Tenant lean methodology
- Overall (CITY)
- 0 Strongly Tenant-Friendly
- State California
- 18 Strongly Tenant-Friendly · D+13
- County
- — inherits STATE
- City Los Angeles
- 0 Strongly Tenant-Friendly · D+22
ZIP-level market 90012
- Home prices YoY
- -0.8%
- Rents YoY
- -0.9%
- Active inventory
- 109
- Price-to-rent
- 10.9×
Monthly cashflow live
- Estimated rent
- $2,484 high interval (Pro) →
- Mortgage (P&I)
- −$1,710
- Tax from tax record
- −$220 /mo · $2,636/yr
- Insurance
- −$136
- HOA
- −$217
- Vacancy / Maint / Mgmt
- −$522
- Net cashflow
- $-320
Break-even live
Sensitivity live
| Price | -10% $-135 | -5% $-227 | +0% $-320 | +5% $-412 | +10% $-504 |
|---|---|---|---|---|---|
| Rent | -10% $-516 | -5% $-418 | +0% $-320 | +5% $-221 | +10% $-123 |
| Rate | -1.0pp $-155 | -0.5pp $-237 | base $-320 | +0.5pp $-404 | +1.0pp $-490 |
UW: 25.0% down · 7.5% · 30yr · 1.5% tax · 5.0% vac · 8.0% maint · 8.0% mgmt
Financing live
Cash to close
- Down payment
- $81,500
- Closing costs
- $9,780
- Reserves months
- —
- Total cash needed
- —
Loan-product check · same deal, 3 products live
Conventional
25% down · 7.5% · 30yr
- Down + closing
- —
- Monthly P&I
- —
- Monthly cashflow
- —
- DSCR
- —
- Eligible?
- —
Personal DTI + credit; lowest rate.
DSCR
20% down · 8.5% · 30yr
- Down + closing
- —
- Monthly P&I
- —
- Monthly cashflow
- —
- DSCR
- —
- Eligible?
- —
No personal income docs; deal must DSCR.
Hard money
10% down · 12.0% · 12mo
- Down + closing
- —
- Monthly P&I
- —
- Monthly cashflow
- —
- DSCR
- —
- Eligible?
- —
Short-term bridge; refi at stabilization.
Rent comps 40 comps
| Address | Beds | Baths | Sqft | Rent | $/sqft | DOM | Units | Dist |
|---|---|---|---|---|---|---|---|---|
| 816 New Depot St Unit 2 Los Angeles, CA | 2.0 | 1.0 | 750 | $1,950 | $2.60 | 3d | 1 | 0.04mi |
| 839 N Bunker Hill Ave Unit 839 Los Angeles, CA | 2.0 | 1.0 | 720 | $2,799 | $3.89 | 45d | 1 | 0.04mi |
| 849 N Bunker Hill Ave Los Angeles, CA | 1.0 | 1.0 | 750 | $2,109 | $2.81 | 5d | 1 | 0.05mi |
| 852 N Bunker Hill Ave Unit 105 Los Angeles, CA | 2.0 | 1.0 | 1000 | $2,350 | $2.35 | 16d | 1 | 0.07mi |
| 807 N Bunker Hill Ave Los Angeles, CA | 2.0 | 1.0–2.0 | 800 | $2,075 | $2.59 | 3d | 3 | 0.08mi |
| 829 Alpine St Unit 6 Los Angeles, CA | 2.0 | 1.0 | 700 | $2,500 | $3.57 | 45d | 1 | 0.12mi |
| 900 W College St Unit 8 Los Angeles, CA | 2.0 | 1.0 | 850 | $2,295 | $2.70 | 19d | 1 | 0.12mi |
| 900 W College St Los Angeles, CA | 2.0 | 1.0 | 850 | $2,495 | $2.94 | 21d | 1 | 0.12mi |
| 900 W College St Unit 04 Los Angeles, CA | 2.0 | 1.0 | 850 | $2,495 | $2.94 | 26d | 1 | 0.12mi |
| 900 W College St Unit 1A Los Angeles, CA | 1.0 | 1.0 | 750 | $2,195 | $2.93 | 45d | 1 | 0.12mi |
| 900 W College St Los Angeles, CA | 2.0 | 1.0 | 850 | $2,495 | $2.94 | 17d | 1 | 0.12mi |
| 713 N Grand Ave Unit 6-A Los Angeles, CA | 1.0 | 1.0 | 700 | $1,850 | $2.64 | 45d | 1 | 0.14mi |
| 918 W College St #410 Los Angeles, CA | 2.0 | 2.0 | 806 | $2,600 | $3.23 | 26d | 1 | 0.16mi |
| 930 Figueroa Ter Los Angeles, CA | 1.0–2.0 | 1.0–2.0 | 732 | $2,619 | $3.58 | 1d | 7 | 0.16mi |
| 700 N Hill Pl Los Angeles, CA | 1.0–2.0 | 1.0–2.0 | 875 | $2,950 | $3.37 | 45d | 3 | 0.24mi |
| 601 N Grand Ave Los Angeles, CA | 2.0 | 1.0–2.0 | 625 | $2,555 | $4.09 | 1d | 13 | 0.25mi |
| 832 N Beaudry Ave Unit 06 Los Angeles, CA | 3.0 | 1.0 | 1000 | $3,000 | $3.00 | 26d | 1 | 0.25mi |
| 964 Yale St Unit 964 Los Angeles, CA | 3.0 | 2.0 | 1000 | $3,000 | $3.00 | 45d | 1 | 0.26mi |
| 550 N Figueroa St Los Angeles, CA | 2.0 | 1.0–2.0 | 799 | $3,249 | $4.07 | 1d | 19 | 0.29mi |
| 636 N Hill Pl Los Angeles, CA | 2.0 | 1.0 | 750 | $2,600 | $3.47 | 26d | 1 | 0.31mi |
| 945 N Beaudry Ave Los Angeles, CA | 2.0 | 1.0 | 720 | $2,695 | $3.74 | 3d | 1 | 0.32mi |
| 938 White Knoll Dr Unit 09 Los Angeles, CA | 2.0 | 1.0 | 800 | $2,700 | $3.38 | 4d | 1 | 0.33mi |
| 1053 Figueroa Ter Los Angeles, CA | 2.0 | 2.0 | 850 | $3,000 | $3.53 | 1d | 1 | 0.36mi |
| 1115 W Sunset Blvd Los Angeles, CA | 2.0 | 1.0–2.0 | 837 | $5,199 | $6.21 | 16d | 4 | 0.37mi |
| 900 N Broadway Los Angeles, CA | 1.0 | 1.0 | 646 | $2,583 | $4.00 | 1d | 7 | 0.40mi |
| 920 Everett St Unit 6 Los Angeles, CA | 2.0 | 1.5 | 800 | $2,137 | $2.67 | 15d | 1 | 0.41mi |
| 920 Everett St Apt E Los Angeles, CA | 3.0 | 2.0 | 800 | $2,137 | $2.67 | 1d | 1 | 0.41mi |
| 920 Everett St Unit 5 Los Angeles, CA | 3.0 | 1.5 | 800 | $2,374 | $2.97 | 26d | 1 | 0.41mi |
| 920 Everett St Unit 5 Los Angeles, CA | 2.0 | 1.5 | 800 | $2,137 | $2.67 | 4d | 1 | 0.41mi |
| 920 Everett St Unit 5 Los Angeles, CA | 2.0 | 1.5 | 800 | $2,137 | $2.67 | 0d | 1 | 0.41mi |
| 920 Everett St Apt E Los Angeles, CA | 3.0 | 2.0 | 800 | $2,137 | $2.67 | 14d | 1 | 0.41mi |
| 920 Everett St Los Angeles, CA | 3.0 | 1.5 | 800 | $2,137 | $2.67 | 13d | 1 | 0.41mi |
| 639 N Broadway Los Angeles, CA | 2.0 | 1.0–2.0 | 969 | $3,084 | $3.18 | 0d | 13 | 0.41mi |
| 1139 Bellevue Ave Los Angeles, CA | 2.0 | 1.0 | 544 | $2,395 | $4.40 | 45d | 1 | 0.44mi |
| 1139 Bellevue Ave Unit 8 Los Angeles, CA | 2.0 | 1.0 | 544 | $2,395 | $4.40 | 45d | 1 | 0.44mi |
| 1139 Bellevue Ave Unit 6 Los Angeles, CA | 2.0 | 1.0 | 544 | $2,395 | $4.40 | 45d | 1 | 0.44mi |
| 909 W Temple St Los Angeles, CA | 3.0 | 1.0–3.0 | 894 | $3,176 | $3.55 | 3d | 24 | 0.44mi |
| 981 Everett St Los Angeles, CA | 2.0 | 2.0 | 980 | $2,795 | $2.85 | 3d | 1 | 0.49mi |
| 1011 Everett St Los Angeles, CA | 1.0–3.0 | 1.0–3.0 | 1085 | $4,145 | $3.82 | 5d | 5 | 0.51mi |
| 1100 W Temple St Los Angeles, CA | 1.0 | 1.0 | 603 | $2,395 | $3.97 | 45d | 7 | 0.52mi |
HOA detail condo
- Monthly dues
- $217 · $2,604/yr
- Likely covers
- water
- Assessments
- None detected in remarks — confirm with the listing agent.
Listing history 20 events
-
2026-06-21statusdays on market $326,000 Pending 63 DOM
-
2026-06-18days on market $326,000 Backup Offers Accepted 62 DOM
-
2026-06-17days on market $326,000 Backup Offers Accepted 61 DOM
-
2026-06-16days on market $326,000 Backup Offers Accepted 60 DOM
-
2026-06-15days on market $326,000 Backup Offers Accepted 59 DOM
-
2026-06-13days on market $326,000 Backup Offers Accepted 57 DOM
-
2026-06-09days on market $326,000 Backup Offers Accepted 53 DOM
-
2026-06-08days on market $326,000 Backup Offers Accepted 52 DOM
-
2026-06-07days on market $326,000 Backup Offers Accepted 51 DOM
-
2026-06-04days on market $326,000 Backup Offers Accepted 48 DOM
-
2026-06-03days on market $326,000 Backup Offers Accepted 47 DOM
-
2026-06-02days on market $326,000 Backup Offers Accepted 46 DOM
-
2026-06-01days on market $326,000 Backup Offers Accepted 45 DOM
-
2026-05-31days on market $326,000 Backup Offers Accepted 44 DOM
-
2026-05-04historical Backup Offers Accepted 764-char remark
-
2026-05-04price $326,000 764-char remark
-
2026-04-27price $199,000 764-char remark
-
2026-04-18price $205,000 764-char remark
-
2026-04-17$370,000 Active 764-char remark
-
1992-07-23soldstatus $125,000
ⓘ Source: listings_history table (triggers on properties + properties_extension) + one-shot
backfill from property_details.listing_events for pre-trigger history.
Tax reassessment forecast CA · Resets to sale price
- Current annual tax
- $2,636 · $220/mo
- Projected year-2 tax
- $2,636 · $220/mo
- Expected delta
- $0/yr ($0/mo · 0.0%)
ⓘ Screening estimate from a state-policy table — verify with the county assessor before closing.
Climate risk First Street
- Flood 5/10 Major FEMA zone X (unshaded) · 24% chance over 30 yrs
- Wildfire 1/10 Low
- Heat 6/10 Major 7 d/yr ≥93°F today · 21 d/yr by 30 yrs out
- Wind 1/10 Low
- Air quality 6/10 Major 11 unhealthy d/yr today · 12 by 30 yrs out
Nearby sold comps map
Loading sold comps map…
Walkable amenities ~0.75 mi
Loading nearby amenities…
Taxation est. · year 1
- Rental income
- $29,811
- − Mortgage interest
- −$18,261
- − Property taxes
- −$2,636
- − Insurance
- −$1,630
- − Repairs & maintenance
- −$2,385
- − Management
- −$2,385
- − HOA
- −$2,604
- − Depreciation
- −$9,484
- Taxable loss
- −$9,574
- Est. tax savings @ 24.0%
- +$2,298
- After-tax cash flow
- $-1,537/yr
For passive investors: Depreciation is non-cash, so a rental often shows a tax loss while cash-flowing — sheltering income. Rental losses are passive: they offset passive income freely, and up to $25,000/yr can offset ordinary (W-2) income if you actively participate and your MAGI is under $100k (phasing out to $0 by $150k); unused losses carry forward. On sale, claimed depreciation is recaptured at up to 25%, and gains may owe capital-gains tax (a 1031 exchange can defer both). Figures are a year-1 estimate at your 24.0% rate — not tax advice; consult a CPA.
Schools (NCES district)
- District
- Los Angeles Unified
- NCES district ID
- 0622710
- Math proficiency
- 29% ▼ -4.00%
- Reading proficiency
- 54% ▲ 10.00%
- Median HH income
- $50,403
- Composite
- 35.67/100
- National rank
- #4875
- State rank
- #223 of 517 in CA
Livability — Los Angeles
- Score
- 68/100
- State rank
- #273
- US rank
- #9237
Category grades
Schools grade is shown separately in the Schools card above.
Census & demographics
- Census place
- Los Angeles, CA
- County
- Los Angeles County · 9,444,647 people
- City population
- 3,838,149
- Metro
- Los Angeles-Long Beach-Anaheim, CA
- Population (ZIP)
- 37,336
- Household income
- $66,860
- Rent vs Own
- Severe rent burden
- 3885.0
Population outlook (Los Angeles County) Hauer SSP2
- Today (2025)
- 10,940,515 people
- By 2030
- 11,256,481 · +2.9%
- By 2040
- 11,729,929 · +7.2%
- By 2050
- 11,948,407 · +9.2%
- By 2075
- 11,818,114 · +8.0%
- By 2100
- 10,842,928 · -0.9%
Race, ethnicity, and origin ACS 2023
- Neighborhood character
- Highly diverse neighborhood (Simpson 0.74)
- Race & ethnicity
- Asian 35% Hispanic / Latino 29% White 19% Black 12% Two or more races 10%
- Hispanic origin (detail)
- Mexican 18% Cuban 1%
- Common ancestry
- Romanian 1% Lithuanian 1% Scotch-Irish 1%
- Foreign-born
- 42% · China, Canada, South Korea
- Languages at home
- 43% English-only · Spanish 22% Chinese 14% Korean 6%
Political lean MEDSL · Los Angeles
- 2024 margin
- Solid D (+32.9) · D 64.8% · R 31.9% · Other 3.3%
- 2008→2024 swing
- -7.4pp toward R · 2008: 40.4pp · 2024: 32.9pp
- All cycles
- 2024: D+32.9 2020: D+44.2 2016: D+48.0 2012: D+40.0 2008: D+40.4
Not yet ingested
- Civics
- —
Market trends
- HPI YoY
- ▼ -2.71%
- Current HPI
- 333.4828
- Rent YoY
- ▼ -0.90%
- Metro
- Los Angeles-Long Beach-Anaheim, CA
- State GDP YoY
- ▲ 3.21%
- F500 in state
- 116
Industry mix (Fortune 500 HQ in CA)
| Industry | F500 HQs | Revenue |
|---|---|---|
| Technology | 27 | $1,492B |
|
||
| Financial Services | 3 | $174B |
|
||
| Retail | 3 | $44B |
|
||
| Insurance | 3 | $26B |
|
||
| Media / Entertainment | 2 | $115B |
|
||
| Pharmaceuticals / Biotech | 2 | $62B |
|
||
Price history
+160.8% since first listed7 events — show timeline
- 2026-06-19 Pending — TheMLS
- 2026-05-04 Contingent — TheMLS
- 2026-05-04 Price Changed $326,000 TheMLS
- 2026-04-27 Price Changed $199,000 TheMLS
- 2026-04-18 Price Changed $205,000 TheMLS
- 2026-04-17 Listed $370,000 TheMLS
- 1992-07-23 Sold (Public Records) $125,000 Public Records
Property tax history
+1.7%/yrLatest (2025): $2,636 · +1.5% YoY. Source: county tax records.
Cash-flow waterfall
monthlySold comps — $/sqft
last 12 mo · ≤1 miLoading sold comps…