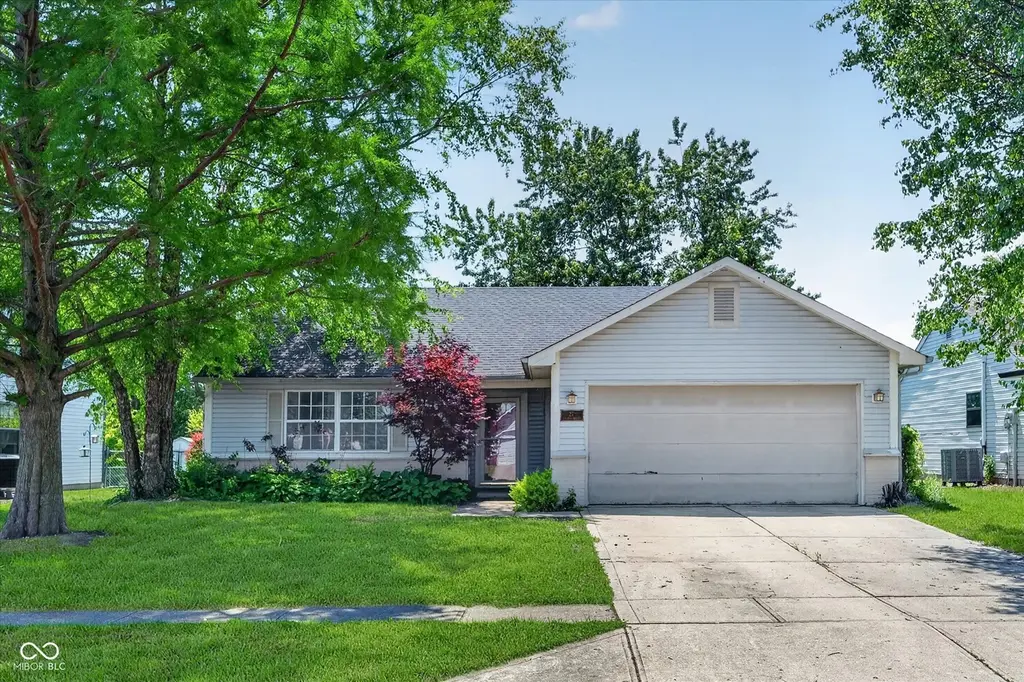
27 Lake Dr S · Brownsburg, IN
Flood risk 1/10 · Minimal
- FEMA flood zone
- X (unshaded)
- Chance of flooding over 30 yrs
- 0.0%
- Est. flood insurance / yr
- $507 – $1,088
Fire risk 1/10 · Minimal
- Est. fire insurance / yr
- $717 – $1,331
Heat risk 3/10 · Minor
- Hot days now (above 100°F)
- 7 days/yr
- Hot days in 30 yrs
- 19 days/yr
Wind risk 2/10 · Minimal
- Chance of severe wind over 30 yrs
- 0.0%
Air-quality risk 2/10 · Minimal
- Unhealthy air days now
- 1 days/yr
- Unhealthy air days in 30 yrs
- 2 days/yr
Risk factors via First Street. Map © Google.
Why this score? — see what drove the D grade
The composite is a weighted blend of 9 inputs, each scored 0–100. Each bar is that input's sub-score; the figure is the points it added to the 100-point composite (weight × sub-score).
- Cash flow +10.1/30.0
- ARV discount +7.5/15.0
- Schools +6.3/10.0
- Rent growth +4.1/5.0
- Livability +3.8/5.0
- 1% rule +3.2/10.0
- DSCR +2.9/10.0
- Condition / age +2.5/5.0
- Appreciation +0.0/10.0
$240,000
🖨 Deal sheet (PDF) 📄 Offer letter ✓ Due diligence
Listing remarks MLS
Open concept, split bedroom floor plan ranch in desirable Brownsburg neighborhood. Great room with fireplace and cathedral ceiling. Kitchen features stainless steel appliances and white cabinets. Owner suite with private bath. Fabulously spacious, privacy fenced back yard great for kids, pets, leisure activity, a garden and entertaining features big deck and mini-barn. Recent updates since 2016 include shingles, interior paint, some flooring and fixtures. Washer and dryer also stay. One year home warranty included.
Key facts
- Quiet street
- Desirable location
- Functional layout
Tags
Property features AI
Finance
- Other: Lot is approximately 0.15 acre (<1/4 acre); Mandatory fee ownership interest
- HOA & community: Homeowners association with an annual fee of $207; Association fee covers entrance common and maintenance
Exterior
- Parking: Attached finished garage; Two garage spaces
- Security: Smoke alarm
- Utilities: Public water; Municipal sewer connected; 200+ amp electric service; Cable available; Electricity connected; Sewer connected; Water connected
- Home design: Single-family residential; One story; North-facing; Listed condition: fixer
- Construction: Vinyl with brick exterior; Slab foundation
- Exterior features: Covered deck; Mini barn; Storage shed; Full privacy fence; Mature trees; Sidewalks and street lights
Interior
- Kitchen: Dishwasher; Electric oven; Microwave with hood; Refrigerator; Garbage disposal
- Bedrooms: Three bedrooms on the main level; Primary bedroom with split layout and walk-in closet
- Bathrooms: Two full bathrooms on the main level; Primary bath with tub and shower
- Heating & cooling: Forced air heating; Heat pump; Electric heating; Central air conditioning
- Interior features: Attic access; Vaulted ceilings; Eat-in kitchen; Pantry; Smart thermostat; Walk-in closet(s); Painted woodwork; Laundry in unit; One wood-burning fireplace in the great room
- Laundry & utility: Main-level laundry; Electric water heater
Neighborhood map
What this means for you Summary
Snapshot
- This is a 3-bed/2.0-bath single-family listed at $240k.
Deal economics
- At list price, monthly cash flow is $-141 ($-2k/yr) — negative.
- To cash-flow at today's rent, offer at most $215k (10.4% below list).
- To meet the 1% rule (rent ≥ 1% of price), the offer needs to be $196k (18.3% below list).
- Recommended offer: $196k (18.3% below list) — sets the bar for 1% rule.
- Cap rate 5.6% vs local median 3.8% in Brownsburg — top-decile yield for the area; either an underpriced asset or a hidden risk that comps aren't pricing in. Stress-test before assuming the spread holds.
Location & tenants
- Location reads 75/100 on livability (#61 in IN, #4,105 nationally) — a middle-class / working-renter tenant base. Strengths: crime A+, employment A+, cost of living A+; Watch: amenities F, commute F, health & safety F.
- Brownsburg Community School Corporation (suburban): math 72% / reading 72% proficiency, ranked #2 of 301 in IN (top 1%) — strong family-tenant draw, lease renewals of 3-5y typical; only 17% free/reduced lunch — higher-income household profile.
- Zoned schools: Eagle Elementary School (math 84% / reading 75%, grade A, #8 of 994 statewide, top 1%, 586 students, 28% FRL); Brownsburg High School (math 61% / reading 83%, grade B+, #12 of 369 statewide, top 4%, 3,177 students, 33% FRL).
- Market conditions: Rents rising fast (+6.3%/yr); 340 active listings in the ZIP; 4 comparable units currently listed for rent nearby; rentals leasing fast (median 9d on market — plan ~1-2 weeks tenant-placement turnaround); high-income renter base; 1,294 units permitted in Hendricks County in 2024 (18 in 5+ unit buildings).
Forward outlook
- Local home prices are declining (-3.0%/yr); year-one equity from $2k of loan paydown is wiped out by about $7k of value loss. Plan a longer hold.
- Hendricks County population projected at +35% by 2050 — long-run rental-demand tailwind backs the buy-and-hold thesis.
Negotiation context
- Only 1 days on market — expect competitive offers; lowballing is unlikely to land.
- 7 sale attempts since 26y ago with the ask held roughly flat each time — persistent listings suggest the price (not the market) is what's stuck; bring a comps-based counter.
- Current owner paid $165k; 45% above their basis — modest negotiation headroom, anchor on the comps not their cost.
Questions for the listing agent
- What do current leases actually rent for vs. the listed asking? Can we see a recent rent roll and the last 12 months of T-12 income?
- What does the HOA fee cover, when was the last increase, and are there any pending special assessments or reserve-fund shortfalls?
- Is there a deadline driving the sale (1031 exchange, divorce, estate, relocation)? That informs how much negotiation room exists.
- Schools are A-rated — typically a magnet for longer-tenancy family renters. What's the average tenant stay here, and is there a school-zone premium baked into asking?
- The area grade is low — what's the realistic commute time and amenity access for the typical tenant pool here? Any planned neighborhood developments (good or bad) we should know about?
- What's the average days-on-market for RENTAL listings here right now (not sales)? A rising rental-DOM trend means longer vacancies and softer asking-rent achievability than the comps imply.
- What's the recent tenant-quality profile in this submarket — average credit score on applications, eviction rate, late-payment / NSF rate, and stable-employment percentage? A property-management company in the area should have these aggregated.
- How much new for-sale + rental construction is in the pipeline within 1–3 miles? Heavy new supply typically softens prices + rents 12–24 months out; constrained supply supports both.
Investment metrics
- 1% rule
- 0.82% ✗
- Cap rate
- 5.59%
- Cash-on-cash
- -2.53%
- DSCR
- 0.89
- GRM
- 10.2
CMA / ARV
- ARV (on-the-fly)
- $240,000
- Comps found
- 12
Show comp detail 12 sales within ~0.75 mi
| Address | Dist | Beds/Ba | Sqft | Sold | Price | $/sf | Match |
|---|---|---|---|---|---|---|---|
| 27 Lake Dr S | 0.00mi | 3/2.0 | 1,200 (0%) | 1mo | $240,000 | $200 | 99 |
| 6 Kristelli Ct | 0.15mi | 3/2.0 | 1,200 (0%) | 2mo | $270,000 | $225 | 91 |
| 2 Nash Ct | 0.10mi | 3/2.0 | 1,308 (+9%) | 4mo | $268,000 | $205 | 77 |
| 1493 Hideaway Cir | 0.27mi | 2/2.0 (-1) | 1,260 (+5%) | 1mo | $296,500 | $235 | 73 |
| 108 Prairie Pkwy | 0.52mi | 3/2.0 | 1,175 (-2%) | 0mo | $252,000 | $214 | 72 |
| 48 Picadilly Ct | 0.36mi | 3/1.5 | 1,274 (+6%) | 4mo | $230,000 | $181 | 68 |
| 6750 E County Road 425 N | 0.32mi | 3/2.0 | 1,360 (+13%) | 3mo | $300,000 | $221 | 60 |
| 14 James Ct | 0.67mi | 3/1.0 | 1,232 (+3%) | 3mo | $165,000 | $134 | 58 |
| 506 S Green St | 0.70mi | 3/1.0 | 1,264 (+5%) | 2mo | $245,000 | $194 | 53 |
| 308 Maplebrook Dr | 0.70mi | 3/1.5 | 1,275 (+6%) | 6mo | $234,000 | $184 | 50 |
| 541 S Alpha Ave | 0.68mi | 3/2.0 | 1,361 (+13%) | 0mo | $230,000 | $169 | 46 |
| 527 S Grant St | 0.75mi | 3/1.5 | 1,307 (+9%) | 5mo | $256,000 | $196 | 44 |
Match score weights: distance 35% · size 25% · config 20% · recency 20%. Top-matched comps best support the ARV.
Projected returns pro-forma
-3.0% appreciation · 6.31% rent growth · sell at horizon
- IRR
- -16.8%
- Equity multiple
- 0.39×
- Total profit
- $-41,101
- Equity at exit
- $35,785
- IRR
- -3.4%
- Equity multiple
- 0.74×
- Total profit
- $-17,540
- Equity at exit
- $20,751
Cash invested: $67,200 (down + closing). Projections, not guarantees.
Landlord ↔ Tenant lean methodology
- Overall (STATE)
- 90 Strongly Landlord-Friendly
- State Indiana
- 90 Strongly Landlord-Friendly · R+11
- County
- — inherits STATE
- City
- — inherits STATE
ZIP-level market 46112
- Rents YoY
- 6.3%
- Active inventory
- 340
- Price-to-rent
- 10.2×
Monthly cashflow live
- Estimated rent
- $1,962 medium interval (Pro) →
- Mortgage (P&I)
- −$1,259
- Tax from tax record
- −$316 /mo · $3,788/yr
- Insurance
- −$100
- HOA
- −$17
- Vacancy / Maint / Mgmt
- −$412
- Net cashflow
- $-141
Break-even live
Sensitivity live
| Price | -10% $-6 | -5% $-74 | +0% $-141 | +5% $-209 | +10% $-277 |
|---|---|---|---|---|---|
| Rent | -10% $-296 | -5% $-219 | +0% $-141 | +5% $-64 | +10% $14 |
| Rate | -1.0pp $-21 | -0.5pp $-80 | base $-141 | +0.5pp $-204 | +1.0pp $-267 |
UW: 25.0% down · 7.5% · 30yr · 1.5% tax · 5.0% vac · 8.0% maint · 8.0% mgmt
Financing live
Cash to close
- Down payment
- $60,000
- Closing costs
- $7,200
- Reserves months
- —
- Total cash needed
- —
Loan-product check · same deal, 3 products live
Conventional
25% down · 7.5% · 30yr
- Down + closing
- —
- Monthly P&I
- —
- Monthly cashflow
- —
- DSCR
- —
- Eligible?
- —
Personal DTI + credit; lowest rate.
DSCR
20% down · 8.5% · 30yr
- Down + closing
- —
- Monthly P&I
- —
- Monthly cashflow
- —
- DSCR
- —
- Eligible?
- —
No personal income docs; deal must DSCR.
Hard money
10% down · 12.0% · 12mo
- Down + closing
- —
- Monthly P&I
- —
- Monthly cashflow
- —
- DSCR
- —
- Eligible?
- —
Short-term bridge; refi at stabilization.
Rent comps 4 comps
| Address | Beds | Baths | Sqft | Rent | $/sqft | DOM | Units | Dist |
|---|---|---|---|---|---|---|---|---|
| 28 Parkwood Dr Brownsburg, IN | 3.0 | 2.0 | 1422 | $1,760 | $1.24 | 19d | 1 | 1.09mi |
| 4155 N County Road 575 E Brownsburg, IN | 2.0 | 1.0 | 783 | $1,100 | $1.40 | 3d | 1 | 1.32mi |
| 2860 Hayward Ave Brownsburg, IN | 2.0 | 2.0 | 1457 | $2,212 | $1.52 | 0d | 7 | 1.40mi |
| 102 Murphy Ln Brownsburg, IN | 3.0 | 1.5 | 1248 | $1,775 | $1.42 | 9d | 1 | 1.44mi |
HOA detail
- Monthly dues
- $17 · $204/yr
Listing history 18 events
-
2026-05-14status Pending
-
2026-05-13$240,000 Active
-
2018-08-16soldstatus $165,000 Sold 521-char remark
Show marketing remark (521 chars)
Open concept, split bedroom floor plan ranch in desirable Brownsburg neighborhood. Great room with fireplace and cathedral ceiling. Kitchen features stainless steel appliances and white cabinets. Owner suite with private bath. Fabulously spacious, privacy fenced back yard great for kids, pets, leisure activity, a garden and entertaining features big deck and mini-barn. Recent updates since 2016 include shingles, interior paint, some flooring and fixtures. Washer and dryer also stay. One year home warranty included.
-
2018-07-04status Pending 521-char remark
Show marketing remark (521 chars)
Open concept, split bedroom floor plan ranch in desirable Brownsburg neighborhood. Great room with fireplace and cathedral ceiling. Kitchen features stainless steel appliances and white cabinets. Owner suite with private bath. Fabulously spacious, privacy fenced back yard great for kids, pets, leisure activity, a garden and entertaining features big deck and mini-barn. Recent updates since 2016 include shingles, interior paint, some flooring and fixtures. Washer and dryer also stay. One year home warranty included.
-
2018-07-03$165,000 Active 521-char remark
Show marketing remark (521 chars)
Open concept, split bedroom floor plan ranch in desirable Brownsburg neighborhood. Great room with fireplace and cathedral ceiling. Kitchen features stainless steel appliances and white cabinets. Owner suite with private bath. Fabulously spacious, privacy fenced back yard great for kids, pets, leisure activity, a garden and entertaining features big deck and mini-barn. Recent updates since 2016 include shingles, interior paint, some flooring and fixtures. Washer and dryer also stay. One year home warranty included.
-
2016-05-09soldstatus $129,000 Sold 269-char remark
Show marketing remark (269 chars)
Beautiful 3 BR 2 BA ranch with split floor plan. Cathedral ceiling in GR which is open to the eat in kitchen. Newer laminate flooring throughout much of the home. Stainless steel appliances stay. Fenced in private back area with wood deck. 5 star Brownsburg schools.
-
2016-03-29status Pending 269-char remark
Show marketing remark (269 chars)
Beautiful 3 BR 2 BA ranch with split floor plan. Cathedral ceiling in GR which is open to the eat in kitchen. Newer laminate flooring throughout much of the home. Stainless steel appliances stay. Fenced in private back area with wood deck. 5 star Brownsburg schools.
-
2016-03-28historical Active with Contingency 269-char remark
Show marketing remark (269 chars)
Beautiful 3 BR 2 BA ranch with split floor plan. Cathedral ceiling in GR which is open to the eat in kitchen. Newer laminate flooring throughout much of the home. Stainless steel appliances stay. Fenced in private back area with wood deck. 5 star Brownsburg schools.
-
2016-03-25$124,900 Active 269-char remark
Show marketing remark (269 chars)
Beautiful 3 BR 2 BA ranch with split floor plan. Cathedral ceiling in GR which is open to the eat in kitchen. Newer laminate flooring throughout much of the home. Stainless steel appliances stay. Fenced in private back area with wood deck. 5 star Brownsburg schools.
-
2014-06-07historical
-
2014-06-06soldstatus $118,800
-
2014-04-21$120,500
-
2007-09-18historical
-
2007-07-16$122,900
-
2006-06-16soldstatus $113,750
-
2006-05-01$114,750
-
2000-06-30soldstatus $102,000
-
2000-04-04$103,500
ⓘ Source: listings_history table (triggers on properties + properties_extension) + one-shot
backfill from property_details.listing_events for pre-trigger history.
Tax reassessment forecast IN · Partial reset (capped growth)
- Current annual tax
- $3,788 · $316/mo
- Projected year-2 tax
- $3,788 · $316/mo
- Expected delta
- $0/yr ($0/mo · 0.0%)
ⓘ Screening estimate from a state-policy table — verify with the county assessor before closing.
Climate risk First Street
- Flood 1/10 Low FEMA zone X (unshaded) · 0% chance over 30 yrs
- Wildfire 1/10 Low
- Heat 3/10 Moderate 7 d/yr ≥100°F today · 19 d/yr by 30 yrs out
- Wind 2/10 Low 0% chance of damaging wind over 30 yrs
- Air quality 2/10 Low 1 unhealthy d/yr today · 2 by 30 yrs out
Nearby sold comps map
Loading sold comps map…
Walkable amenities ~0.75 mi
Loading nearby amenities…
Taxation est. · year 1
- Rental income
- $23,541
- − Mortgage interest
- −$13,444
- − Property taxes
- −$3,788
- − Insurance
- −$1,200
- − Repairs & maintenance
- −$1,883
- − Management
- −$1,883
- − HOA
- −$204
- − Depreciation
- −$6,982
- Taxable loss
- −$5,843
- Est. tax savings @ 24.0%
- +$1,402
- After-tax cash flow
- $-295/yr
For passive investors: Depreciation is non-cash, so a rental often shows a tax loss while cash-flowing — sheltering income. Rental losses are passive: they offset passive income freely, and up to $25,000/yr can offset ordinary (W-2) income if you actively participate and your MAGI is under $100k (phasing out to $0 by $150k); unused losses carry forward. On sale, claimed depreciation is recaptured at up to 25%, and gains may owe capital-gains tax (a 1031 exchange can defer both). Figures are a year-1 estimate at your 24.0% rate — not tax advice; consult a CPA.
Schools (NCES district)
- District
- Brownsburg Community School Corporation
- NCES district ID
- 1801020
- Math proficiency
- 72% ▼ -5.00%
- Reading proficiency
- 72% ▼ -4.00%
- Median HH income
- $75,304
- Composite
- 63.45/100
- National rank
- #616
- State rank
- #2 of 301 in IN
Livability — Brownsburg
- Score
- 75/100
- State rank
- #61
- US rank
- #4105
Category grades
Schools grade is shown separately in the Schools card above.
Census & demographics
- Census place
- Brownsburg, IN
- County
- Hendricks County · 143,373 people
- City population
- 44,220
- Metro
- Indianapolis-Carmel-Anderson, IN
- Population (ZIP)
- 44,220
- Household income
- $112,565
- Rent vs Own
- Severe rent burden
- 614.0
Population outlook (Hendricks County) Hauer SSP2
- Today (2025)
- 187,418 people
- By 2030
- 201,494 · +7.5%
- By 2040
- 228,487 · +21.9%
- By 2050
- 253,068 · +35.0%
- By 2075
- 308,920 · +64.8%
- By 2100
- 336,510 · +79.6%
Race, ethnicity, and origin ACS 2023
- Neighborhood character
- Predominantly White (83%)
- Race & ethnicity
- White 83% Black 10% Two or more races 4% Hispanic / Latino 4%
- Common ancestry
- Slovak 3% Iranian 2% Romanian 2%
- Foreign-born
- 6% · Canada, China
- Languages at home
- 93% English-only · Spanish 2% French/Haitian/Cajun 1%
Political lean MEDSL · Hendricks
- 2024 margin
- Strong R (+21.5) · D 38.4% · R 59.9% · Other 1.7%
- 2008→2024 swing
- +1.9pp toward D · 2008: -23.4pp · 2024: -21.5pp
- All cycles
- 2024: R+21.5 2020: R+23.9 2016: R+34.2 2012: R+34.9 2008: R+23.4
Not yet ingested
- Civics
- —
Market trends
- HPI YoY
- ▼ -135.99%
- Current HPI
- 217.3787
- Rent YoY
- ▲ 6.31%
- Metro
- Indianapolis-Carmel-Anderson, IN
- State GDP YoY
- ▲ 2.90%
- F500 in state
- 18
Industry mix (Fortune 500 HQ in IN)
| Industry | F500 HQs | Revenue |
|---|---|---|
| Industrial Machinery | 2 | $37B |
|
||
| Healthcare | 1 | $177B |
|
||
| Pharmaceuticals | 1 | $45B |
|
||
| Metals / Steel | 1 | $18B |
|
||
| Agriculture | 1 | $17B |
|
||
| Packaging | 1 | $12B |
|
||
Price history
+131.9% since first listed18 events — show timeline
- 2026-05-14 Pending — MIBOR as Distributed by MLS Grid
- 2026-05-13 Listed $240,000 MIBOR as Distributed by MLS Grid
- 2018-08-16 Sold (MLS) $165,000 MIBOR as Distributed by MLS Grid
- 2018-07-04 Pending — MIBOR as Distributed by MLS Grid
- 2018-07-03 Listed $165,000 MIBOR as Distributed by MLS Grid
- 2016-05-09 Sold (MLS) $129,000 MIBOR as Distributed by MLS Grid
- 2016-03-29 Pending — MIBOR as Distributed by MLS Grid
- 2016-03-28 Contingent — MIBOR as Distributed by MLS Grid
- 2016-03-25 Listed $124,900 MIBOR as Distributed by MLS Grid
- 2014-06-07 Listing Removed — MIBOR as Distributed by MLS Grid
- 2014-06-06 Sold (MLS) $118,800 MIBOR as Distributed by MLS Grid
- 2014-04-21 Listed $120,500 MIBOR as Distributed by MLS Grid
- 2007-09-18 Listing Removed — MIBOR as Distributed by MLS Grid
- 2007-07-16 Listed $122,900 MIBOR as Distributed by MLS Grid
- 2006-06-16 Sold (MLS) $113,750 MIBOR as Distributed by MLS Grid
- 2006-05-01 Listed $114,750 MIBOR as Distributed by MLS Grid
- 2000-06-30 Sold (MLS) $102,000 MIBOR as Distributed by MLS Grid
- 2000-04-04 Listed $103,500 MIBOR as Distributed by MLS Grid
Property tax history
+11.6%/yrLatest (2025): $3,788 · +7.5% YoY. Source: county tax records.
Cash-flow waterfall
monthlySold comps — $/sqft
last 12 mo · ≤1 miLoading sold comps…