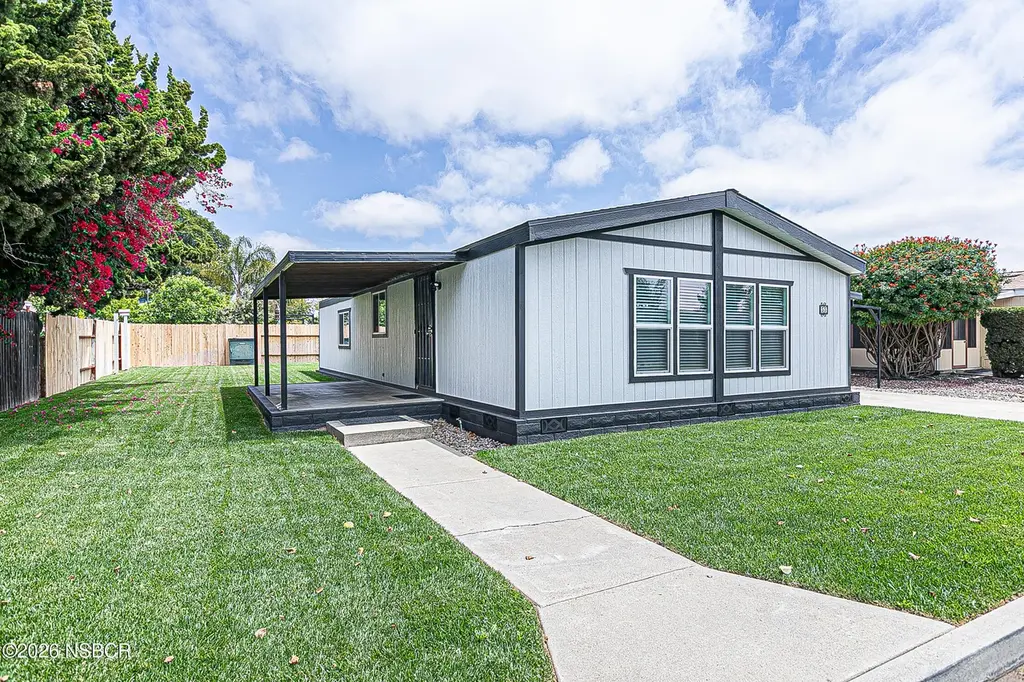
519 W Taylor St #55 · Santa Maria, CA
Flood risk 5/10 · Moderate
- FEMA flood zone
- X (unshaded)
- Chance of flooding over 30 yrs
- 0.24%
- Est. flood insurance / yr
- $507 – $1,088
Fire risk 4/10 · Minor
- Est. fire insurance / yr
- $659 – $1,223
Heat risk 4/10 · Minor
- Hot days now (above 84°F)
- 7 days/yr
- Hot days in 30 yrs
- 17 days/yr
Wind risk 1/10 · Minimal
- Chance of severe wind over 30 yrs
- —
Air-quality risk 6/10 · Moderate
- Unhealthy air days now
- 11 days/yr
- Unhealthy air days in 30 yrs
- 12 days/yr
Risk factors via First Street. Map © Google.
Why this score? — see what drove the D grade
The composite is a weighted blend of 9 inputs, each scored 0–100. Each bar is that input's sub-score; the figure is the points it added to the 100-point composite (weight × sub-score).
- Cash flow +14.9/30.0
- ARV discount +7.5/15.0
- DSCR +4.6/10.0
- 1% rule +4.1/10.0
- Livability +3.6/5.0
- Rent growth +3.1/5.0
- Schools +2.9/10.0
- Condition / age +2.5/5.0
- Appreciation +0.0/10.0
$284,000
🖨 Deal sheet (PDF) 📄 Offer letter ✓ Due diligence
Listing remarks MLS
Well-priced 2 bedroom, 2 bath home in Casa Grande. Easy maintenance yard that is fenced and ready for your pets. Separate tool shed. Washer, dryer & refrigerator incl. w/o warranty. Satellite dish and controls also included. Make an appointment to see this today!
Key facts
- New siding
- Granite counter-tops
- 1,307 sq ft lot
Tags
Property features AI
Finance
- HOA & community: Age-restricted community; Pets allowed with restrictions
Exterior
- Parking: Carport; Guest parking available
- Utilities: Public water; Public sewer
- Home design: Manufactured home; 48 ft by 24 ft
- Construction: Wood siding; Composition roof; Pillar/post/pier foundation; Built by Kaufman / Broad
- Exterior features: Tool shed; Greenbelt; Level lot
Interior
- Kitchen: Gas oven/range; Garbage disposal; Microwave; Refrigerator
- Flooring: Vinyl
- Bathrooms: 2 full bathrooms
- Heating & cooling: Forced air heating (natural gas); Ceiling fan cooling
- Interior features: Breakfast bar; Pantry
- Laundry & utility: Interior laundry with gas hookup
Neighborhood map
What this means for you Summary
Snapshot
- This is a 2-bed/2.0-bath manufactured listed at $284k.
Deal economics
- At list price, monthly cash flow is $82 ($985/yr) — positive.
- The deal already cash-flows at list — no discount required.
- To meet the 1% rule (rent ≥ 1% of price), the offer needs to be $259k (8.9% below list).
- Recommended offer: $259k (8.9% below list) — sets the bar for 1% rule.
- Cap rate 6.6% vs local median 3.5% in Santa Maria — top-decile yield for the area; either an underpriced asset or a hidden risk that comps aren't pricing in. Stress-test before assuming the spread holds.
Location & tenants
- Location reads 71/100 on livability (#202 in CA) — a middle-class / working-renter tenant base. Strengths: amenities A+, commute A+, health & safety A; Watch: crime F, cost of living F.
- Santa Maria-Bonita (urban): math 26% / reading 34% proficiency, ranked #1,023 of 1,400 in CA (top 73%) — families likely to look elsewhere, expect single-tenant / working-renter base with shorter leases; 72% free/reduced lunch — lower-income household profile, screen leases tightly.
- Zoned schools: Taylor (Ida Redmond) Elementary (833 students, 82% FRL); Kunst (Tommie) Junior High (1,030 students, 61% FRL); Pioneer Valley High (3,220 students, 74% FRL) — zoned schools at 72% FRL track the district average.
- Market conditions: Rents rising (+2.3%/yr); 56 active listings in the ZIP; 3 comparable units currently listed for rent nearby; rentals at typical pace (median 16d on market — plan ~3-4 weeks tenant-placement turnaround); solid renter incomes; 719 units permitted in Santa Barbara County in 2024 (217 in 5+ unit buildings).
- This rent runs 41% of the median local income ($75k/yr) — at the standard rent-burdened threshold; future hikes will face affordability resistance.
Forward outlook
- Local home prices are declining (-3.0%/yr); year-one equity from $2k of loan paydown is wiped out by about $9k of value loss. Plan a longer hold.
- Santa Barbara County population projected at +20% by 2050 — long-run rental-demand tailwind backs the buy-and-hold thesis.
Negotiation context
- It's been on market 36 days — a 3% lower offer ($275k) is reasonable based on typical stale-listing flexibility.
- 2 sale attempts since 17y ago; this cycle's ask has dropped $15k (5%) from the opening price — seller is motivated, your offer sets the floor, not the list.
- Current owner paid $30k; list at $284k implies a 847% gain — meaningful room to come down on a strong offer.
Risks & watch-outs
- Climate carrying-cost: moderate flood risk — expect insurance premiums to compound above CPI over the hold.
Questions for the listing agent
- It's been on market 36 days. Have you received any prior offers? Is the seller open to a 9% concession, seller financing, or rate buy-down credit?
- Is there a deadline driving the sale (1031 exchange, divorce, estate, relocation)? That informs how much negotiation room exists.
- Schools are F-rated, which usually means shorter tenancies and higher turnover. Who's the typical renter profile here, and what's been the actual vacancy rate?
- Crime grade is F in this area — have there been break-ins, vandalism, or insurance claims at this property in the last 3 years? What carrier currently insures it and at what premium?
- The area grade is low — what's the realistic commute time and amenity access for the typical tenant pool here? Any planned neighborhood developments (good or bad) we should know about?
- What's the average days-on-market for RENTAL listings here right now (not sales)? A rising rental-DOM trend means longer vacancies and softer asking-rent achievability than the comps imply.
- What's the recent tenant-quality profile in this submarket — average credit score on applications, eviction rate, late-payment / NSF rate, and stable-employment percentage? A property-management company in the area should have these aggregated.
- How much new for-sale + rental construction is in the pipeline within 1–3 miles? Heavy new supply typically softens prices + rents 12–24 months out; constrained supply supports both.
Investment metrics
- 1% rule
- 0.91% ✗
- Cap rate
- 6.64%
- Cash-on-cash
- 1.24%
- DSCR
- 1.06
- GRM
- 9.1
CMA / ARV
- ARV (on-the-fly)
- $142,848
- Comps found
- 12
Show comp detail 12 sales within ~0.75 mi
| Address | Dist | Beds/Ba | Sqft | Sold | Price | $/sf | Match |
|---|---|---|---|---|---|---|---|
| 519 W Taylor St #206 | 0.17mi | 2/2.0 | 1,152 (0%) | 2mo | $170,000 | $148 | 91 |
| 519 W Taylor St #35 | 0.07mi | 2/2.0 | 1,152 (0%) | 10mo | $125,000 | $109 | 88 |
| 519 W Taylor St #90 | 0.10mi | 2/2.0 | 1,152 (0%) | 12mo | $110,000 | $95 | 85 |
| 519 W Taylor St #132 | 0.18mi | 2/2.0 | 1,152 (0%) | 8mo | $89,000 | $77 | 85 |
| 519 W Taylor St #161 | 0.14mi | 2/2.0 | 1,152 (0%) | 11mo | $126,000 | $109 | 84 |
| 519 W Taylor St #376 | 0.19mi | 2/2.0 | 1,152 (0%) | 12mo | $130,000 | $113 | 81 |
| 519 W Taylor St #335 | 0.27mi | 2/2.0 | 1,152 (0%) | 12mo | $164,900 | $143 | 78 |
| 519 W Taylor St Unit 298B | 0.40mi | 2/2.0 | 1,152 (0%) | 10mo | $134,900 | $117 | 74 |
| 519 W Taylor St Unit 298C | 0.40mi | 2/2.0 | 1,152 (0%) | 11mo | $167,000 | $145 | 72 |
| 519 W Taylor St #180 | 0.24mi | 2/2.0 | 1,248 (+8%) | 14mo | $179,000 | $143 | 63 |
| 519 W Taylor St #265 | 0.32mi | 2/2.0 | 1,248 (+8%) | 16mo | $155,000 | $124 | 58 |
| 2120 Via Visalia | 0.43mi | 2/2.0 | 1,248 (+8%) | 10mo | $190,000 | $152 | 58 |
Match score weights: distance 35% · size 25% · config 20% · recency 20%. Top-matched comps best support the ARV.
Projected returns pro-forma
-3.0% appreciation · 2.31% rent growth · sell at horizon
- IRR
- -15.1%
- Equity multiple
- 0.47×
- Total profit
- $-42,539
- Equity at exit
- $42,345
- IRR
- -7.7%
- Equity multiple
- 0.53×
- Total profit
- $-37,376
- Equity at exit
- $24,555
Cash invested: $79,520 (down + closing). Projections, not guarantees.
Landlord ↔ Tenant lean methodology
- Overall (STATE)
- 18 Strongly Tenant-Friendly
- State California
- 18 Strongly Tenant-Friendly · D+13
- County
- — inherits STATE
- City
- — inherits STATE
ZIP-level market 93458
- Rents YoY
- 2.3%
- Active inventory
- 56
- Price-to-rent
- 9.1×
Monthly cashflow live
- Estimated rent
- $2,588 medium interval (Pro) →
- Mortgage (P&I)
- −$1,489
- Tax est. 1.5%
- −$355 /mo · $4,260/yr
- Insurance
- −$118
- HOA
- −$0
- Vacancy / Maint / Mgmt
- −$544
- Net cashflow
- $82
Break-even live
Sensitivity live
| Price | -10% $278 | -5% $180 | +0% $82 | +5% $-16 | +10% $-114 |
|---|---|---|---|---|---|
| Rent | -10% $-122 | -5% $-20 | +0% $82 | +5% $184 | +10% $287 |
| Rate | -1.0pp $225 | -0.5pp $154 | base $82 | +0.5pp $8 | +1.0pp $-66 |
UW: 25.0% down · 7.5% · 30yr · 1.5% tax · 5.0% vac · 8.0% maint · 8.0% mgmt
Financing live
Cash to close
- Down payment
- $71,000
- Closing costs
- $8,520
- Reserves months
- —
- Total cash needed
- —
Loan-product check · same deal, 3 products live
Conventional
25% down · 7.5% · 30yr
- Down + closing
- —
- Monthly P&I
- —
- Monthly cashflow
- —
- DSCR
- —
- Eligible?
- —
Personal DTI + credit; lowest rate.
DSCR
20% down · 8.5% · 30yr
- Down + closing
- —
- Monthly P&I
- —
- Monthly cashflow
- —
- DSCR
- —
- Eligible?
- —
No personal income docs; deal must DSCR.
Hard money
10% down · 12.0% · 12mo
- Down + closing
- —
- Monthly P&I
- —
- Monthly cashflow
- —
- DSCR
- —
- Eligible?
- —
Short-term bridge; refi at stabilization.
Rent comps 3 comps
| Address | Beds | Baths | Sqft | Rent | $/sqft | DOM | Units | Dist |
|---|---|---|---|---|---|---|---|---|
| 116 E Orchard St Santa Maria, CA | 2.0 | 1.0 | 1004 | $2,850 | $2.84 | 23d | 1 | 0.79mi |
| Lynne Dr Santa Maria, CA | 3.0 | 2.5 | 1264 | $3,000 | $2.37 | 15d | 1 | 0.90mi |
| 715 W Alvin Ave Unit B Santa Maria, CA | 2.0 | 1.5 | 1000 | $2,495 | $2.50 | 15d | 1 | 1.06mi |
Listing history 20 events
-
2026-06-21days on market $284,000 Active 36 DOM
-
2026-06-18days on market $284,000 Active 33 DOM
-
2026-06-17days on market $284,000 Active 32 DOM
-
2026-06-16days on market $284,000 Active 31 DOM
-
2026-06-15days on market $284,000 Active 30 DOM
-
2026-06-14days on market $284,000 Active 28 DOM
-
2026-06-13days on market $284,000 Active 27 DOM
-
2026-06-10days on market $284,000 Active 25 DOM
-
2026-06-09days on market $284,000 Active 24 DOM
-
2026-06-08days on market $284,000 Active 23 DOM
-
2026-06-07days on market $284,000 Active 22 DOM
-
2026-06-05days on market $284,000 Active 19 DOM
-
2026-06-03days on market $284,000 Active 18 DOM
-
2026-06-02pricedays on market $284,000 Active 17 DOM
-
2026-06-01days on market $299,000 Active 16 DOM
-
2026-05-31days on market $299,000 Active 15 DOM
-
2026-05-30days on market $299,000 Active 14 DOM
-
2026-05-15$299,000 Active
-
2009-04-01soldstatus $30,000 267-char remark
Show marketing remark (267 chars)
Well-priced 2 bedroom, 2 bath home in Casa Grande. Easy maintenance yard that is fenced and ready for your pets. Separate tool shed. Washer, dryer & refrigerator incl. w/o warranty. Satellite dish and controls also included. Make an appointment to see this today!
-
2009-03-01$36,000 267-char remark
Show marketing remark (267 chars)
Well-priced 2 bedroom, 2 bath home in Casa Grande. Easy maintenance yard that is fenced and ready for your pets. Separate tool shed. Washer, dryer & refrigerator incl. w/o warranty. Satellite dish and controls also included. Make an appointment to see this today!
ⓘ Source: listings_history table (triggers on properties + properties_extension) + one-shot
backfill from property_details.listing_events for pre-trigger history.
Climate risk First Street
- Flood 5/10 Major FEMA zone X (unshaded) · 24% chance over 30 yrs
- Wildfire 4/10 Moderate
- Heat 4/10 Moderate 7 d/yr ≥84°F today · 17 d/yr by 30 yrs out
- Wind 1/10 Low
- Air quality 6/10 Major 11 unhealthy d/yr today · 12 by 30 yrs out
Nearby sold comps map
Loading sold comps map…
Walkable amenities ~0.75 mi
Loading nearby amenities…
Taxation est. · year 1
- Rental income
- $31,059
- − Mortgage interest
- −$15,908
- − Property taxes
- −$4,260
- − Insurance
- −$1,420
- − Repairs & maintenance
- −$2,485
- − Management
- −$2,485
- − Depreciation
- −$8,262
- Taxable loss
- −$3,761
- Est. tax savings @ 24.0%
- +$903
- After-tax cash flow
- $1,887/yr
For passive investors: Depreciation is non-cash, so a rental often shows a tax loss while cash-flowing — sheltering income. Rental losses are passive: they offset passive income freely, and up to $25,000/yr can offset ordinary (W-2) income if you actively participate and your MAGI is under $100k (phasing out to $0 by $150k); unused losses carry forward. On sale, claimed depreciation is recaptured at up to 25%, and gains may owe capital-gains tax (a 1031 exchange can defer both). Figures are a year-1 estimate at your 24.0% rate — not tax advice; consult a CPA.
Schools (NCES district)
- District
- Santa Maria-Bonita
- NCES district ID
- 0605580
- Math proficiency
- 26% ▲ 3.00%
- Reading proficiency
- 34% ▲ 3.00%
- Median HH income
- $50,959
- Composite
- 29.11/100
- National rank
- #11891
- State rank
- #1023 of 1400 in CA
Livability — Santa Maria
- Score
- 71/100
- State rank
- #202
- US rank
- #6519
Category grades
Schools grade is shown separately in the Schools card above.
Census & demographics
- Census place
- Santa Maria, CA
- County
- Santa Barbara County · 410,380 people
- City population
- 145,655
- Metro
- Santa Maria-Santa Barbara, CA
- Population (ZIP)
- 59,148
- Household income
- $75,257
- Rent vs Own
- Severe rent burden
- 2583.0
Population outlook (Santa Barbara County) Hauer SSP2
- Today (2025)
- 484,679 people
- By 2030
- 505,323 · +4.3%
- By 2040
- 545,783 · +12.6%
- By 2050
- 584,263 · +20.5%
- By 2075
- 682,586 · +40.8%
- By 2100
- 723,188 · +49.2%
Race, ethnicity, and origin ACS 2023
- Neighborhood character
- Predominantly Hispanic (87%)
- Race & ethnicity
- Hispanic / Latino 87% Two or more races 41% White 8% Asian 4% Native American 4%
- Hispanic origin (detail)
- Mexican 83%
- Common ancestry
- Lithuanian 1%
- Foreign-born
- 40% · Canada, Jamaica
- Languages at home
- 21% English-only · Spanish 72% Tagalog/Filipino 2% Other Asian/Pacific 1%
Political lean MEDSL · Santa Barbara
- 2024 margin
- Strong D (+26.7) · D 61.8% · R 35.1% · Other 3.1%
- 2008→2024 swing
- +3.8pp toward D · 2008: 22.9pp · 2024: 26.7pp
- All cycles
- 2024: D+26.7 2020: D+32.1 2016: D+28.2 2012: D+17.1 2008: D+22.9
Not yet ingested
- Civics
- —
Market trends
- HPI YoY
- ▼ -422.91%
- Current HPI
- 347.9281
- Rent YoY
- ▲ 2.31%
- Metro
- Santa Maria-Santa Barbara, CA
- State GDP YoY
- ▲ 3.21%
- F500 in state
- 116
Industry mix (Fortune 500 HQ in CA)
| Industry | F500 HQs | Revenue |
|---|---|---|
| Technology | 27 | $1,492B |
|
||
| Financial Services | 3 | $174B |
|
||
| Retail | 3 | $44B |
|
||
| Insurance | 3 | $26B |
|
||
| Media / Entertainment | 2 | $115B |
|
||
| Pharmaceuticals / Biotech | 2 | $62B |
|
||
Price history
+730.6% since first listed3 events — show timeline
- 2026-05-15 Listed $299,000 NSBCRMLS
- 2009-04-01 Sold (MLS) $30,000 NSBCRMLS
- 2009-03-01 Listed $36,000 NSBCRMLS
Property tax history
+1.2%/yrLatest (2025): $266 · +5.1% YoY. Source: county tax records.
Cash-flow waterfall
monthlySold comps — $/sqft
last 12 mo · ≤1 miLoading sold comps…