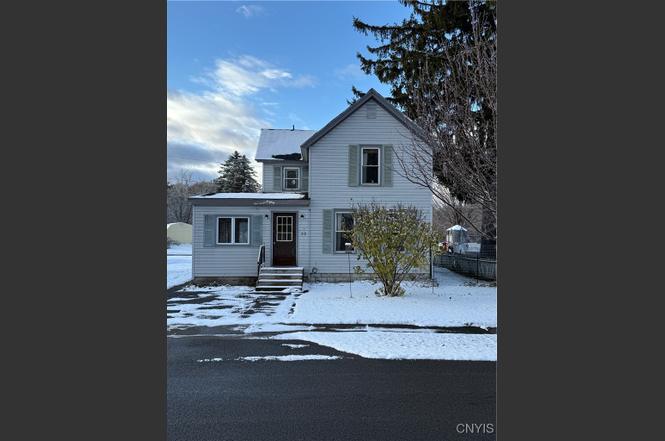
33 Anderson Ave · Deferiet, NY
Flood risk 10/10 · Severe
- FEMA flood zone
- —
- Chance of flooding over 30 yrs
- 0.99%
- Est. flood insurance / yr
- —
Fire risk 1/10 · Minimal
- Est. fire insurance / yr
- $691 – $1,283
Heat risk 1/10 · Minimal
- Hot days now (above 91°F)
- 7 days/yr
- Hot days in 30 yrs
- 15 days/yr
Wind risk 1/10 · Minimal
- Chance of severe wind over 30 yrs
- —
Air-quality risk 2/10 · Minimal
- Unhealthy air days now
- 0 days/yr
- Unhealthy air days in 30 yrs
- 1 days/yr
Risk factors via First Street. Map © Google.
Why this score? — see what drove the B grade
The composite is a weighted blend of 9 inputs, each scored 0–100. Each bar is that input's sub-score; the figure is the points it added to the 100-point composite (weight × sub-score).
- Cash flow +24.5/30.0
- ARV discount +15.0/15.0
- DSCR +7.9/10.0
- Appreciation +6.6/10.0
- 1% rule +6.3/10.0
- Schools +3.3/10.0
- Livability +3.0/5.0
- Rent growth +2.5/5.0
- Condition / age +2.5/5.0
$120,000
🖨 Deal sheet (PDF) 📄 Offer letter ✓ Due diligence
Listing remarks MLS
Beautiful home located in the heart of Deferiet. Great neighborhood only a few miles outside of Drum. This home has a nice open floor plan that allows you to be creative with the space. 1ST FLOOR-large living room, open kitchen, dining room, den and a full bath. 2ND FLOOR- 3 nice sized bedrooms. There is also a one car garage with access from the back alley. Perfect place to raise a family, and located in the Carthage School District. Motivated Seller. Will entertain all reasonable offers!!
Key facts
- 5,700 sq ft lot
- Garage
- Built 1904
Neighborhood map
What this means for you Summary
Snapshot
- This is a 3-bed/1.0-bath single-family listed at $120k.
Deal economics
- At list price, monthly cash flow is $246 ($3k/yr) — positive.
- The deal already cash-flows at list — no discount required.
- Meets the 1% rule at list price ($1k rent vs $120k).
- Recommended offer: $113k (6.0% below list) — sets the bar for market timing.
Location & tenants
- Location reads 60/100 on livability (#984 in NY) — a middle-class / working-renter tenant base. Strengths: housing A+, cost of living A-; Watch: health & safety D, crime F, amenities F.
- Carthage Central School District (rural): math 30% / reading 46% proficiency, ranked #539 of 590 in NY (top 91%) — families likely to look elsewhere, expect single-tenant / working-renter base with shorter leases.
- Zoned schools: West Carthage Elementary School (math 22% / reading 42%, grade F, #1,646 of 2,108 statewide, top 80%, 348 students, 51% FRL); Carthage Middle School (math 19% / reading 41%, grade F, #539 of 729 statewide, top 74%, 899 students, 51% FRL); Carthage Senior High School (math 92% / reading 72%, grade A, #452 of 1,100 statewide, top 44%, 815 students, 52% FRL) — zoned schools average 51% FRL vs 31% district-wide (20 pts higher); higher-poverty schools than district average — tighter screening recommended.
- Market conditions: 17 active listings in the ZIP; 196 units permitted in Jefferson County in 2024 (0 in 5+ unit buildings).
Forward outlook
- In year one you build about $5k of equity ($830 loan paydown + $4k appreciation (3.1% local appreciation)).
- Jefferson County population projected at -12% by 2050 — secular population decline; favor cash flow + early exit over multi-decade hold.
- At projected returns (3.1% appreciation + 3.0% rent growth), your $34k cash investment doubles in ~5 years — after that, you're playing with house money.
- By year 8, paydown + projected appreciation supports a ~$34k cash-out refi (75% LTV) — recoverable capital for the next deal without selling this one.
Negotiation context
- It's been on market 71 days — a 6% lower offer ($113k) is reasonable based on typical stale-listing flexibility.
- 2 sale attempts since 12y ago; this cycle's ask has dropped $8k (6%) from the opening price — seller is motivated, your offer sets the floor, not the list.
- Current owner paid $80k; list at $120k implies a 50% gain — meaningful room to come down on a strong offer.
Risks & watch-outs
- Watch-outs: built in 1904 — expect roof / HVAC / electrical / plumbing capex.
- Climate carrying-cost: severe flood risk — expect insurance premiums to compound above CPI over the hold.
Questions for the listing agent
- It's been on market 71 days. Have you received any prior offers? Is the seller open to a 6% concession, seller financing, or rate buy-down credit?
- Built in 1904 — when were the roof, HVAC, electrical panel, plumbing, and water heater last replaced?
- Why hasn't it sold? Are there any deal-killer items the seller is aware of (foundation, flood, title, zoning, code violations)?
- Is there a deadline driving the sale (1031 exchange, divorce, estate, relocation)? That informs how much negotiation room exists.
- Schools are D-rated, which usually means shorter tenancies and higher turnover. Who's the typical renter profile here, and what's been the actual vacancy rate?
- Crime grade is F in this area — have there been break-ins, vandalism, or insurance claims at this property in the last 3 years? What carrier currently insures it and at what premium?
- What's the average days-on-market for RENTAL listings here right now (not sales)? A rising rental-DOM trend means longer vacancies and softer asking-rent achievability than the comps imply.
- What's the recent tenant-quality profile in this submarket — average credit score on applications, eviction rate, late-payment / NSF rate, and stable-employment percentage? A property-management company in the area should have these aggregated.
- How much new for-sale + rental construction is in the pipeline within 1–3 miles? Heavy new supply typically softens prices + rents 12–24 months out; constrained supply supports both.
Investment metrics
- 1% rule
- 1.13% ✓
- Cap rate
- 8.75%
- Cash-on-cash
- 8.77%
- DSCR
- 1.39
- GRM
- 7.3
CMA / ARV
- ARV (on-the-fly)
- $225,700
- Comps found
- 5
Show comp detail 5 sales within ~0.75 mi
| Address | Dist | Beds/Ba | Sqft | Sold | Price | $/sf | Match |
|---|---|---|---|---|---|---|---|
| 19 Anderson Ave | 0.09mi | 3/2.0 | 1,583 (+4%) | 1mo | $235,000 | $148 | 84 |
| 53 Anderson Ave | 0.15mi | 3/2.5 | 1,654 (+8%) | 13mo | $206,400 | $125 | 62 |
| 61 Anderson Ave | 0.19mi | 3/2.5 | 1,464 (-4%) | 21mo | $239,000 | $163 | 60 |
| 34015 State Route 3 | 0.50mi | 3/1.0 | 1,752 (+15%) | 16mo | $219,000 | $125 | 38 |
| 34196 Jackson Ii Rd | 0.67mi | 3/2.0 | 1,740 (+14%) | 20mo | $439,000 | $252 | 24 |
Match score weights: distance 35% · size 25% · config 20% · recency 20%. Top-matched comps best support the ARV.
Projected returns pro-forma
3.13% appreciation · 3.0% rent growth · sell at horizon
- IRR
- 16.0%
- Equity multiple
- 1.92×
- Total profit
- $30,963
- Equity at exit
- $54,859
- IRR
- 17.5%
- Equity multiple
- 3.60×
- Total profit
- $87,309
- Equity at exit
- $85,252
Cash invested: $33,600 (down + closing). Projections, not guarantees.
Landlord ↔ Tenant lean methodology
- Overall (STATE)
- 15 Strongly Tenant-Friendly
- State New York
- 15 Strongly Tenant-Friendly · D+10
- County
- — inherits STATE
- City
- — inherits STATE
ZIP-level market 13626
- Home prices YoY
- 1.0%
- Active inventory
- 17
- Price-to-rent
- 7.3×
Monthly cashflow live
- Estimated rent
- $1,361 medium interval (Pro) →
- Mortgage (P&I)
- −$629
- Tax est. 1.5%
- −$150 /mo · $1,800/yr
- Insurance
- −$50
- HOA
- −$0
- Vacancy / Maint / Mgmt
- −$286
- Net cashflow
- $246
Break-even live
Sensitivity live
| Price | -10% $328 | -5% $287 | +0% $246 | +5% $204 | +10% $163 |
|---|---|---|---|---|---|
| Rent | -10% $138 | -5% $192 | +0% $246 | +5% $299 | +10% $353 |
| Rate | -1.0pp $306 | -0.5pp $276 | base $246 | +0.5pp $214 | +1.0pp $183 |
UW: 25.0% down · 7.5% · 30yr · 1.5% tax · 5.0% vac · 8.0% maint · 8.0% mgmt
Financing live
Cash to close
- Down payment
- $30,000
- Closing costs
- $3,600
- Reserves months
- —
- Total cash needed
- —
Loan-product check · same deal, 3 products live
Conventional
25% down · 7.5% · 30yr
- Down + closing
- —
- Monthly P&I
- —
- Monthly cashflow
- —
- DSCR
- —
- Eligible?
- —
Personal DTI + credit; lowest rate.
DSCR
20% down · 8.5% · 30yr
- Down + closing
- —
- Monthly P&I
- —
- Monthly cashflow
- —
- DSCR
- —
- Eligible?
- —
No personal income docs; deal must DSCR.
Hard money
10% down · 12.0% · 12mo
- Down + closing
- —
- Monthly P&I
- —
- Monthly cashflow
- —
- DSCR
- —
- Eligible?
- —
Short-term bridge; refi at stabilization.
Listing history 5 events
-
2026-01-22status Pending
-
2026-01-02price $120,000
-
2025-11-11$127,500 Active
-
2015-03-25soldstatus $80,000 495-char remark
Show marketing remark (495 chars)
Beautiful home located in the heart of Deferiet. Great neighborhood only a few miles outside of Drum. This home has a nice open floor plan that allows you to be creative with the space. 1ST FLOOR-large living room, open kitchen, dining room, den and a full bath. 2ND FLOOR- 3 nice sized bedrooms. There is also a one car garage with access from the back alley. Perfect place to raise a family, and located in the Carthage School District. Motivated Seller. Will entertain all reasonable offers!!
-
2014-05-14$88,900 495-char remark
Show marketing remark (495 chars)
Beautiful home located in the heart of Deferiet. Great neighborhood only a few miles outside of Drum. This home has a nice open floor plan that allows you to be creative with the space. 1ST FLOOR-large living room, open kitchen, dining room, den and a full bath. 2ND FLOOR- 3 nice sized bedrooms. There is also a one car garage with access from the back alley. Perfect place to raise a family, and located in the Carthage School District. Motivated Seller. Will entertain all reasonable offers!!
ⓘ Source: listings_history table (triggers on properties + properties_extension) + one-shot
backfill from property_details.listing_events for pre-trigger history.
Climate risk First Street
- Flood 10/10 Extreme 99% chance over 30 yrs
- Wildfire 1/10 Low
- Heat 1/10 Low 7 d/yr ≥91°F today · 15 d/yr by 30 yrs out
- Wind 1/10 Low
- Air quality 2/10 Low 0 unhealthy d/yr today · 1 by 30 yrs out
Nearby sold comps map
Loading sold comps map…
Walkable amenities ~0.75 mi
Loading nearby amenities…
Taxation est. · year 1
- Rental income
- $16,327
- − Mortgage interest
- −$6,722
- − Property taxes
- −$1,800
- − Insurance
- −$600
- − Repairs & maintenance
- −$1,306
- − Management
- −$1,306
- − Depreciation
- −$3,491
- Taxable income
- $1,102
- Est. tax owed @ 24.0%
- −$264
- After-tax cash flow
- $2,682/yr
For passive investors: Depreciation is non-cash, so a rental often shows a tax loss while cash-flowing — sheltering income. Rental losses are passive: they offset passive income freely, and up to $25,000/yr can offset ordinary (W-2) income if you actively participate and your MAGI is under $100k (phasing out to $0 by $150k); unused losses carry forward. On sale, claimed depreciation is recaptured at up to 25%, and gains may owe capital-gains tax (a 1031 exchange can defer both). Figures are a year-1 estimate at your 24.0% rate — not tax advice; consult a CPA.
Schools (NCES district)
- District
- Carthage Central School District
- NCES district ID
- 3606630
- Math proficiency
- 30% ▼ -18.00%
- Reading proficiency
- 46% ▲ 2.00%
- Median HH income
- $48,450
- Composite
- 32.63/100
- National rank
- #5668
- State rank
- #539 of 590 in NY
Livability — Deferiet
- Score
- 60/100
- State rank
- #984
- US rank
- #19218
Category grades
Schools grade is shown separately in the Schools card above.
Census & demographics
- Census place
- Deferiet, NY
- City population
- 185
- Population (ZIP)
- 2,322
Population outlook (Jefferson County) Hauer SSP2
- Today (2025)
- 111,748 people
- By 2030
- 109,370 · -2.1%
- By 2040
- 103,828 · -7.1%
- By 2050
- 98,523 · -11.8%
- By 2075
- 91,422 · -18.2%
- By 2100
- 78,214 · -30.0%
Race, ethnicity, and origin ACS 2023
- Neighborhood character
- Predominantly White (91%)
- Race & ethnicity
- White 91% Two or more races 5% Hispanic / Latino 4%
- Common ancestry
- Lithuanian 7% Romanian 6% Polish 2%
- Foreign-born
- 1% · Canada, China
- Languages at home
- 93% English-only · German/W. Germanic 5% Spanish 2%
Political lean MEDSL · Jefferson
- 2024 margin
- Strong R (+23.6) · D 38.2% · R 61.8%
- 2008→2024 swing
- -18.3pp toward R · 2008: -5.3pp · 2024: -23.6pp
- All cycles
- 2024: R+23.6 2020: R+19.0 2016: R+22.4 2012: R+2.9 2008: R+5.3
Not yet ingested
- Civics
- —
Market trends
- HPI YoY
- ▲ 3.13%
- Current HPI
- 303.3172
- Rent YoY
- —
- Metro
- —
- State GDP YoY
- ▲ 2.60%
- F500 in state
- 92
Industry mix (Fortune 500 HQ in NY)
| Industry | F500 HQs | Revenue |
|---|---|---|
| Financial Services | 10 | $950B |
|
||
| Consumer Goods | 9 | $162B |
|
||
| Insurance | 4 | $225B |
|
||
| Telecommunications | 2 | $144B |
|
||
| Pharmaceuticals | 2 | $112B |
|
||
| Media / Entertainment | 2 | $69B |
|
||
Price history
+35.0% since first listed5 events — show timeline
- 2026-01-22 Pending — CNYIS
- 2026-01-02 Price Changed $120,000 CNYIS
- 2025-11-11 Listed $127,500 CNYIS
- 2015-03-25 Sold (MLS) $80,000 CNYIS
- 2014-05-14 Listed $88,900 CNYIS
Cash-flow waterfall
monthlySold comps — $/sqft
last 12 mo · ≤1 miLoading sold comps…