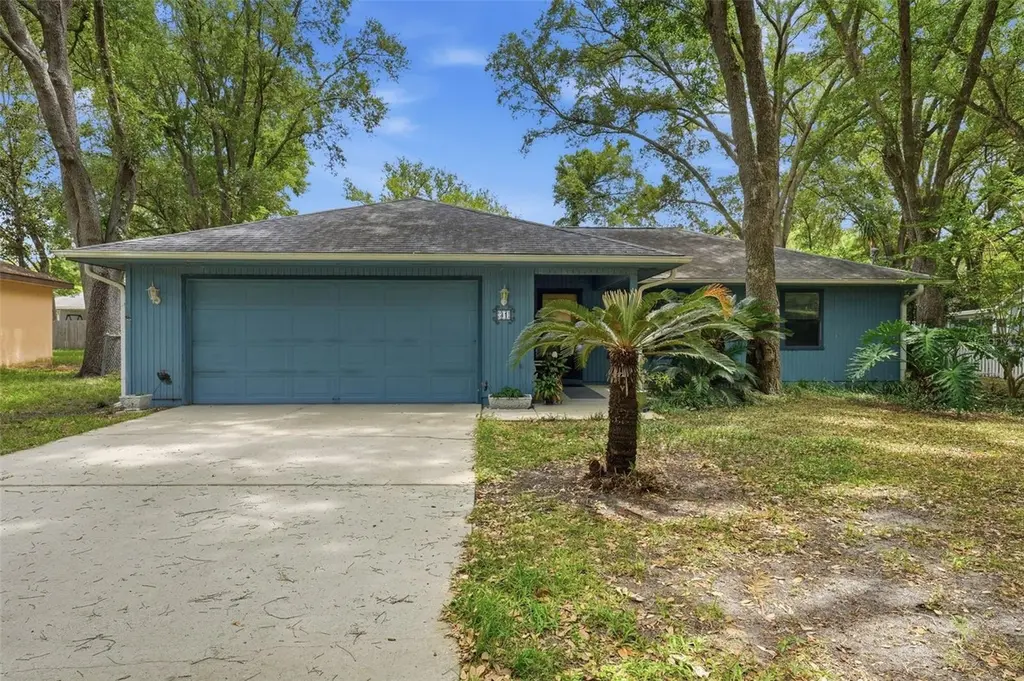
31 Almond Pass Dr · Silver Springs Shores, FL
Flood risk 1/10 · Minimal
- FEMA flood zone
- X (unshaded)
- Chance of flooding over 30 yrs
- 0.0%
- Est. flood insurance / yr
- $507 – $1,088
Fire risk 3/10 · Minor
- Est. fire insurance / yr
- $947 – $1,759
Heat risk 8/10 · Major
- Hot days now (above 108°F)
- 7 days/yr
- Hot days in 30 yrs
- 21 days/yr
Wind risk 9/10 · Severe
- Chance of severe wind over 30 yrs
- 99.0%
Air-quality risk 4/10 · Minor
- Unhealthy air days now
- 4 days/yr
- Unhealthy air days in 30 yrs
- 4 days/yr
Risk factors via First Street. Map © Google.
Why this score? — see what drove the C grade
The composite is a weighted blend of 9 inputs, each scored 0–100. Each bar is that input's sub-score; the figure is the points it added to the 100-point composite (weight × sub-score).
- Cash flow +15.8/30.0
- ARV discount +12.3/15.0
- Appreciation +8.0/10.0
- DSCR +4.9/10.0
- Schools +3.6/10.0
- Livability +3.4/5.0
- 1% rule +3.3/10.0
- Rent growth +2.5/5.0
- Condition / age +2.5/5.0
$197,000
🖨 Deal sheet 📄 Offer letter ✓ Due diligence
Listing remarks
Under contract-accepting backup offers. Don't miss this deal! Owner has it priced for a quick sale. This 3 bedroom 2 bath house has amazing potential. With a little cosmetic TLC you will have a real gem! The roof was replaced in 2018, A/C was replaced in 2014. It sits on a quarter acre (. 24) of fenced in and landscaped yard. The large screened-in lanai is a great spot for relaxing. It comes with a Vivant security system with Ring doorbell which is remotely controlled via your phone. Come see this one before it gets away!
Key facts
- Screened-in lanai
- Landscaped yard
- Ring doorbell
Tags
Property features AI
Finance
- Other: Property type: Residential - Single Family Residence; Lot size about 0.24 acres; Building area reported about 1,992 total square feet
- HOA & community: No HOA association indicated; Pets allowed
Exterior
- Parking: Attached garage; 2-car garage
- Utilities: Public water; Private sewer; Broadband / high-speed internet available; Electric service
- Home design: Single-family residence; One story; Home faces south; Residential zoning (R1); Homestead status
- Construction: Wood siding exterior; Shingle roof; Block foundation; Built with approximately 1,206 living area (public records)
- Exterior features: Patio; Screened porch; Private mailbox; Wood fencing; Mature landscaping; Asphalt road access; Lot dimensions approximately 84 x 125
Interior
- Kitchen: Dishwasher; Disposal; Microwave; Range; Electric water heater
- Bedrooms: 3 bedrooms
- Flooring: Carpet; Vinyl
- Bathrooms: 2 full bathrooms
- Heating & cooling: Central heating (Electric, Heat Pump); Central air conditioning
- Interior features: Cathedral ceilings; Ceiling fans; Living room / dining room combo; Solid wood cabinets; Thermostat
- Laundry & utility: Washer; Dryer; Electric dryer hookup
Neighborhood map
What this means for you Summary
Snapshot
- This is a 3-bed/2.0-bath single-family listed at $197k.
Deal economics
- At list price, monthly cash flow is $91 ($1k/yr) — positive.
- The deal already cash-flows at list — no discount required.
- To meet the 1% rule (rent ≥ 1% of price), the offer needs to be $164k (16.7% below list).
- Recommended offer: $164k (16.7% below list) — sets the bar for 1% rule.
- Cap rate 6.8% vs local median 4.7% in Silver Springs Shores — top-decile yield for the area; either an underpriced asset or a hidden risk that comps aren't pricing in. Stress-test before assuming the spread holds.
Location & tenants
- Location reads 68/100 on livability (#527 in FL) — a middle-class / working-renter tenant base. Strengths: cost of living A+, housing A+, health & safety A-; Watch: crime C-, employment D, schools F.
- Marion (rural): math 42% / reading 43% proficiency, ranked #61 of 73 in FL (top 84%) — families likely to look elsewhere, expect single-tenant / working-renter base with shorter leases; 61% free/reduced lunch — lower-income household profile, screen leases tightly.
- Market conditions: Rents flat; 674 active listings in the ZIP; 21 comparable units currently listed for rent nearby; rentals at typical pace (median 22d on market — plan ~3-4 weeks tenant-placement turnaround); 7,071 units permitted in Marion County in 2024 (534 in 5+ unit buildings).
- This rent runs 31% of the median local income ($64k/yr) — at the standard rent-burdened threshold; future hikes will face affordability resistance.
Forward outlook
- In year one you build about $13k of equity ($1k loan paydown + $12k appreciation (5.9% local appreciation)).
- Marion County population projected at +13% by 2050 — modest demand growth; plan on rents tracking national, not racing it.
- At projected returns (5.9% appreciation + 0.2% rent growth), your $55k cash investment doubles in ~4 years — after that, you're playing with house money.
- By year 3, paydown + projected appreciation supports a ~$32k cash-out refi (75% LTV) — recoverable capital for the next deal without selling this one.
Negotiation context
- Only 4 days on market — expect competitive offers; lowballing is unlikely to land.
- Current owner paid $60k; list at $197k implies a 229% gain — meaningful room to come down on a strong offer.
Risks & watch-outs
- Climate carrying-cost: severe wind risk, 99% chance of damaging wind over 30y; extreme-heat days projected 7→21/yr by 2055 (HVAC capex compounding) — expect insurance premiums to compound above CPI over the hold.
Questions for the listing agent
- Is there a deadline driving the sale (1031 exchange, divorce, estate, relocation)? That informs how much negotiation room exists.
- Schools are F-rated, which usually means shorter tenancies and higher turnover. Who's the typical renter profile here, and what's been the actual vacancy rate?
- What's the average days-on-market for RENTAL listings here right now (not sales)? A rising rental-DOM trend means longer vacancies and softer asking-rent achievability than the comps imply.
- What's the recent tenant-quality profile in this submarket — average credit score on applications, eviction rate, late-payment / NSF rate, and stable-employment percentage? A property-management company in the area should have these aggregated.
- How much new for-sale + rental construction is in the pipeline within 1–3 miles? Heavy new supply typically softens prices + rents 12–24 months out; constrained supply supports both.
Investment metrics
- 1% rule
- 0.83% ✗
- Cap rate
- 6.85%
- Cash-on-cash
- 1.97%
- DSCR
- 1.09
- GRM
- 10.0
CMA / ARV
- ARV (on-the-fly)
- $220,698
- Comps found
- 12
Show comp detail 12 sales within ~0.75 mi
| Address | Dist | Beds/Ba | Sqft | Sold | Price | $/sf | Match |
|---|---|---|---|---|---|---|---|
| 40 Teak Run | 0.13mi | 3/2.0 | 1,118 (-7%) | 2mo | $180,000 | $161 | 80 |
| 6 Almond Trce | 0.40mi | 3/2.0 | 1,307 (+8%) | 2mo | $230,000 | $176 | 66 |
| 28 Teak Run | 0.22mi | 3/2.0 | 1,128 (-6%) | 17mo | $244,900 | $217 | 65 |
| 71 Almond Rd | 0.18mi | 3/2.0 | 1,308 (+8%) | 20mo | $245,000 | $187 | 61 |
| 51 Almond Rd | 0.06mi | 3/2.0 | 1,381 (+14%) | 14mo | $253,000 | $183 | 61 |
| 70 Almond Pass Dr | 0.32mi | 3/2.0 | 1,309 (+8%) | 12mo | $235,000 | $180 | 61 |
| 6727 Cherry Rd | 0.39mi | 3/2.0 | 1,237 (+3%) | 20mo | $235,000 | $190 | 60 |
| 30 Almond Rd | 0.16mi | 3/2.0 | 1,328 (+10%) | 21mo | $140,000 | $105 | 58 |
| 111 Almond Rd | 0.46mi | 3/2.0 | 1,128 (-6%) | 12mo | $259,000 | $230 | 58 |
| 5720 SE 22nd Pl | 0.48mi | 3/2.0 | 1,276 (+6%) | 13mo | $245,750 | $193 | 57 |
| 113 Teak Loop | 0.30mi | 2/2.0 (-1) | 1,050 (-13%) | 3mo | $120,000 | $114 | 57 |
| 28 Banyan Pass | 0.63mi | 2/2.0 (-1) | 1,114 (-8%) | 7mo | $204,000 | $183 | 47 |
Match score weights: distance 35% · size 25% · config 20% · recency 20%. Top-matched comps best support the ARV.
Projected returns pro-forma
5.93% appreciation · 0.17% rent growth · sell at horizon
- IRR
- 15.7%
- Equity multiple
- 2.04×
- Total profit
- $57,248
- Equity at exit
- $123,004
- IRR
- 14.9%
- Equity multiple
- 3.82×
- Total profit
- $155,721
- Equity at exit
- $222,340
Cash invested: $55,160 (down + closing). Projections, not guarantees.
Landlord ↔ Tenant lean methodology
- Overall (STATE)
- 87 Strongly Landlord-Friendly
- State Florida
- 87 Strongly Landlord-Friendly · R+3
- County
- — inherits STATE
- City
- — inherits STATE
ZIP-level market 34472
- Home prices YoY
- 2.4%
- Rents YoY
- 0.2%
- Active inventory
- 674
- Price-to-rent
- 10.0×
Monthly cashflow live
- Estimated rent
- $1,642 high interval (Pro) →
- Mortgage (P&I)
- −$1,033
- Tax from tax record
- −$91 /mo · $1,094/yr
- Insurance
- −$82
- HOA
- −$0
- Vacancy / Maint / Mgmt
- −$345
- Net cashflow
- $91
Break-even live
UW: 25.0% down · 7.5% · 30yr · 1.5% tax · 5.0% vac · 8.0% maint · 8.0% mgmt
Financing live
Cash to close
- Down payment
- $49,250
- Closing costs
- $5,910
- Reserves months
- —
- Total cash needed
- —
Loan-product check · same deal, 3 products live
Conventional
25% down · 7.5% · 30yr
- Down + closing
- —
- Monthly P&I
- —
- Monthly cashflow
- —
- DSCR
- —
- Eligible?
- —
Personal DTI + credit; lowest rate.
DSCR
20% down · 8.5% · 30yr
- Down + closing
- —
- Monthly P&I
- —
- Monthly cashflow
- —
- DSCR
- —
- Eligible?
- —
No personal income docs; deal must DSCR.
Hard money
10% down · 12.0% · 12mo
- Down + closing
- —
- Monthly P&I
- —
- Monthly cashflow
- —
- DSCR
- —
- Eligible?
- —
Short-term bridge; refi at stabilization.
Rent comps 21 comps
| Address | Beds | Baths | Sqft | Rent | $/sqft | DOM | Units | Dist |
|---|---|---|---|---|---|---|---|---|
| 62 Teak Loop Ocala, FL | 3.0 | 1.0 | 1018 | $1,450 | $1.42 | 14d | 1 | 0.16mi |
| 9 Banyan Course Run Ocala, FL | 3.0 | 2.0 | 1345 | $1,599 | $1.19 | 21d | 1 | 0.28mi |
| 6688 Cherry Rd Ocala, FL | 3.0 | 2.0 | 1270 | $1,950 | $1.54 | 14d | 1 | 0.39mi |
| 1503 Peachtree Ln Ocala, FL | 2.0 | 2.0 | 1152 | $1,450 | $1.26 | 21d | 1 | 0.63mi |
| 9 Teak Way Dr Ocala, FL | 3.0 | 2.0 | 1352 | $1,800 | $1.33 | 14d | 1 | 0.64mi |
| 5435 SE 28th Ln Ocala, FL | 2.0 | 2.0 | 868 | $1,150 | $1.32 | 21d | 1 | 0.82mi |
| 2955 SE 53rd Ct Unit C Ocala, FL | 2.0 | 2.0 | 854 | $1,295 | $1.52 | 21d | 1 | 0.94mi |
| 5370 SE 30th Pl Unit Greenfields C Ocala, FL | 2.0 | 2.0 | 1000 | $1,150 | $1.15 | 21d | 1 | 0.94mi |
| 3030 SE 53rd Ct Unit B Ocala, FL | 2.0 | 2.0 | 854 | $1,150 | $1.35 | 21d | 1 | 0.99mi |
| 3030 SE 53rd Ct Unit A Ocala, FL | 2.0 | 2.0 | 854 | $1,200 | $1.41 | 14d | 1 | 0.99mi |
| 19 Pecan Pass Ter Ocala, FL | 3.0 | 2.0 | 1368 | $1,750 | $1.28 | 21d | 1 | 1.11mi |
| 5230 SE 31st St Unit Whispering Sands D Ocala, FL | 2.0 | 1.5 | 1000 | $1,050 | $1.05 | 21d | 1 | 1.13mi |
| 5614 Pecan Rd Ocala, FL | 3.0 | 2.0 | 1337 | $1,595 | $1.19 | 21d | 1 | 1.13mi |
| 5200 SE 31st St Unit D Ocala, FL | 2.0 | 1.5 | 945 | $1,250 | $1.32 | 21d | 1 | 1.14mi |
| 5011 SE 29th St Apt C Ocala, FL | 2.0 | 1.0 | 1000 | $990 | $0.99 | 14d | 1 | 1.18mi |
| 36 Pecan Run Crse Ocala, FL | 3.0 | 2.0 | 1188 | $1,850 | $1.56 | 14d | 1 | 1.23mi |
| 96 Redwood Rd Ocala, FL | 3.0 | 2.0 | 1188 | $1,650 | $1.39 | 14d | 1 | 1.33mi |
| 13 Redwood Trace Ln Ocala, FL | 3.0 | 2.0 | 1337 | $1,595 | $1.19 | 21d | 1 | 1.46mi |
| 106 Redwood Track Crse Ocala, FL | 3.0 | 2.0 | 1412 | $1,675 | $1.19 | 14d | 1 | 1.46mi |
| 15 NE 63rd Ct Ocala, FL | 3.0 | 2.0 | 1500 | $1,700 | $1.13 | 21d | 1 | 1.48mi |
| 4549 SE 25th Loop Ocala, FL | 3.0 | 2.0 | 1490 | $1,850 | $1.24 | 21d | 1 | 1.48mi |
Listing history 9 events
-
2026-06-03remarks 531-char remark
-
2026-06-03status $197,000 Pending 4 DOM
-
2026-06-02days on market $197,000 Active 4 DOM
-
2026-06-01days on market $197,000 Active 3 DOM
-
2026-06-01pricestatus $197,000 Active 2 DOM
-
2026-05-13status Pending
-
2026-05-10$169,900 Active
-
1990-11-01soldstatus $59,900
-
1987-07-01soldstatus $52,360
ⓘ Source: listings_history table (triggers on properties + properties_extension) + one-shot
backfill from property_details.listing_events for pre-trigger history.
Tax reassessment forecast FL · Resets to sale price
- Current annual tax
- $1,094 · $91/mo
- Projected year-2 tax
- $1,635 · $136/mo
- Expected delta
- +$541/yr (+$45/mo · 49.5%)
ⓘ Screening estimate from a state-policy table — verify with the county assessor before closing.
Climate risk First Street
- Flood 1/10 Low FEMA zone X (unshaded) · 0% chance over 30 yrs
- Wildfire 3/10 Moderate
- Heat 8/10 Severe 7 d/yr ≥108°F today · 21 d/yr by 30 yrs out
- Wind 9/10 Extreme 99% chance of damaging wind over 30 yrs
- Air quality 4/10 Moderate 4 unhealthy d/yr today · 4 by 30 yrs out
Nearby sold comps map
Loading sold comps map…
Walkable amenities ~0.75 mi
Loading nearby amenities…
Taxation est. · year 1
- Rental income
- $19,701
- − Mortgage interest
- −$11,035
- − Property taxes
- −$1,094
- − Insurance
- −$985
- − Repairs & maintenance
- −$1,576
- − Management
- −$1,576
- − Depreciation
- −$5,731
- Taxable loss
- −$2,296
- Est. tax savings @ 24.0%
- +$551
- After-tax cash flow
- $1,639/yr
For passive investors: Depreciation is non-cash, so a rental often shows a tax loss while cash-flowing — sheltering income. Rental losses are passive: they offset passive income freely, and up to $25,000/yr can offset ordinary (W-2) income if you actively participate and your MAGI is under $100k (phasing out to $0 by $150k); unused losses carry forward. On sale, claimed depreciation is recaptured at up to 25%, and gains may owe capital-gains tax (a 1031 exchange can defer both). Figures are a year-1 estimate at your 24.0% rate — not tax advice; consult a CPA.
Schools (NCES district)
- District
- Marion
- NCES district ID
- 1201260
- Math proficiency
- 42% ▼ -7.00%
- Reading proficiency
- 43% ▼ -4.00%
- Median HH income
- $40,015
- Composite
- 35.61/100
- National rank
- #4890
- State rank
- #61 of 73 in FL
Livability — Silver Springs Shores
- Score
- 68/100
- State rank
- #527
- US rank
- #9854
Category grades
Schools grade is shown separately in the Schools card above.
Census & demographics
- County
- Marion County · 315,796 people
- City population
- 34,665
- Metro
- Ocala, FL
- Population (ZIP)
- 35,851
- Household income
- $64,208
- Rent vs Own
- Severe rent burden
- 655.0
Population outlook (Marion County) Hauer SSP2
- Today (2025)
- 365,905 people
- By 2030
- 376,768 · +3.0%
- By 2040
- 396,555 · +8.4%
- By 2050
- 412,723 · +12.8%
- By 2075
- 446,090 · +21.9%
- By 2100
- 436,193 · +19.2%
Race, ethnicity, and origin ACS 2023
- Neighborhood character
- Diverse neighborhood (Simpson 0.65)
- Race & ethnicity
- White 50% Hispanic / Latino 25% Black 21% Two or more races 18% Asian 2%
- Hispanic origin (detail)
- Mexican 2% Puerto Rican 14% Cuban 3%
- Common ancestry
- Romanian 2% Iranian 1% Lithuanian 1%
- Foreign-born
- 11% · Canada, Jamaica, China
- Languages at home
- 78% English-only · Spanish 19% Other Indo-European 1%
Political lean MEDSL · Marion
- 2024 margin
- Solid R (+31.6) · D 33.8% · R 65.5%
- 2008→2024 swing
- -20.0pp toward R · 2008: -11.6pp · 2024: -31.6pp
- All cycles
- 2024: R+31.6 2020: R+25.9 2016: R+26.2 2012: R+16.2 2008: R+11.6
Not yet ingested
- Civics
- —
Market trends
- HPI YoY
- ▲ 5.93%
- Current HPI
- 255.0714
- Rent YoY
- ▲ 0.17%
- Metro
- Ocala, FL
- State GDP YoY
- ▲ 3.28%
- F500 in state
- 36
Industry mix (Fortune 500 HQ in FL)
| Industry | F500 HQs | Revenue |
|---|---|---|
| Industrial Technology | 2 | $29B |
|
||
| Insurance | 2 | $17B |
|
||
| Retail | 1 | $60B |
|
||
| Technology Distribution | 1 | $58B |
|
||
| Homebuilding | 1 | $35B |
|
||
| Technology Manufacturing | 1 | $35B |
|
||
Price history
+224.5% since first listed4 events — show timeline
- 2026-05-13 Pending — Stellar MLS as Distributed by MLS Grid
- 2026-05-10 Listed $169,900 Stellar MLS as Distributed by MLS Grid
- 1990-11-01 Sold (Public Records) $59,900 Public Records
- 1987-07-01 Sold (Public Records) $52,360 Public Records
Property tax history
+3.2%/yrLatest (2025): $1,094 · +24.9% YoY. Source: county tax records.
Cash-flow waterfall
monthlySold comps — $/sqft
last 12 mo · ≤1 miLoading sold comps…